


Abstract
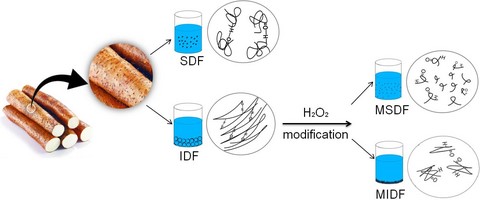
Yam is a common ‘medicine food homology’ vegetable in Asia, and its peel is often considered a food residue during processing or cooking. In this work, the effects of hydrogen peroxide modification on the dietary fibres (DFs) from Chinese yam peel (CYP) were investigated. The structural characteristics of soluble dietary fibre (SDF), insoluble dietary fibre (IDF), modified soluble dietary fibre (MSDF) and modified insoluble dietary fibre (MIDF) were analysed using Fourier-transform infrared spectroscopy, X-ray diffraction, differential scanning calorimetry, granularity analysis, scanning electron microscopy and GC-MS (monosaccharide composition). As results, after modification with hydrogen peroxide, the sizes of the DFs were reduced and MIDF exposed more cellulose. Experiments on the physicochemical and functional properties of DFs showed that MSDF and MIDF obtained a better water holding capacity, oil absorption capacity, swelling capacity and absorption abilities with altered structures, which is of great importance in food processing and development.
Introduction
Yam (Dioscorea), a kind of perennial herb and a popular food, is one of the most important root and tuber crops cultivated in the world. According to the statistics, over 90% of the worldwide yam production occurs in the yam belt of West and Central Africa, with Nigeria alone accounting for approximately 68% of the world's total production (Otegbayo et al., 2014). However, yam peel (approximately 20% of the yam tuber) is often considered a food residue during processing or cooking, which results in a tremendous waste of resources, and may cause environmental pollution. In Ghana, a laboratory scale solid-state anaerobic digester was constructed to digest yam peel, an abundant organic residue in Ghana (Heiske et al., 2015). Yam peel was also applied for the growth of locally isolated Aspergillus niger and amylase production in Nigeria (Uguru et al., 1997). Attempts were also made to remove Cd(II) ion from an aqueous solution using dried yam peel power in Nigeria (Asuquo et al., 2018). The yam peel is also rich in the active substances. The crude extracts from yam peel showed protective effects on tert-butylhydroperoxide-induced oxidative stress in mouse liver cells and carbon tetrachloride-induced hepatotoxicity in rats (Hsu et al., 2011; Yeh et al., 2013). Furthermore, dietary fibre (DF), which is also abundant in yam peel, plays an important role in lowering blood sugar and blood pressure, and has anti-tumour and anti-ageing properties (Ma & Mu, 2016).
DF is usually prepared using chemical, physical and/or enzymatic methods (Park et al., 2013). Chemical treatment has been considered as the most important approach among all techniques to increase the solubility of DF because chemical reagents cause less damage to the molecular structure of the DF, and content of SDF is increased more efficiently (Bader Ul Ain et al., 2018).
Hydrogen peroxide is a natural metabolite present in many organisms and participates in various biological routes, especially those involved in the decomposition of lignin by fungi within complex enzyme systems (Dutra et al., 2018). Alkaline hydrogen peroxide treatment is a type of chemical modification for DF, which has positive effects on polysaccharide degradation and lignin removal as well as an increase in the dissolution of hemicellulose and improvement in the hydration of cellulose (Sourki et al., 2013).
Hence, the objectives of the research include the following: (i) modifying the dietary fibres from Chinese yam peel (CYP) using alkaline hydrogen peroxide; (ii) characterising the obtained fibres by FT-IR spectroscopy, X-ray diffraction (XRD, crystallinity), differential scanning calorimetry (DSC), granularity analysis, scanning electron microscopy (SEM) and GC-MS (monosaccharide composition); and (iii) investigating the physicochemical properties of the fibres. The information obtained will aid the application of the fibres in food industry, which is of great importance for resources recycling and environmental protection .
Materials and methods
Materials
Yams were cultivated and harvested in the region of Mingquan, Henan Province, China. The yams were peeled. After washing thoroughly, the peels were dried at 50 °C in a drying oven. The dried peels were made into a powder using a pulveriser, and the powder was sieved through an 80 mesh sieve.
Reagents
Neutral protease (enzyme activity ≥ 100 000 U g−1 solid powder) and glucoamylase (enzyme activity ≥ 100 000 U g−1 solid powder) were purchased from Jiangsu Ruiyang Biotechnology Co., Ltd. (Jiangsu, China). Unless otherwise stated, all reagents used in this study were of reagent grade.
Ultrasound-assisted enzymatic (UAE) extraction of DF
CYP powders were mixed with distilled water in a ratio of 1:40 g mL−1 and adjusted to pH 7.0 using 1 mol L−1 NaOH in a 55 °C water bath. Neutral protease (0.3%) was added to remove protein, and the slurry was enzymatically hydrolysed in an experimental ultrasonic bath at 200 W and 55 °C for 40 min. After the first UAE extraction, the solution was heated in a 100 °C water bath for 5 min to destroy the neutral protease and then cooled to 60 °C. The slurry was adjusted to pH 4.5 by using 1 mol L−1 HCl and was then treated with 4% glucoamylase. Then, the second enzymatic hydrolysis process was performed at 200 W and 55 °C for 40 min. The slurry was then put in a boiling water bath for 5 min to terminate the hydrolysis. After cooling, the slurry was centrifuged at 2862 g for 20 min. The precipitation was washed with 95% ethanol and then dried at 60 °C to obtain IDF. The weight was then used to calculate the yield of IDF. The supernatant was concentrated to one-quarter of the original volume, and then, 4 volumes of 95% ethanol were added, and the mixture was left to stand overnight to precipitate the SDF. Then, the precipitation was dried at 60 °C and redissolved with a tiny bit of water. After lyophilisation, the precipitation was weighed to calculate the yield of SDF. The yields of SDF and IDF were calculated as follows:
Modification of dietary fibre
The sample used for modification was IDF, which was obtained from UAE extraction. IDF was soaked in pH 11.5 and 1% hydrogen peroxide solution, and the solid–liquid ratio was 1:20 (g mL−1). After the extract was heated in a 40 °C water bath for 2 h, 0.5 mol L−1 HCl was added to adjust the pH value of the mixture to 7. The mixture was then centrifuged at 4472 g for 20 min. The pellet was then washed with 95% ethanol and dried at 60 °C to obtain the modified insoluble dietary fibre (MIDF). The supernatant was precipitated with 4 volumes of 95% ethanol and left overnight. The precipitate was freeze-dried to obtain the modified soluble dietary fibre (MSDF). The yields of MSDF and MIDF were calculated as follows:
Basic composition analysis and colour measurement
The fat, moisture and ash contents were determined according to the AOAC 922.06, AOCS Ba 2a-38 and AOAC 942.05 methods, respectively. The colour of DF was determined using a colorimeter (NR20XE, 3nh, China), and the results were expressed using the CIELAB system.
Structure analyses
Fourier-transform infrared (FT-IR) spectroscopy
The individual DF and MDF samples were blended with spectroscopic grade KBr powder and then pressed into 1-mm pellets for FT-IR measurements. A Fourier-transform infrared spectrophotometer (FT/IR3000, Jusco, Japan) was used to determine the FT-IR spectra of samples in the frequency range of 4000–400 cm−1.
X-ray diffraction (XRD) measurements
XRD analysis was performed using a Bruker D8 Advance X-ray diffractometer (PANalytical, X7Pert, the Netherlands) with a Cu X-ray source operated at 30 mA and 40 kV. The degree of crystallinity was calculated from the X-ray diffraction patterns by the following equation using Jade 6.0 software:
where I002 is the maximum intensity (in arbitrary units) of the 002 lattice diffraction and Iam is the intensity of diffraction in the same units at 2θ = 18° (Segal et al., 1959).
Differential Scanning Calorimetry (DSC) measurements
DSC analysis was performed on a Mettler-Toledo DSC-1 system (Greifensee, Switzerland) under nitrogen at a heating rate of 15 °C min−1 from 25 °C to 400 °C.
Granularity analysis
The average particle sizes of the SDF and MSDF samples were measured by a laser particle size analyzer (Nano ZS90, Malvern Instruments Ltd., England).
Scanning electron microscopy (SEM)
The morphological features of the samples were investigated using a Zesis EVO10 field emission scanning electron microscope (JSM-5610LV, JEOL, Japan).
Monosaccharide analysis
Monosaccharide analysis was conducted using the method of Wang et al. (2015).
Physical properties
Water holding capacity (WHC) and oil absorption capacity (OAC)
The WHC of DF was determined by the modified method described by Requena et al. (2016). The OAC was determined according to the method reported by Caprez et al. (1986).
Swelling capacity (SC)
The SC of IDF or MIDF was measured by the method of Requena et al. (2016).
Rheological properties
The rheological measurements were carried out according to the method of Yang et al. (2019), with a rheometer (RST-CC, Brookfield, USA).
Functional properties
The nitrite-scavenging capacities (NSC) of DFs were examined according to a previously described method (Sun et al., 2007). The cholesterol absorption abilities (CAA) of the samples were determined using the phthalic aldehyde method (Bai et al., 2010) at 550 nm.
Statistical analyses
Each experiment was carried out in triplicate. The data were analysed using DPS 7.5 and Origin 9. Differences among samples were assessed by analysis of variance (ANOVA). The data are expressed as the mean ± standard deviation (SD). P < 0.05 was considered statistically significant.
Results and discussion
Basic composition analysis and colour measurement
The physicochemical properties of our samples are shown in Table 1. Compared with SDF, the yield of MSDF increased from 8.20% to 11.24%, while the yield of MIDF decreased slightly. The contents of water and fat of the four samples showed no significant differences, and the fat level was relatively low. However, the components of ash decreased greatly after modification (P < 0.5). As shown in Table 1 and Fig. 1, it is clear that the colour of the modified dietary fibres improved substantially, with lightness values of 73.87 and 77.62 for MSDF and MIDF compared with 63.85 and 53.88 for SDF and IDF, respectively.
The yield, basic contents, colour, WHC, OAC, SC, crystallinity, particle size and absorption abilities of DFs from CYP
| SDF | MSDF | IDF | MIDF | |
|---|---|---|---|---|
| Yield | 8.20% ± 0.00d | 11.24% ± 0.01c | 22.35% ± 0.01a | 14.09% ± 0.01b |
| Water (g 100 g−1) | 6.02 ± 0.00a | 6.05 ± 0.02a | 6.22 ± 0.01a | 7.37 ± 0.00a |
| Fat (g 100 g−1) | 0.96 ± 0.00a | 0.85 ± 0.02a | 1.90 ± 0.01a | 0.91 ± 0.00a |
| Ash (g 100 g−1) | 6.68 ± 0.01c | 5.34 ± 0.00d | 8.47 ± 0.03a | 7.19 ± 0.02b |
| L* | 63.85 ± 1.51c | 73.87 ± 066b | 53.88 ± 0.79d | 77.62 ± 0.37a |
| a* | 6.01 ± 0.47c | 9.59 ± 0.52a | 6.57 ± 0.23bc | 7.25 ± 0.34b |
| b* | 10.39 ± 0.09d | 21.79 ± 0.39a | 12.13 ± 0.60c | 20.10 ± 0.81b |
| △E | – | 2.90 ± 0.04a | – | 2.91 ± 0.06a |
| WHC (g g−1) | 1.89 ± 0.24d | 7.00 ± 0.04c | 10.67 ± 0.47b | 15.59 ± 0.36a |
| OAC (g g−1) | 5.46 ± 0.09b | 7.99 ± 1.14a | 5.06 ± 0.20b | 5.39 ± 0.00b |
| SC (mL g−1) | – | – | 7.00 ± 0.71b | 16.65 ± 2.62a |
| Crystallinity | 27.93% | 12.28% | 6.54% | 14.29% |
| Particle size (d, nm) | 637.30 ± 99.52c | 179.70 ± 29.26c | 6317 ± 117.34a | 4257.5 ± 183.14b |
| NSC | 46.34%±0.03b | 50.90%±0.02a | 43.51%±0.01c | 32.61%±0.02d |
| CAA (mg g−1) | 7.24 ± 0.61b | 13.45 ± 0.41a | 1.56 ± 0.31d | 3.79 ± 0.30c |
Values were means ± SD of three determinations.
Values of a–e are significantly different in the same line, P < 0.05. ‘–’ represented not detected.
![The power and SEM images of (a) SDF, (b) MSDF, (c) IDF and (d) MIDF obtained from CYP (200 × ). [Colour figure can be viewed at wileyonlinelibrary.com]](https://oup.silverchair-cdn.com/oup/backfile/Content_public/Journal/ijfst/55/3/10.1111_ijfs.14405/1/m_ijfs14405-fig-0001-m.jpeg?Expires=1750222908&Signature=ahU68qukodCAwBBNOWA3hiOMAPbuT-slY1e9pDewMIs22-NFQsbIadOYuAAOapTs8sRIMK72~nLmpxiAJJusZUV8OkHmjMqWnbd4np9h0VEqgL08Y6ijMLJswcnVzbWuZJ1zEG5LpDUvn5Er-Hxd6cqsUcMDUE7s9zzgGlb72CXtBVQawRxY1w~hbCmSQjPeG9eILi~pPKp2MLf3uVFFTX4HdYsR~O8kzxzDWL4aG60Cux9eVoykMJsz2gw8jjLtKx3rIl3ThYCOJ4sd8zg9V9G~-JUsBKaUpWeKoqNfhJTikvVUPWd4KoUyC7fOOIie2Ai4KlJVV8iwAWqtHaPrhA__&Key-Pair-Id=APKAIE5G5CRDK6RD3PGA)
The power and SEM images of (a) SDF, (b) MSDF, (c) IDF and (d) MIDF obtained from CYP (200 × ). [Colour figure can be viewed at wileyonlinelibrary.com]
Structure analyses
FT-IR spectroscopy
As shown in Fig. 2a, the broad bands located at approximately 3400 cm−1 were attributed to O-H stretching vibrations, which were mainly provided by polysaccharide hydroxyls. The peaks at 2920 cm−1 were the typical C-H stretching vibrations, which were mainly provided by polysaccharide methylenes (Yang et al., 2019). There was a prominent peak at 1739 cm−1 for SDF, which reflected the stretch vibration of the C=O that originated from the ester bond of the carboxy group. However, the peak at 1739 cm−1 was weakened in the MSDF and it was reported that the number of C=O bonds decreased because of the cyclisation in the fibres, which was induced by the hydrogen peroxide modification (Liu et al., 2012). The bands at 1424–1640 cm−1 were representative of C=O stretch vibrations, and carboxyl-conjugated carbonyl stretches are generally increased after significant oxidation by hydrogen peroxide, which also indicates that the water adsorption of the MDFs was enhanced (Yang et al., 2019). Therefore, the oxidation of hydrogen peroxide causes the breakage of intramolecular hydrogen bonds, and electron density cannot be equalised, thus leading to the increase in wavenumber and left shift of peaks (Bai et al., 2013). The peak at 1379 cm−1 corresponded to C-H bend vibrations. Brígida et al. (2010) observed that the absorption peak between 1370 and 1390 cm−1 was a symmetrical and an asymmetrical deformation of C-H in the cellulose and hemicellulose groups. These bands are more accentuated in the spectra of NaOCl-, NaOH- and H2O2-treated fibres, which can be indicative of a larger exposition of cellulose and hemicellulose on the fibre surface. It was also demonstrated by Plastina Cardoso et al. (2016), that the bands at 1380 cm−1 were more representative in the modified fibres treated with alkaline hydrogen peroxide, highlighting the loss of lignin and indicating greater exposure of cellulose. The bands at 1116–1246 cm−1 represented C-O vibration of esters, ethers and phenols. MIDF and MSDF showed a weak peak compared with IDF and SDF, indicating the decomposition of the MDFs. The bands at 1022–1084 cm−1 were indicative of C-OH stretch vibrations. Peaks at 781–894 cm−1 represented the C-H bending vibrations of β-glucopyranose, and IDF showed a stronger peak than SDF at 893 cm−1. Peaks at 617 cm−1 weakened drastically after modification. This result could be ascribed to the breakage of long chain CH2, resulting in a decrease of the amount of carbon in carbon chains and a weakness in the intensity of absorption bands.
![FT-IR spectra (a), XRD measurements (b) and DSC analysis (c) of DFs from CYP. [Colour figure can be viewed at wileyonlinelibrary.com]](https://oup.silverchair-cdn.com/oup/backfile/Content_public/Journal/ijfst/55/3/10.1111_ijfs.14405/1/m_ijfs14405-fig-0002-m.jpeg?Expires=1750222908&Signature=sig5wLSc59kvUarUjKWUdxp2mDcSNhbvmUbNf32xsuCCAXdP~7INdLapH78bPShkk3U2QdoG5Ne2R98jQVfqX~Nf1ZInPDsoap0Ab8oVlgQSayApUfdEU4VJFYxIXeirNEDU8WIuhC~03I-JyN6ZiC38npk1gFYp753ESNgAXzFaNNlywyCCP3iWj7vJUgA5iS5gbqweY4LYpKx8~7xdRfHtM42hdH8uTHnU0DIEKkIFKLY5SICYzH881iyvIj-YBhqqyf5DRATE1zpHW7GE5M5BnWsIdywGGcxHhQ1DOY~EfYOD0qHxEoFEAlJEdOUoVk1LhrWcNo2Euc5johY54w__&Key-Pair-Id=APKAIE5G5CRDK6RD3PGA)
FT-IR spectra (a), XRD measurements (b) and DSC analysis (c) of DFs from CYP. [Colour figure can be viewed at wileyonlinelibrary.com]
XRD measurements
The XRD patterns of the samples are shown in Fig. 2b, and the degrees of crystallinity are shown in Table 1. A sharp crystal diffraction peak near 21.8° of SDF was observed, and SDF also showed weaker crystal diffraction peaks near 14.3° and 31.7°. This performance indicated that SDF possesses an XRD feature of cellulose I (Alfred & Cintron, 2013). The crystal diffraction peaks near 14.3°, 23.6° and 31.7° of MSDF also implied that MSDF had an XRD curve characteristic of cellulose I. This result indicates that a state of coexistence forms from the two phases of crystalline and noncrystalline regions. However, SDF and MSDF had diffraction peaks near 44.3° and 45.4°, respectively, which means that there may be a smaller degree of polymerisation. It was apparent in the crystalline regions near 21.8° that the diffracted intensity of MSDF was lower than that of SDF, and the results showed that the crystallinity of MSDF (12.28%) was lower than that of SDF (27.93%). This finding suggests that the crystallite size of MSDF was decreased (Alfred & Cintron, 2013). The lowering of crystallinity indicated a lowered polymerisation of DF and a looser structure, which contributed to the increase in solubility, WHC and SC of the fibres.
In addition, IDF and MIDF also have XRD characteristics of cellulose I, and there was no significant change in the peak positions. In contrast to the SDF, the calculated crystallinity of MIDF (14.29%) was greater than that of IDF (6.54%), and the diffracted intensity at approximately 21° was notably increased. We hypothesise that the modification treatment exposed cellulose and led to an increase in crystallinity.
DSC measurements
As shown in Fig. 2c, one obvious endothermic peak at around 100 °C was observed in all samples, which could be ascribed to the evaporation of unbound water. The second endothermic peak at around 155 °C, indicating the evaporation of bound water, was observed in IDF, MIDF and SDF. However, the intensity of heat flow observed in MIDF was lower than that of IDF, indicating that the modification reduced the water content of IDF. In addition, the second endothermic peak (155 °C) disappeared in MSDF. Exothermic peaks above 280 °C were also observed in the samples, which may be the pyrolysis peaks for cellulose, hemicellulose and lignin.
Granularity analysis and scanning electron microscopy (SEM)
As shown in Table 1, the particle sizes of the DFs were significantly decreased after modification, and similar results were reported for straw and bagasse fibres (Sangnark & Noomhorm, 2003), which will result in a significant increase in electrostatic attraction and surface activity of van der Walls forces (Yang et al., 2019). The microstructure of DFs was revealed by SEM images (Fig. 1). As can be clearly seen, the surface of the MSDF was smoother, and the lamellar structure of MSDF decreased, while the SDF was coarse and had larger lamellar structures. MIDF and IDF had characteristic honeycomb structures with more cracks and holes; similarly, the fibre size decreased. Liu et al. (2012) found that the surface of the stabilized precursor fibres was much smoother than that of the unmodified ones, and this was consistent with the SEM image of MSDF. The increasing area of holes and valleys throughout the rough fibre surface can lead to increased hydration and absorption, which could be determined in the following functional analyses.
GC-MS analysis
The GC-MS results of DFs are shown in Fig. S1, and the results of the data retrieval with the NIST library are shown in Table 2. It is apparent that the monosaccharide compositions of DF and MDF are glucose, galactose, mannose, arabinose and xylose, while SDF contains galactose, glucose and mannose (Table 2). We observed that the galactose content of MSDF increased remarkably, which indicates that the treatment of hydrogen peroxide degraded insoluble polysaccharide such as arabinogalactan and galactomannan into oligosaccharides or small molecule polysaccharides. Furthermore, the glucose content of MSDF decreased, which may be due to the conversion of D-glucose to D-fructose and D-mannose in feebly alkaline solutions. Accordingly, the contents of mannose increased to some extent in these samples.
The monosaccharide composition of DFs from CYP
| Serial number | RT | Compound Name | Relevant content of each component | |||
|---|---|---|---|---|---|---|
| SDF | MSDF | IDF | MIDF | |||
| 1 | 10.18 | Arabinose | 0.07% | 0.19% | 2.06% | 1.21% |
| 2 | 10.53 | α-D-Arabinopyranose | 0.08% | 0.17% | 2.73% | 1.50% |
| 3 | 10.32 | 6-deoxy-2,3,4,5-tetrakis-O-(trimethylsilyl)-L-Mannose | 0.85% | 4.13% | 7.44% | 4.79% |
| 4 | 13.46 | 2,3,4,5,6-pentakis-O-(trimethylsilyl)-D-Mannose | 34.30% | 41.00% | 2.48% | 7.18% |
| 5 | 13.76 | α-D-Mannopyranose | 11.70% | 10.50% | 0.46% | 0.60% |
| 6 | 10.81 | L(-)-Fucose | 0.29% | 0.24% | 0.87% | 0.69% |
| 7 | 11.07 | I-Mannopyranose | 0.02% | 0.07% | 1.17% | 0.91% |
| 8 | 11.22 | D-Xylose | 1.19% | 0.07% | 7.93% | 8.92% |
| 9 | 11.8 | d-(+)-Xylose | 0.11% | 0.28% | 5.31% | 4.68% |
| 10 | 12.33 | β-D-Galactopyranose | 0.98% | 0.35% | 11.70% | 9.83% |
| 11 | 12.87 | α-D-Galactopyranose | 1.96% | 3.49% | 12.00% | 11.60% |
| 12 | 13.2 | α-D-Glucopyranose | 20.60% | 13.50% | 14.00% | 16.40% |
| 13 | 13.32 | β-D-Glucopyranose | 0.78% | 2.11% | 15.20% | 14.30% |
| 14 | 14.07 | D-Glucose | 18.00% | 7.84% | 13.90% | 15.90% |
| Total | 90.90% | 83.90% | 97.30% | 98.50% | ||
It can be seen that IDF and MIDF contain arabinose, mannose, xylose, galactose and glucose. The contents of the core composition of MIDF (arabinose and galactose) decreased slightly, which may be attributed to the decrease in the level of chemically linked hemicelluloses, which is predominantly due to a significant cleavage of ether linkages between lignin and polysaccharides. From FT-IR spectroscopy (Fig. 2a), we found that the peak of the C-O ether bond of MIDF was weakened. However, the glucose content of MIDF was increased, which may result from the depolymerisation of cellulose and noncellulose.
Physicochemical properties
WHC, OAC and SC analyses
Table 1 reveals significant differences in the WHC, OAC and SC of the four kinds of fibres. For the WHC, MIDF had the highest WHC (15.59 g g−1), which was greatly improved compared with IDF (10.67 g g−1). Similarly, the WHC of MSDF increased from 1.89 g g−1 to 7.00 g g−1. Furthermore, the OAC of MSDF reached the maximum value of 7.99 g g−1, which increased largely compared with SDF (5.46 g g−1). Even SC showed a significant increase (from 7.00 to 16.65 mL g−1) in IDF after modification, which might be caused by the breakdown and opening of the fibre structure (Yang et al., 2019). These results were similar to those reported by Plastina Cardoso et al. (2016), who hypothesised that this finding was due to the hydrolysis of lignin, which increased the exposure of hydroxyl groups in cellulose. It was argued that this treatment could remove hemicellulose and expose cellulose, resulting in larger voids that contribute to the entry of water (Kabir et al., 2012). Our GC-MS analysis also presented hemicelluloses hydrolysis (Table 2). Fibres that have high hydration capacity are beneficial to the sensory characteristics of bread and the extension of shelf life (Sourki et al., 2013).
Rheological properties
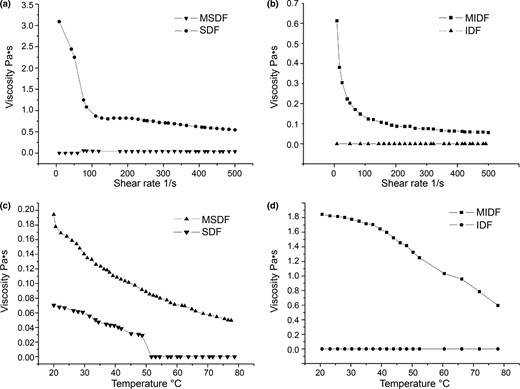
It is well established that the consumption of viscous fibres can alter the viscosity of digesta in the gastrointestinal tract, which would inhibit the absorption of glucose and cholesterol. As shown in Fig. 3a, a shear thinning behaviour was observed in MSDF at a concentration of 30% at 25 °C. For MSDF, a sharp decrease in apparent viscosity was observed at a shear rate of 0 to 100 s−1, and the apparent viscosity began to decrease slowly at high shear rates. However, at shear rates ranging from 0 to 100 s−1, SDF presented no apparent viscosity, which may be attributed to the weak torque of the fibre. As shown in Fig. 3c, at a concentration of 30%, the apparent viscosity decreased with an increase in temperature. Additionally, MSDF exhibited a higher apparent viscosity than SDF. As shown in Fig. 3b and Fig. 3d, the same results occur in insoluble samples, and MIDF exhibited a higher apparent viscosity than IDF.
Rheological properties of DFs from CYP.
According to Kabir et al. (2012), peroxide treatment initiated free radicals that reacted with the hydroxyl group of the fibre and with the matrix. As a result, fibre matrix adhesion along the interface occurs. Furthermore, the treatment also caused the increasing charge on the surface of the molecule (according to the decreasing granularity in Table 1), which could enhance the electrostatic interactions between the molecules and between the molecule and the solvent, thus increasing the flow resistance of the solution. The increase in the surface charge of the molecule also thickens the solvated layer of the molecule, which will lead to the further extension of the molecule, accounting for the increase in the apparent viscosity of the solution. In addition, the decrease in fibre particle size (Table 1) leads to the further interaction of particles and enhances the formation of network structure with water molecules, thus increasing the apparent viscosity (Sébastienn et al., 2010).
Functional properties
The scavenging effect of DF on nitrite can prevent cancer to a large extent (Jeong et al., 2013). As shown in Table 1, in 100 min, the NSC of SDF, MSDF, IDF and MIDF were 46.34%, 50.90%, 43.51% and 32.61%, respectively. As a result, the MSDF had the best scavenging capacity to nitrite, which can be attributed to the finer fibre particles, larger specific surface areas and a more packed matrix that together increase intermolecular attractions (Yang et al., 2019).
Juhel et al. (2011), discovered that DF is related to the decreasing absorption of cholesterol and is able to prevent hypercholesterolaemia to some degree. As shown in Table 1, four kinds of DF showed a strong ability for cholesterol absorption. The CAA of MSDF reached 13.45 mg g−1, which was significantly higher than that of SDF at 7.24 mg g−1 (P < 0.5). At the same time, the CAA of MIDF was 3.79 mg g−1, which was higher than the CAA of IDF at 1.56 mg g−1.
Conclusion
The research is a comprehensive evaluation of the DFs from yam peel, including the structure analysis and physicochemical properties, which is meaningful in the field of yam processing. Experiments on the functional properties of DFs showed that MSDF and MIDF obtained a better WHC, OAC, SC and absorption abilities with altered structures, which is of great importance in food processing and development. The results provided the necessary basis for the promotion of comprehensive exploitation and utilisation of yam peel and are vital for improving the application of raw materials and the added value of yam industries.
Acknowledgments
This work was supported by the National Natural Science Foundation of China (31201285, 31872901), the China Postdoctoral Science Foundation (2017M611752), the Liaoning Revitalization Talents Program (XLYC1807270), the Science and Technology Support Program from Shenyang City (17136800) and the College Student Innovation and Entrepreneurship Development Program of Liaoning University (x201810140247).
Conflict of interest
The authors declare that they have no conflicts of interest.
Data availability statement
Research data are not shared.
Ethical guidelines
Ethics approval was not required for this research.
