


Abstract
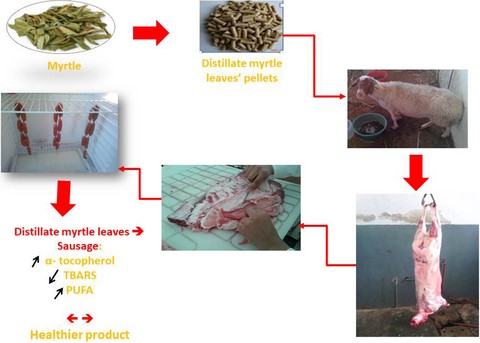
The effects of distilled myrtle leaves (DML) intake on physiochemical traits, fatty acid profile and lipid oxidation of ewe’s sausage (Merguez) were investigated. Twenty-seven ewes were divided into three homogenous groups. Ewes were fed hay and concentrate for control group (C). They received concentrate and M-Hay pellets, containing 87% DML, as substitute to hay in MH group; for MC group, ewes received hay, concentrate and M-Conc pellets having 30% DML in partial substitution to concentrate. They were slaughtered at the end of trial (90 days) with an average body weight of 42 kg. DML did not affect the physicochemical and sensory properties (P > 0.05) of Merguez; whereas, it increased lipid oxidative stability (P < 0.05). MH group showed the highest values of α-tocopherol content, C18:2-n6 fatty acid and polyunsaturated fatty acids. DML could be used in animal feeding to obtain higher meat product quality with better fatty acids content and antioxidant potential.
Introduction
Globally, the traditional foods with important history and some authenticity have been increasingly sought and their consumption intensified. Hence, processed meat products are diversified, even product specific to some region, like kebab and Merguez became well known throughout the world (Mir et al., 2017). Merguez is a sausage widespread in all Mediterranean countries and other parts of the world. It is habitually prepared from beef lean and fat except in religious ceremony where mutton was used. Aged ewes offer great quantities of meat that is not appreciated in the rough and less preferred by the consumers (Bhatt et al., 2013). However, the grinding of meat disrupts the integrity of muscle membranes permitting processed meat to be tenderer. Nowadays, meat products minimally processed with suitable nutritional values are in growing demand. Meat fatty acid (FA) profile has various effects on human health, consumers tend to buy products rich in polyunsaturated FA (PUFA), and have low levels of saturated FA (SFA) that are associated with increased LDL cholesterol (Mensink et al., 2003). Many studies showed that animal diets influence the productive aspects (Bhatt et al., 2013; Atti et al., 2013), FA profile (Atti et al., 2005; Hajji et al., 2016) and lipid oxidation (Moñino et al., 2008). The lipid oxidation is considered as one of the major deteriorating process of meat quality affecting the meat traits during transformation, storage and distribution as well as reducing the shelf life, thereby, leading to off-flavour. To reduce lipid oxidation, the use of synthetic antioxidant was widely used as an ingredient in animal diet or as additive by meat industries. Nevertheless, there has been a growing concern regarding their potentially toxicological and carcinogenic effects in foods (Chen et al., 1992). Hence, the demand for natural antioxidants is increasing by consumers considering them safe and healthy. Some plants, rich in phenolic compounds could be a natural source of antioxidants because they possess secondary compounds (Smeti et al., 2018). The antioxidant power of plant extracts or essential oils has been reported in various meats such as pork (Ranucci et al., 2015) and lamb (Moñino et al, 2008; Smeti et al., 2014; Smeti et al., 2018). Simultaneously to the production of essential oils, the industry distillation of aromatic plants generates substantial quantities of phenolic-rich by-products, which could be valuable natural sources of antioxidants. Some of these by-products, such as rosemary and thyme distilled leaves, have been the subject of many investigations, and their richness in phenolic antioxidants was shown (Nieto, 2013; Ben Abdelmalek et al., 2018; Yagoubi et al., 2018). In addition, these by-products have beneficial effects on the sensory quality of meat products (Akarpat et al., 2008; Essid et al., 2018). The myrtle (Myrtus communis L.), an aromatic plant shrub distributed throughout the Mediterranean area and widely used in folk human medicinal practices as an antimicrobial and antioxidant (Aidi-Wannes et al., 2010), was rarely used as a natural antioxidant in meat and meat products (Akarpat et al., 2008; Manzoor et al., 2014). Therefore, the aim of this study was to investigate the effects of distillate myrtle leave (DML) in the diet of culled ewes, on biochemical, physical traits and oxidative stability of Merguez made from meat of these ewes.
Material and methods
All procedures employed in this study (transport and slaughtering) met the ethical guidelines and adhered to Tunisian legal requirements (The Livestock Law No. 2005–95 of 18 October 2005, Chapter II; Section 1 and Section 2 relative to the slaughter of animals).
Reagents
Tannic acid (98% purity) was used as the reference standard (Sigma, Sant Louis, MI, USA). For preparing the Carrez (I and II) reagents, l-Ascorbic acid (99% purity) and 2.6-di-tert-butyl-4-methylphenol (BHT) (purity ≥ 99%) (Sigma) were used. For sample extraction, Hexane (>99% purity), ethanol (96.2% purity), ethyl acetate (99.8% purity), triple distilled water and hydrochloric acid, obtained from PanreacApplichem (Castellar del Vallès, Barcelona, Spain), were used. For the quantification, the Folin–Ciocalteu reagent (Sigma) and anhydrous sodium carbonate (7%) (99.5% purity, Kem, Mexico) were used. Chromatography solvents used were analysis methanol (99.9% purity), acetonitrile (99.9% purity) and dichloromethane (99.8% purity), all purchased from Chem-Lab (Zedelgem, Belgium).
Experimental feed
The DML are generated after myrtle’ essential oils extraction by hydro-distillation. They were collected from a distillation unit in the Northwest of Tunisia (Nefza). In the experimental site, they were air-dried in the shade for one week to ensure complete dehydration. Dried DML were then ground and mixed in the manufactory with bran, soya and barley in order to fabricate two types of pellets with two DML levels. The first (M-Hay) type was composed of 87% DML and 13% bran to have a roughage with similar crude protein as alfalfa hay, which is often imported. The second (M-Conc) contains 30% DML, 12% soya and 58% barley; which is equivalent to a concentrate.
Experimental design and Merguez preparation
Twenty-seven culled ewes (5–6 years old, 35 kg of body weight, BW) were divided into three groups of nine animals, individually fed with a diet consisting of 1.250 kg feed animal−1 day−1, for 90 days. The control (C) group was fed 500 g of hay and 750 g of concentrate, the MH group was fed 750 g of concentrate and 500 g of M-Hay pellets as substitute to hay. For the third group (MC), the concentrate was partially substituted by M-Conc; ewes received 500 g of oat hay, 350 g of concentrate and 400 g of M-Conc pellets. At the end of fattening period (90 days), ewes were slaughtered at 42 kg BW. After carcasses’ chilling at 4 °C for 24 h in a cooling room, the breast, loin and rib were separated and deboned. Thereafter, muscle and fat tissues were stored at −18 °C for later Merguez production. To formulate fresh Merguez, muscle and fat were defrosted in the refrigerator at 4 °C for 24 h. Then, they were mixed and minced using a Moulinex mincer (Moulinex Inc., Paris, France), then 1% salt and 3% paprika were added to the mixture. For each dietary treatment, the minced lean of three ewes were pooled and mixed to make one batch. Hence, three batches were prepared per dietary treatment (control (C), MH and MC). Merguez mixture was stuffed into natural ovine salted casings using a Sirman sausage stuffer (Sirman Inc., Padova, Italy), which were soaked in water prior to use. Thirty samples of Merguez were formulated per batch. Merguez was tied manually 10–12 cm long and stored in the refrigerator at 4 °C for 6 days. Colour parameters, pH and oxidation (TBARS) were measured on days 0, 2, 4 and 6. Chemical composition, sensory evaluation and fatty acid profile were evaluated at day 0 of storage. All measurements were performed in triplicate for each type of Merguez.
Determination of total phenolic content and antioxidant activity in feedstuff
Total phenolic content (TPC)
The extraction and estimation of TPC were achieved following the procedures of Julkunen-Tiito (1985) with some modifications. About 0.2 g of fine ground sample was placed in a test tube. Five millilitres of Reagent 1 (Acetone: Water (1:1) + 5% Formic Acid) were added, and the tubes were stirred in vortex for 10 min. Then, the tubes were put in a sonicator (Selecta Ultrason H-D), at 30 °C and 40 kHz, for 20 min followed by centrifugation at 2264 g for 20 min at 4ºC and the supernatant was recovered. The test samples (20 μL for hay and 60 μL for other samples) were filled with water up to 1 mL mark, and then 0.5 mL of Folin Ciocalteu was added. For each tube, 2.5 mL of 7% Na2CO3 was added and mixed, then it was incubated in the dark at room temperature for 35 min, followed by centrifugation at 1006 g for 20 min at 10 °C. The absorbance at 725 nm was recorded with a Helios Beta spectrophotometer (Thermo Electron Corporation, Madrid, Spain) and the results were expressed as mg tannic acid equivalents (TAE) g−1 dried sample.
ABTS assay and DPPH radical scavenging activity
The extraction process was based on the protocol of Saura-Calixto & Goñi (2006) for ABTS (2,2′-azino-bis(3-ethylbenzothiazoline-6-sulphonic acid) assay and DPPH (2,2-diphenyl-1-picryl-hydrazyl-hydrate) radical scavenging activity. The ABTS radical cations (ABTS+) were prepared by reacting a 7.4 mm ABTS stock solution with 2.45 mm potassium presulphate (1:1, v/v). The stock solution was kept in the dark at room temperature for 12–16 h. The radicals were stable in this for 2 days when stored under these conditions, and then the stock solution was diluted with ethanol to obtain absorbance of 0.7 ± 0.02 at 734 nm. For spectrophotometric assay, 20 μL aliquot of the sample was added to 280 μL of ABTS solution and placed in the dark for 30 min. Methanolic solutions of known trolox concentrations were used for calibration. Absorbance was recorded at 730 nm, and results were expressed as mg trolox equivalents (TE) g−1 dried sample. Free radical scavenging activity of extracts was measured with a DPPH radical assay according to Cheung et al. (2003), with modifications. An aliquot of 250 μL of DPPH radical solution was added to 50 μL of sample extract. The reaction mixture was incubated in the dark at room temperature for 1 h, and absorbance was measured at 520 nm. A standard curve was prepared using Trolox solution (MW = 250.29 g mol−1) with increasing concentrations (from 0.01 to 0.1 mg mL−1), DPPH radical scavenging activity was expressed as mg trolox equivalents (TE) g−1 dried sample.
Colour parameters and pH of Merguez
The pH of sausages was determined with a portable pH-metre (HI 99163, HANNA, Romania) by inserting pH probe at the centre of the sausage. To evaluate colour, a Minolta spectrophotometer (CM-2006 d; Konica Minolta Holdings, Inc., Osaka, Japan) was used directly on the sausage’s surface. Results were expressed according to CIE system where L* traduced the lightness, a* the redness and b* yellowness b*. For each sample, the retained value is the mean of three measurements of pH and colour’ parameters.
Chemical composition and antioxidant activity of Merguez
For chemical composition, samples of Merguez were lyophilised, and dry matter (DM) content was obtained. Then, samples were grounded (1 mm screen). On homogenised ground samples, ash was determined by combustion at 600 °C for 8 h, the Nitrogen was determined by Kejeldahl method and then the crude protein content was calculated as N*6.25 (AOAC, 1999); the fat was extracted with petroleum ether, measured using AOCS Standard Procedure Am 5-04. The TPC of Merguez was performed, in triplicate, according to Vázquez et al. (2015). Briefly, 1 g of sausage was mixed with milli-Q water, aqueous solution of methanol (50/50; v/v) and Carrez I and II solution acetonitrile, after vortexing and centrifugation, the supernatant was filtered, and the extract obtained was used to determine TPC according to Folin–Ciocalteu method as previously reported. The ABTS assay was determined following the method of Saura-Calixto & Goñi (2006) with some modifications as described previously. The vitamin E analysis was performed following the method of Prates et al. (2006), which involves the saponification of lyophilised Merguez to which ascorbic acid was added. The tubes were vortexed, then 5 mL of hexane-ethyl acetate (9:1 v/v) and 5 μg mL−1 of BHT (purity 99.9% GC, Sigma-Aldrich) were added and the mixture was shaken first with a vortex for 5 s; thereafter, an orbital shaker was used and centrifuged at 1370 g at 10 °C. The supernatant was evaporated with a rotary evaporator under vacuum (Christ RVC2-25) for 45 min at 40 °C, then resuspended in 1 mL of mobile phase (ACN: CH3OH: CH2Cl2 75:15:10 v/v/v). Afterwards, it was shaken with vortex (5 s) and with orbital shaker for 10 min at maximum speed and the aliquot of n-hexane layer was filtered through a PTFE of 0.22 μm (13 mm × 0.20 μm) (Sigma-Aldrich) in vial of 2 mL. An Acquity UPLC H-Class liquid chromatograph (Waters, Milford, MA, USA) equipped with detector of absorbance (PDA eλ Detector) and fluorescence (Waters 2475 Multi λ Fluorescence Detector) was used. It was equipped with a column Acquity UPLC HSS T3 column 2.1 mm × 15 mm × 1.8 μm (Waters). The mobile phase was acetonitrile: methanol: dichlorometane (75:15:10, v:v:v) with a flow rate of 0.3 mL min−1. The temperature of the samples and the column was adjusted to 25 and 35 °C, respectively. The injection volume was 5 μL, and the total run time of the chromatographic procedure was 15 min. Tocopherols were detected by fluorescence emission at 295 nm excitation wavelength (λexc) and 330 nm emission wavelength (λemi). For the determination of cholesterol, the extraction method was the same as that of vitamin E mentioned previously; however, it was detected at 220 nm. The analytes in all samples were identified by comparison of the retention times and spectral analysis with those of the pure standards.
Fatty acid profile of Merguez
Merguez’s FA profile was determined using the method of Lee et al. (2012) with modifications and was quantified as Fatty acids methyl ester (FAMEs). FAMEs were separated and determined using gas chromatography (GC-FID Bruker gas chromatograph) equipped with a capillary column (BR-2560), 200 m long with an interior diameter of 0.25 mm and 0.2 µm film thickness. The detector temperature was fixed at 260 °C and injector temperature was maintained at 250 °C. The temperature of the oven was 175 °C, held for 90 min, then increased with a rate of 5 °C min−1 to reach 210 °C and maintained for 83 min, for a total time of 180 min. The injection volume was 1.0 μL, and the split ratio was 1:25. Fatty acids methyl esters were identified and quantified using several reference methyl esters and the internal standard (C23:0 methyl tricosanoate). Saturated (SFA), monounsaturated (MUFA), polyunsaturated (PUFA) FA and desirable fatty acids (DFA) were calculated.
Lipid oxidation analyses (TBARS) in muscle
Merguez’s lipid oxidation was determined by measuring thiobarbituric acid reacted substances (TBARS) according to the method of Botsoglou et al. (1994) with modifications. Briefly, 10 g of minced sausage were homogenised with 20 mL of 10% trichloro acetic acid using an Ultra-Turrax (T25; IKA-Labortechnik, Staufen, Germany) for 10 s at 20 376 g. After centrifugation for 30 min, the supernatant was decanted through a paper filter and mixed with thiobarbituric acid solution. The mixtures were incubated at 97 °C in a water bath for 15 min to develop a pink chromogen. After cooling, the absorbance of sample was read against the appropriate blank at 532 nm by a spectrophotometer (Thermo Electron Corporation). A standard curve was prepared using 1,1,3,3-tetramethoxypropane (99%) with increasing concentrations (from 0 to 120 µL), 5 mL of thiobarbituric acid and 5 mL of water. The final conversion of 1,1,3,3,tetramethoxypropane to MDA was calculated by multiplying the number of μm of 1,1,3,3, tetramethoxypropane equivalent per gram of sample by the molecular weight of MDA. The amount of TBARS was calculated from this curve and expressed as mg malondialdehyde (MDA) equivalents kg−1.
Sensory evaluation
The sensory quality of Merguez samples, from each batch, was evaluated by fifteen-member trained panellists from the laboratory staff. Descriptive analysis was carried out to evaluate the intensities of sensory characteristics. Prior to the sensory session, samples were thawed at 4 °C, wrapped in aluminium foil and baked in an electric oven at 180 °C for about 40 min, until a core temperature of 71 °C was reached (AMSA, 1995). Merguez were cut into pieces (3–5 cm), coded and served to each panellist randomly. Panellists were asked to evaluate them for colour, odour, flavour, texture, juiciness, firmness and overall acceptability using a nine-point hedonic scale (1, dislike extremely to 9, like extremely). For each session, panellists tested samples from all dietary treatments presented in a random order. Bread and water were provided for the trained panellists between samples to freshen the mouth.
Statistical analysis
Statistical analyses were performed with SAS (2004). One way Anova, using GLM procedure, was used to test the effect of dietary treatment on Merguez’s FA profile, sensory analysis and chemical composition measured once on three samples per treatment. For pH, colour and TBARS measurements during storage, the mixed procedure was used, with diet, storage time and the interaction between them as the variable factors.
Results and discussion
For all parameters, there was no significant interaction between diet and storage time, so there was none in the tables and text.
TPC and antioxidant activity of feedstuff
Table 1 reported the results of the antioxidant potential of feedstuffs. The DML had higher total phenolic content (153 mg TAE g−1) and antioxidant capacity than hay and concentrate, which had 6 and 3 mg TAE g−1 of TPC, respectively. Therefore, both type of pellets containing DML had also higher TPC, antioxidant activity radical scavenging activity (DPPH) and ability (ABTS) than the conventional feeds. However, M-Hay pellets with 87% of DML had higher values than M-Conc pellets containing only 30% of DML. The antioxidant DPPH activity of M-Hay was about twice the activity of M-Conc (242.2 vs. 127.2 mg TE g−1), whereas, the concentrate had the lowest (P < 0.05) antioxidant capacity (17.8 mg TE g−1). The TPC of feedstuff was strongly correlated with DPPH and ABTS activity (r2 = 0.99 and 0.92, respectively; Table 1). These results are in agreement with the previous research on the antioxidant activity and high TPC of aromatic plant’ extracts and residues (Ben Abdelmalek et al., 2018), that suggested a relationship between antioxidant activity and phenolic compound content. Huang et al. (2011) showed that edible lotus leaf used on bovine and porcine meat, gave the greatest antioxidant activity (DPPH and ABTS assays) due to their high phenolic content (34.9 mg GAE g−1). Similarly, Aidi-Wannes et al. (2010) confirmed that Tunisian myrtle extracts have a potent antioxidant activity mainly due to their richness in phenolic compounds. However, the TPC recorded in the present study (153 mg TAE g−1) for DML was higher than values reported by Aidi-Wannes et al. (2010) for TPC of different parts of myrtle (33.67 and 11.11 mg TAE g−1) in leaf extract and stem, respectively.
Antioxidant potential and chemical composition of feedstuffs
| Hay | Conc | DML | M-Hay | M-Conc | P-value | SEM | R2 (TPC × DPPH) | R2 (TPC × ABTS) | |
|---|---|---|---|---|---|---|---|---|---|
| TPC (mg TAE g−1) | 6.88d | 3.07e | 153.43a | 72.41b | 25.17c | <0.01 | 28.15 | ||
| DPPH radical scavenging activity (mg TE g−1) | 17.8d | 17.7d | 670.47a | 242.24b | 127.16c | <0.01 | 121.1 | 0.99 | – |
| ABTS radical scavenging ability (mg TE g−1) | 16.2d | 4.04e | 406a | 305.53b | 194.27c | <0.01 | 78.95 | – | 0.92 |
| Dry matter (%) | 90.1 | 92.6 | – | 93 | 92.1 | 0.005 | 0.57 | – | – |
| Crude protein (% DM) | 5.1 | 12.9 | – | 10.6 | 14.9 | <0.01 | 1.89 | – | – |
| Fat (%DM) | 1.2 | 0.94 | – | 3.13 | 2.89 | <0.01 | 0.56 | – | – |
| Energy value (UFL) | 0.68 | 1.1 | – | 0.95 | 1.01 | <0.01 | 0.08 | – | – |
a, b, c, d, e, different letters differ significantly (P < 0.05); Conc, concentrate; DML, distilled myrtle leaves; M-Con, pellets containing 30% of DML; M-Hay, pellets containing 87% of DML.
Merguez’s pH and colour parameters
The Colour parameters ‘results were reported in Table 2. The ewe’s diet did not affect (P > 0.05) the colour indices a* and b*, while L* values tended to be higher for MC than MH and control (Table 2). Our results are in agreement with those of Realini et al. (2004), who showed no antioxidant effect in feeding on meat colour’ parameters. Conversely to the present results, Nieto et al. (2010) recorded higher values for a* and lower b* in fresh lamb meat from suckling dams fed distillate rosemary leaves than control. Bañon et al. (2012) showed a decrease in a* against an increase in b* in fresh meat of lambs receiving rosemary extract to lambs. However, Ranucci et al. (2015) showed that cooked ham from pigs fed diets enriched with oregano extract or sweet chestnut wood extract, had higher values for a* and b* during storage. They explained the colour differences among groups by the action of polyphenols. Oxidation is the main factor affecting shelf life of meat products and colour stability (Nieto et al., 2010). Thus, polyphenols can act as a natural antioxidant by delaying lipid oxidation, resulting in meat colour preservation. The storage time affected all colour’s parameters (Table 2). The indices a* and b* significantly decreased at day 4 for all groups, while the L* decreased at day 4 only for the control group and at day 6 for both DML groups. Nevertheless, all samples remained in the acceptability range by consumers since L* values were higher than 40 even in the last day of storage (Smeti et al., 2018). However, Ben Abdelmalek et al. (2018) showed that rosemary residues intake extended the sausages’ colour stability during storage. The Merguez’ pH was not affected by the ewe’s dietary treatment (Table 2). In agreement with our results, Realini et al. (2004) recorded no dietary effects on the pH of beef meat. The time storage affected the pH for control and MH groups (P < 0.05), where it slightly increased only at day 6. However, the MC group conserved similar pH values during storage period. Similarly, Bañon et al. (2012) and Yagoubi et al. (2018) recorded some degree of consistency in pH values during storage time of lamb fed rosemary extract or rosemary distillated leaves. Conversely, Ben Abdelmalek et al. (2018) showed increases in pH values during storage of sausages from ewes fed rosemary.
Effect of ewe’s diet on colour parameters, pH and TBARS of Merguez
| Diets | Storage day | Statistics | ||||||
|---|---|---|---|---|---|---|---|---|
| Day0 | Day2 | Day4 | Day6 | Pdiet | Ptime | SEM | ||
| L* | C | 48.8 ± 0.84xa | 46.4 ± 0.72xa | 40.9 ± 1.2xb | 40.1 ± 0.07b | 0.07 | 0.001 | 0.93 |
| MH | 47.5 ± 0.65xa | 45.7 ± 1.3xa | 44.1 ± 1.3xyab | 42.6 ± 1.8b | ||||
| MC | 51.3 ± 1.1ya | 49.9 ± 1.4ya | 47.4 ± 1.7ya | 42.2 ± 0.94b | ||||
| a* | C | 21.4 ± 1.36a | 21.4 ± a | 18.4 ± b | 16.2 ± b | 0.84 | 0.001 | 1.27 |
| MH | 24.9 ± 0.3a | 20.6 ± 1.2b | 18.2 ± 0.54c | 16.4 ± 0.76cd | ||||
| MC | 21.6 ± 2.1a | 20.9 ± 1.3a | 18.6 ± 1.9b | 16.6 ± 2.6c | ||||
| b* | C | 26.5 ± 3.4a | 25.5 ± 3.3a | 21.6 ± 1.9b | 18.3 ± 2.1bc | 0.80 | 0.001 | 3.42 |
| MH | 25.4 ± 2.2a | 22.6 ± 2.9a | 16.9 ± 3.1b | 15.8 ± 0.88bc | ||||
| MC | 22.6 ± 6.7a | 21.0 ± 5.9a | 19.5 ± 4.8a | 17.4 ± 3.3a | ||||
| pH | C | 5.54 ± 0.03a | 5.67 ± 0.02a | 5.78 ± 0.01ab | 5.9 ± 0.04b | 0.76 | 0.05 | 0.044 |
| MH | 5.57 ± 0.01a | 5.78 ± 0.009b | 5.81 ± 0.03ab | 5.91 ± 0.16b | ||||
| MC | 5.62 ± 0.07a | 5.76 ± 0.02a | 5.8 ± 0.12a | 5.76 ± 0.05a | ||||
| TBARS (mg MDA kg−1) | C | 0.41 ± 0.11xa | 0.51 ± 0.0xab | 0.52 ± 0.0xab | 0.6 ± 0.06xb | 0.05 | 0.048 | 0.037 |
| MH | 0.24 ± 0.04y | 0.25 ± 0.03y | 0.26 ± 0.05y | 0.30 ± 0.04y | ||||
| MC | 0.29 ± 0.016y | 0.32 ± 0.019y | 0.34 ± 0.014y | 0.38 ± 0.012y | ||||
C, control group; MC, group fed oat hay concentrate and pellets containing 30% of DML; MH, group fed pellets containing 87% of DML and concentrate.
a, b, c: different letters within the same row (different storage days) differ significantly (P < 0.05), w, x, y, z: different letters within same columns (different diets).
Merguez’s chemical composition, α-tocopherol content and antioxidant activity
Chemical composition of Merguez was not affected by the ewes’ dietary treatment. Despite the differences in feedstuff content of protein and fat (Table 1), the content of these components and that of cholesterol were similar in all groups (Table 3). This result may be explained by the similarity in Merguez’s formulation and processing (Ben Abdelmalek et al., 2018). The α-tocopherol content was twice as high (P < 0.05) for MC and MH Merguez than the control (Table 3). This high α-tocopherol concentration in Merguez from ewes consuming DML may be the consequence of the high TPC content in M-Hay and M-Conc pellets compared to hay and concentrate (Table 1). The correlation between α-tocopherol in animal tissues and TPC content in feeds was shown (Frank et al., 2006). In addition, Several authors have reported the effect of diet rich in TPC on muscle’s α-tocopherol content, such as rosemary distillation residues (Yagoubi et al., 2018) or pasture and fresh forage (Lobón et al., 2017). However, the α-tocopherol content of Merguez from both groups fed DML (6.65–7.42 µg g−1) in the current study was higher than values obtained under grazing conditions for cattle (Yang et al., 2002; 0.16–0.22 µg g−1) and lambs (Hopkins et al., 2013; 3–4 μg g−1). Moñino et al. (2008) showed a positive transfer of polyphenols to lamb meat when ewe-mothers were fed with the rosemary by-product. Several authors mentioned that polyphenols are natural antioxidants that have the ability to protect muscle tissues from oxidative damage (Frank et al., 2006; Nieto et al., 2010). The ABTS radical cation assay was used to quantify the total antioxidative activity since it is applicable to both water-soluble and lipid-soluble antioxidants. In the current study, there was no significant difference in ABTS scavenging ability of Merguez, which suggests that all groups have the potential to donate electrons for neutralising free radicals. However, it was shown that meat of animals fed rosemary had higher reducing antioxidant power (FRAP) and greater ability to reduce ABTS+ (Moñino et al., 2008).
Effect of ewe’s diet on Merguez’s chemical composition and antioxidant activity
| Diets | Statistics | ||||
|---|---|---|---|---|---|
| C | MH | MC | P-value | SEM | |
| Dry matter (%) | 39.7 ± 4.1 | 41.7 ± 0.72 | 43.5 ± 1.4 | 0.61 | 1.09 |
| Crude protein (% DM) | 45.2 ± 0.6 | 43.4 ± 0.36 | 47.7 ± 0.47 | 0.25 | 0.73 |
| Fat (%DM) | 28.3 ± 0.09 | 28.2 ± 0.25 | 30.1 ± 0.13 | 0.84 | 0.6 |
| Cholesterol (mg g−1) | 1.11 ± 0.07 | 1.15 ± 0.14 | 1.15 ± 0.72 | 0.96 | 0.01 |
| α-tocopherol (μg g−1 DM) | 3.11 ± 0.7b | 6.65 ± 0.9a | 7.42 ± 1a | 0.03 | 1.3 |
| ABTS radical scavenging ability (mg TE g−1) | 1.43 ± 0.1 | 1.47 ± 0.19 | 1.39 ± 0.14 | 0.54 | 0.02 |
| TPC (mg TAE g1) | 251.5 ± 32 | 282.6 ± 51 | 269.7 ± 58 | 0.22 | 9 |
C, control group; MC, group fed oat hay concentrate and pellets containing 30% of DML; MH, group fed pellets containing 87% of DML and concentrate.
a and b are different letters within the same columns differ significantly between ewe's diet (P <0.05).
Lipid oxidation
The dietary treatment significantly affected (P < 0.05) the lipid oxidation (Table 2). At day 0, C group had significantly higher Merguez’s TBARS values than both groups receiving the DML (MH and MC). This result showed that DML intake protected ewes’ meat against oxidation. The storage time had, also, a significant effect on Merguez’s TBARS values (P < 0.05). Control group had higher TBARS values throughout the storage period; it ranged between 0.41 at day 0 and 0.6 mg MDA kg−1 at day 6. However, TBARS’ values of Merguez from MH and MC groups varied between 0.24 and 0.38 mg MDA kg−1 for the starting and the end of storage, respectively. It could be established that the incorporation of DML in ewe’s diet, with two different levels, enhanced the oxidative stability of its meat products. The antioxidant activities are closely related to the total phenolic contents (Yagoubi et al., 2018) which explain the highest TPC and lowest TBARS of MH Merguez. It was shown that the incorporation of polyphenol rich plant extract in ewe’s diet inhibit the oxidative capacity of meat and muscle model systems (Hayes et al., 2009; Yagoubi et al., 2018). Nieto (2013) reported that dietary supply is a convenient alternative to introducing natural antioxidant into phospholipid membranes, where it can inhibit oxidative reaction. In this context, Kerry et al. (1998) confirmed that antioxidants incorporated within cell membranes are more efficient than those added post mortem to preserve meat from oxidative damage. Furthermore, Moñino et al. (2008) demonstrated that phenolic compounds can be transferred from feed to muscle by identifying phenolic compounds in muscle from lambs receiving milk from sheep fed rosemary distillate leaves. In the same vein, Lobón et al. (2017) observed a lower lipid oxidation in lambs suckling grazing dams than when dams received hay. Improved oxidative status was recently recorded of lamb meat during storage with rosemary-based diets (Smeti et al., 2018; Ben Abdelmalek et al., 2018). During the storage period and up to the 6th day, the overall TBARS values significantly (P < 0.05) increased for C group; this increase in TBARS values revealed the lipid oxidation and production of volatile metabolites in the presence of oxygen during aerobic storage. The final TBARS values remained below the threshold of rancidity perception (0.6-2.0 mg MDA kg−1) for all groups. The presence of paprika in all types of Merguez could explain this low level of TBARS given the antioxidant power of this spice (Aguirrezábal et al., 2000).
Fatty acid profile of Merguez
The most abundant FAs (80% of the total) were C16:0, C18:0 and C18:1-9c (Table 4). This result is in concordance with the literature (Atti & Mahouachi, 2011; Nieto, 2013). The SFA and MUFA contents were higher in samples of Merguez produced from MC group compared to C and MH with no significant difference, while the sum of PUFAs tended (P = 0.13) to be higher for MH group with 38.1 vs. 33.7 and 32.4 for MC and C, respectively (Table 5). For individual SFA, results revealed that most of them were not affected by the dietary treatment. So the incorporation of DML in ewes diet did not affected them. However, the MC group, with 30% of DML in ewes diet, had higher branched chain fatty acids (BCFA) content (P < 0.05). In fact, BCFA are responsible for the distinctive sheep flavours and odours in meat and meat products, which are considered important factors for consumers (Prescott et al., 2001). Hence, Wong et al. (1975) reported that the undesirable flavour of cooked meat could be related to the presence of medium chain fatty acids, particularly, 4-methyloctanoic and 4- methylnonanoic acids. However, in the current study, these compounds were not detected. Except the margaroleic acid (C17:1), where the highest concentration was recorded for Merguez of MH (P < 0.01), the individual MUFAs were not affected by diet. The oleic acid (C18:1 cis-9) concentration was higher for both groups of DML-fed ewes than the control-fed, but the difference was not significant (P = 0.15). The main PUFA, C18:2n-6, was higher (P < 0.05) for MH Merguez than the control; so the total substitution of hay by pellets containing 87% of DML increased PUFA content in Merguez compared to those receiving hay or pelleted containing only 30% of DML. However, the highest concentration of rumenic acid (C18:2-cis9, trans-11) and the lowest content of C18:2- trans 9, cis-11 was recorded for Merguez from C group (P = 0.03) as compared to that from both groups of ewes fed DML. The concentrations of CLA isomers were similar among groups. CLA isomers, rumenic acid (C18:2 c9, t11), is a product of the endogenous synthesis catalysed by ∆9-desaturase, while trans-11, C18:1, is synthesised during ruminal bio-hydrogenation of linoleic (C18:2 n-6) and linolenic (C18:3 n-3) acids and by the action of ruminal bacteria (Bauman et al., 1999). The C18:3-n3 content tended to be higher for MH and MC than the C group (Cst1, P = 0.09), with respective content of 3.53, 3.25 and 2.96. The PUFA 3-n3 had the same tendency. The PUFA/SFA (P/S) ratio was significantly higher for MH than other groups; this result is the consequence of the higher linoleic and linolenic FA of this group. Therefore, the substitution of hay by pellets containing 87% of DML resulted in higher and healthier index. However, the recommended P/S ratio in diets is 0.4 (Department of Health, 1994), which is higher than the values found in the current study. The n-6/n-3 PUFA ratio was similar among groups averaging 6, which is higher than the suggested value (4) for human foods (Department of Health, 1994) but it could be acceptable given that the ewe’s ration was based on concentrate and dry forage. Several studies have shown the influence of the feeding systems on the n-6/n-3 ratio. The administration of rosemary essential oil or rosemary residues into lamb diet has significantly decreased the n-6/n-3 ratio in lamb’s meat (Smeti et al., 2018; Yagoubi et al., 2018).
Effect of ewe’s diet on Merguez’s fatty acid profile (mg FAMEs g−1 freeze-dried sample)
| Diets | Statistics | ||||
|---|---|---|---|---|---|
| C | MH | MC | P-value | SEM | |
| ∑C<14 :0 | 2.48 ± 0.24 | 2.51 ± 0.12 | 3.29 ± 0.7 | 0.14 | 0.26 |
| C14 :0 | 15.77 ± 0.6 | 16.46 ± 1 | 19.57 ± 1.2 | 0.17 | 1.16 |
| C15 :0 | 4.56 ± 0.36 | 4.57 ± 0.18 | 5.45 ± 0.7 | 0.13 | 0.29 |
| C16 :0 | 147.1 ± 0.42 | 151.4 ± 0.23 | 179.9 ± 078 | 0.73 | 10.29 |
| C17 :0 | 15.51 ± 0.54 | 15.11 ± 1.4 | 19.29 ± 2.5 | 0.29 | 1.33 |
| C18 :0 | 131.0 ± 4 | 120.9 ± 14 | 152.0 ± 6.9 | 0.65 | 9.15 |
| C16 :1-9c | 7.62 ± 0.46 | 7.42 ± 0.4 | 8.96 ± 0.56 | 0.28 | 0.48 |
| C17:1 | 2.48 ± 0.24 | 16.46 ± 0.12 | 3.29 ± 0.7 | 0.01 | 4.53 |
| C18:1-9c | 211.7 ± 3 | 215.2 ± 21.7 | 242.0 ± 17.3 | 0.15 | 9.57 |
| VA_C18:1-cis11 | 6.56 ± 0.16 | 7.70 ± 0.6 | 8.05 ± 0.85 | 0.32 | 0.44 |
| Trans-C18:1 | 17 ± 0.44 | 20.70 ± 3 | 20.74 ± 3.8 | 0.67 | 1.24 |
| C18:2n-6 | 18.08 ± 1.54 | 23.64 ± 1.53 | 19.14 ± 0.66 | 0.05 | 1.7 |
| C18:2- 9c.11t | 2.09 ± 0.044 | 1.67 ± 0.067 | 1.86 ± 0.11 | 0.03 | 0.12 |
| C18:2-9t.11c | 0.15 ± 0.025 | 0.32 ± 0.054 | 0.18 ± 0.016 | 0.03 | 0.05 |
| C18:3-n3 | 2.96 ± 0.12 | 3.53 ± 0.25 | 3.25 ± 0.1 | 0.61 | 0.16 |
C, control group; FA, fatty acid; MC, group fed oat hay concentrate and pellets containing 30% of DML; MH, group fed pellets containing 87% of DML and concentrate.
Effect of ewe’s diet on sums of fatty acids and nutritional indices value of Merguez (mg FAMEs g−1 freeze-dried sample)
| Diets | Statistics | ||||
|---|---|---|---|---|---|
| C | MH | MC | P-value | SEM | |
| ∑SFA | 350.4 ± 11 | 340.8 ± 25 | 421.3 ± 28 | 0.26 | 25.4 |
| cis_MUFA | 241.1 ± 2.28 | 247.6 ± 22 | 277.3 ± 19 | 0.19 | 11.14 |
| trans_MUFA | 19.64 ± 0.44 | 23 ± 3 | 23.73 ± 3.8 | 0.63 | 1.25 |
| ∑MUFA | 260.8 ± 2.7 | 270.6 ± 22 | 301.0 ± 19 | 0.28 | 12.1 |
| ∑CLA | 2.80 ± 0.06 | 2.86 ± 0.2 | 2.72 ± 0.1 | 0.67 | 0.04 |
| BCFA | 16.99 ± 0.9 | 14.68 ± 0.18 | 19.06 ± 1.46 | 0.04 | 1.26 |
| ∑PUFA | 32.4 ± 1.3 | 38.1 ± 2.17 | 33.7 ± 0.52 | 0.13 | 1.72 |
| ∑PUFA n-6 | 19.83 ± 1.6 | 25.38 ± 1.7 | 21.01 ± 0.67 | 0.07 | 1.68 |
| ∑PUFA n-3 | 3.40 ± 0.14 | 3.93 ± 0.32 | 3.62 ± 0.1 | 0.84 | 0.15 |
| PUFA/SFA | 0.09 ± 0.008 | 0.11 ± 0.004 | 0.08 ± 0.005 | 0.03 | 0.008 |
| n-6/n-3 | 5.83 ± 0.26 | 6.48 ± 0.095 | 5.80 ± 0.33 | 0.28 | 0.22 |
BCFA, branched chain fatty acids; C, control group; MC, group fed oat hay concentrate and pellets containing 30% of DML; MH, group fed pellets containing 87% of DML and concentrate; MUFA, monounsaturated fatty acid; PUFA, polyunsaturated fatty acid; SFA, saturated fatty acid.
Sensory evaluation
Table 6 shows the results of the sensory attributes of Merguez. There was no significant difference among groups for most of the sensory attributes analysed. The odour, colour, texture and firmness of Merguez were not affected by the ewe’s diet. However, the flavour, juiciness and overall acceptability were higher for C than MC group, while the MH group had intermediate values. In fact, the overall acceptance of Merguez tend to decrease for MC and MH group (P = 0.07). Most panellists detected a sheep flavour and odour (not mentioned in the Table). In fact, this typical sheep meat flavour is strongly related to the presence of methyl-branched-chain fatty acids (BCFA) contributing to the typical sheep meat flavour (Mottram, 1998). However, off flavours and off odours were not mentioned by panellist for all groups, this may be due to the initially low TBARS values in all groups. Undesirable flavours were detected in cooked meat with TBARS values above 2.3 mg MDA kg−1 (Campo et al., 2006) which is higher than the threshold of rancidity perception (0.6-2 mg MDA kg−1). The incorporation of MLD did not have a negative effect on sausage’s red colour; the score for all groups was above 5 in the scale by the panellist, which is considered acceptable by consumers. Similarly, Ben Abdelmalek et al. (2018) found that aroma, flavour and texture in sausages were not affected by rosemary and linseed ewe’s intake. However, Smeti et al. (2018) concluded that the rosemary essential oil intake, significantly improved the overall acceptability and flavour and tend to increase juiciness scores of lamb’ meat.
Effect of ewe’s diet on the sensorial parameters of Merguez
| Diets | Statistics | ||||
|---|---|---|---|---|---|
| C | MH | MC | P-values | SEM | |
| Colour | 5.34 ± 0.35 | 5.5 ± 0.24 | 5.75 ± 0.29 | 0.148 | 0.12 |
| Odour | 5 ± 0.35 | 5.09 ± 0.35 | 5.06 ± 0.33 | 0.999 | 0.02 |
| Flavour | 6.31 ± 0.23a | 5.54 ± 0.38ab | 5.17 ± 0.23b | 0.023 | 0.33 |
| Texture | 5.02 ± 0.3 | 5.04 ± 0.35 | 4.25 ± 0.37 | 0.146 | 0.26 |
| Firmness | 4.73 ± 0.35 | 4.55 ± 0.36 | 4.74 ± 0.36 | 0.915 | 0.06 |
| Juiciness | 4.94 ± 0.4a | 4.75 ± 0.29a | 3.75 ± 0.33b | 0.042 | 0.36 |
| Overall acceptance | 4.86 ± 0.4a | 3.83 ± 0.38ab | 3.64 ± 0.42b | 0.073 | 0.37 |
C, control group; MC, group fed oat hay concentrate and pellets containing 30% of DML; MH, group fed pellets containing 87% of DML and concentrate.
a and b are different letters within the same columns differ significantly between ewe's diet (P <0.05).
Conclusion
The results of the present study showed that, regardless the dose rates, combining DML in culled ewe’s diet did not affect the chemical composition, colour parameters, pH values and the sensory quality of Merguez elaborated from their meat. However, it resulted in higher α- tocopherol and lower TBARS values. The incorporation of DML in a rate of 87% resulted in higher PUFA content and PUFA/SFA ratio in Merguez. The BCFA content, contributing to the typical sheep meat flavour, was significantly higher in MC group. Thus, from a nutritional point of view, feeding animals a dose of 87% DML, improved the health quality of Merguez, since it resulted in a modification of the fatty acid profile by increasing the content of healthy FA (PUFA) and reducing lipid oxidation. The incorporation of DML could form a good strategy in animal feeding in order to reduce conventional feed resources and obtain higher quality and healthier meat products.
Acknowledgments
The authors are grateful to ZinaTaghouti, technician in Animal Production laboratory in INRAT and to the technicians of CITA for their technical assistance and the staff of the experimental farm Bou-Rebiaa for the feeding experiment servicing. We also thank Heno-Bio Company (Tunisia) for the distillate leaves residues offer. This work was financially supported by the Tunisian Ministry of High and Scientific Research/Animal Production laboratory.
Conflict of interest
We wish to confirm that the authors report no conflicts of interest associated with this publication.
Ethical approval
Ethics approval was not required for this research.
Data availability statement
Research data are not shared.
References
Author notes
The peer review history for this article is available at https://publons.com/publon/10.1111/ijfs.14549
