


Abstract
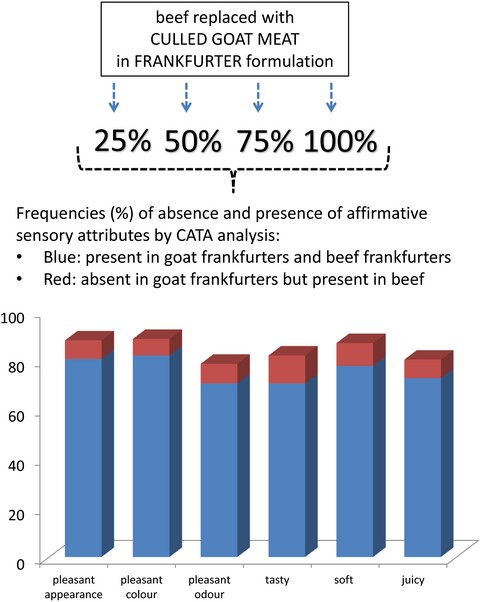
Four different levels (25–100%) of culled goat meat were used in frankfurter formulation (frankfurters G25, G50, G75 and G100) instead of beef (CON). Technological properties, fatty acid profile and sensory properties were examined during the 6-week cold storage. The formulation had significant impact of fatty acids profile – n-6/n-3 ratios progressively decrease from 14.63 in CON to 6.63 in G100. Higher goat meat content led to progressively higher lightness and lower redness in frankfurters. This was also observed by consumers but not negatively perceived. Check-all-that-apply (CATA) analysis shows that more than 80% of consumers marked pleasant colour as present in goat frankfurters and CON. The similar was observed for pleasant appearance, pleasant odour, tasty, soft and juicy. Moreover, atypical taste and odour were mostly not marked as present (73.8% and 62.5%, respectively). The panellists pointed at G50 as the most preferred, while consumers most frequently marked G75.
Introduction
Over the past decades, the number of goats and goat meat production on the whole noted a significant increase worldwide. Since the beginning of the century, the number of goats has increased by around 30% and goat meat production by almost 50% (FAOSTAT 2018).
The majority of goats in the world (60%) are found in Asia and are regarded as meat type. In Europe, the highest goat population is located in Southern Europe and is mainly composed of dairy goats producing milk primarily for cheese-making in France, Italy, Spain and Greece, countries contributing the most to the total number of slaughtered goats in Europe (Mahgoubl et al., 2012).
Serbia observed a significant increase in goat numbers in 2011–2012 (about 79%), and a slight decrease thereafter, with the population of slightly over 200 000 kept primarily for milk (cheese) production (FAOSTAT 2018).
As for nutritional and biological value, goat meat is not inferior to other meat types. Low saturated fatty acids and cholesterol content, higher content of riboflavin than in other meats and a significant content of lysine, threonine and tryptophan may be seen as incentives for consumers to buy goat meat (Bratcher et al., 2011; Ivanovic et al., 2016). However, the same data indicate that that goat meat, especially of older animals, tends to be less desirable than pork, beef or lamb (Rhee et al., 1999).
However, these unwanted sensory properties may not be appreciable in goat meat products due to the influence of processes involved and/or nonmeat ingredients (e.g. spices) used in processing. Several studies evaluated the production of meat products with goat meat and fat. Goat meat can be used to produce dry-fermented sausages and dry-cured meats (Madruga & Bressan, 2011; Stajić et al., 2013; Ivanovic et al., 2016). As for emulsified meat products, goat meat can replace beef because of its similar content of salt-soluble proteins, their higher emulsion capacity and similar emulsion stability (Chattoraj et al., 1979; Turgut, 1984; Madruga & Bressan, 2011).
The main negative impact of goat meat and fat usage on properties of meat products (indicated in the research) is associated with fatty tissue characteristics. As for fermented sausages, some research studies indicated a negative influence of goat fatty tissue on taste acceptability (Stajić et al., 2013). Goat fat decreases emulsion stability contributes to a smeary and greasy mouth-coating problem and reduces the palatability of meat products (Chattoraj et al., 1979; Mittal, 2005; Das et al., 2009). In contrast, beef fat has a better emulsifying capacity (Mittal, 2005; Bratcher et al., 2011). Pre-emulsification of fat increases the amount of emulsified fat and its uniform distribution in the meat emulsion (Mittal, 2005). Also, fat pre-emulsification enables fat reduction in the final product.
Increase in the number of goats primarily used for milk production will eventually lead to a higher number of culled animals whose meat has a low commercial value. By using goat meat in well-known and frequently consumed meat products, certain value may be added to this meat. As mentioned above, there are several research studies that evaluate the use of goat meat in the preparation of meat products. However, as far as the authors are aware, research on the use of culled meat in frankfurter production is very difficult to find.
The aim of this research was to explore the level of culled goat meat usage in all beef frankfurter production and its influence on the physico-chemical characteristics, colour, texture and sensory properties at the end of the production and during the 6-week storage.
Material and methods
Frankfurter preparation
Five treatments of frankfurters were made of 6 kg each with following formulation: meat (3.0 kg round muscles), beef fat emulsion (1.308 kg: 0.66 kg beef fat, 0.54 kg water, 0.108 kg soy protein isolate), ice (1.5 kg) and ingredients (0.192 kg). Control treatment (CON) was made of beef while in other four treatments beef was replaced with 25%, 50%, 75% and 100% of goat meat (G25, G50, G75 and G100, respectively). Fresh, post-rigour beef (pH 5.83 ± 0.02; moisture: 75.01 ± 1.53; proteins: 21.29 ± 0.93; fat: 1.77 ± 0.48; ash: 1.14 ± 0.01) and goat meat (from culled Alpine goats between 6 and 7 years old; pH: 5.73 ± 0.02; moisture: 75.10 ± 0.48; proteins: 20.68 ± 0.78; fat: 3.88 ± 1.62; ash: 1.19 ± 0.08) and beef fat (fat: 94.33 ± 0.30) were purchased from local retail meat processing units. Meat was trimmed of visible connective tissue and fat, cut into small pieces (samples were taken for analysis), frozen at −20 °C and stored for two weeks before production.
Frankfurters were prepared in a pilot meat processing plant of the Faculty of Agriculture, University of Belgrade. The production process was identical for all treatments, and equal amounts of ingredients were added to all treatments: 1.8% salt (with 0.5% NaNO2), 0.5% polyphosphate commercial mixture (sodium tripoliphosphate and disodium pyrophosphate, P2O5 content ca. 60%), 0.05% sodium erythorbate, 0.5% sucrose, 0.1% ground coriander, 0.15% ground black pepper and 0.10% powder garlic.
First, frozen beef fat was ground in the cutter (Müller EMS, Germany) at knife and bowl speed one (1410 and 12 r.p.m., respectively), to about 5 mm size particles, and was used to prepare beef fat emulsion (just before frankfurter preparation), in the following procedure: tap water was mixed with soy protein isolate (SUPRO EX 33, DuPont, Midland, MI, USA) in the cutter at knife and bowl speed one for 2 min and then with ground beef fat at knife and bowl speed two (2780 r.p.m./24 r.p.m.) until the emulsion became compact and stable (about 3–5 min). Meat was tempered before use in a cooling chamber (about 8 h at 3 ± 1 °C) to about 0 °C and ground through a 20 mm plate (82H; Laska, Traun, Austria) and mixed with ice, salt, polyphosphate and erythorbate in the cutter at knife and bowl speed one for 3 min. The beef fat emulsion and the remaining ingredients were then added and emulsified at knife and bowl speed two until the temperature reached 12 °C.
After emulsification, frankfurters were stuffed into cellulose casings (Viscofan S.A., Navarra, Spain) diameter 22 mm, about 40 g weight, hang linked and underwent the following regime in a smoking/cooking chamber: drying 15 min at 55 °C, smoking 30 min at 65 °C and heated at 85 °C until the temperature in the central part reached 72 °C. The cooked frankfurters were showered with tap water and stored in a cooling chamber at 3 ± 1 °C for 24 h.
Later, 1/3 of frankfurters from each treatment were used for analysis (Day 0), while the remaining 2/3 were vacuum-packed (three in each package and with 99.9 of vacuum level) in coextrusive, barrier bags (PA/PE/PE; 85 lm thick, dimensions 200 mm × 350 mm) using a tabletop vacuum machine (MVS 35x; Minipack-Torre SpA, Dalmine, Italy) and stored at 3 ± 1 °C for 42 days. During storage, analyses were conducted twice: on Days 21 and 42. Two replications of the experiment were conducted on different days. Beef and goat meat and beef fatty tissue were purchased separately for each of the replications.
Physico-chemical analysis
For each treatment, six groups of ten linked frankfurters each were measured after stuffing and after cooling of cooked frankfurters. The weight loss was calculated by the weight difference between these measurements expressed as a percentage of raw frankfurters.
Six vacuum packages per treatment were used to determine purge loss during storage on Days 21 and 42. On measurement days, frankfurters were removed from the package, the surface was dried up with paper towels and the frankfurters were weighed again. Purge loss was calculated by weight difference and expressed as a percentage of the initial weight.
Four frankfurters were randomly taken from each treatment for pH measurement and proximate composition on Days 0, 21 and 42.
pH value was measured by pH meter pH301 (Hanna Instruments, Sarmeola di Rubano, Italy), according to ISO 2917:1999 (1999). The proximate composition was conducted in the following manner: water content by drying samples at 105 °C (ISO 1442 1997); protein content by the Kjeldahl method and multiplying by factor 6.25 (ISO 937 1978); fat content by the Soxhlet method (ISO 1443 1973); and ash content by sample mineralisation at 550–600 °C (ISO 936 1998).
Proximate composition and pH of beef, goat meat and beef fat were performed in quadruplicate according to the stated methods.
Instrumental analysis
Eighteen frankfurters were randomly taken from each treatment for instrumental colour and texture profile analyses, on Days 0, 21 and 42. Frankfurters were held for equilibration to room temperature for 45 min before measurements were taken.
Colour was measured using the Computer vision system (CVS) as described by Tomasevic et al. (2019). Three readings were taken from each frankfurter's RAW photograph, from 5 × 5 pixels measuring area, using a Photoshop Average Color Sampler Tool. Average values of these measurements were calculated and used as one iteration for statistical analysis. C* (chroma) and h (hue angle) were calculated using the following equations:
Total colour difference (TCD) of goat frankfurters (GFs) relative to CON was determined using the standard equation:
where GF is the goat frankfurter; CON is the control.
Texture profile analysis was performed in the same manner as described by Stajić et al. (2018). One measurement was taken on each frankfurter.
Fatty acid profile
Lipids were extracted from 3-g samples by using the cold extraction process, which involves mixing/homogenising with chloroform: methanol mixture (2:1) according to the method by Folch et al. (1957). Fatty acid methyl esters (FAMEs) were prepared from the extracted lipids by transmethylation method with 14% boron trifluoride/methanol solution (Hayat et al., 2009; Kostadinovic et al., 2016). Nitrogen was used for drying and removing n-heptane from fatty acid methyl esters.
Obtained samples were analysed by a gas chromatographer (GC) Agilent 7890A system with flame ionisation detector (FID), auto-injection module for liquid, equipped with fused silica capillary column (SP-2560, 100 m × 0.25 mm, I.D., 0.20 μm). Helium was used as a carrier gas (flow rate = 1.26 mL min−1). Optimal temperature regime for GC analysis of the specific product type, presented by Popović et al. (2017), was applied in order to obtain the best peak separation. Injector temperature was set at 250 °C, and detector temperature was 250 °C. Following temperature regime was applied: start temperature 140 °C hold for 5 min and then heat to 240 °C with 3 °C min−1. After reaching 240 °C, hold for 10 min. Split ratio was 1:50, and injection volume was 1 μL. The fatty acids peaks were identified by a comparison of retention times with retention times of standards from Supelco 37 component FAME mix and with data from internal data library, based on previous experiments on GC-mass spectrometer. An example of the gas chromatogram was presented in Figure S1. Results were expressed as mass % of FA or FA group in total fatty acids.
The following chemicals were used in the analysis: chloroform (99.0%, Lach-ner, Brno, Czech Republic), Methanol (GC purity, Merck KGaA, Darmstadt, Germany), n-heptane (99.99%, J.T. Baker, Phillipsburg, NJ, USA), 14% boron trifluoride (Merck KGaA), nitrogen (99.9999%, Messer, Bad Soden, Germany), helium (99.9997%, Messer) and Supelco 37 Component FAME Mix (Merck KGaA).
Sensory analysis
Frankfurters were evaluated by a trained seven-member panel and by untrained assessors (consumers).
Panel testing
Sensory analysis was performed by a panel comprising seven researchers from the Department of Animal Source Food Technology and Department of Food Safety and Quality Management, with experience in judging meat products. An intensity scale test of 9 points was used for the following attributes: colour (1 = too light, 5 = CON, and 9 = too dark); odour (1 = not enough, 5 = CON, and 9 = too much); taste (1 = not enough, 5 = CON, and 9 = too much); hardness (1 = soft, 5 = CON, and 9 = firm) and juiciness (1 = dry, 5 = CON, and 9 = very juicy). In addition, the panellists were asked to rank the series of GFs based on their overall impression (from 1 ‘the least preferred’ to 4 ‘the most preferred’). The evaluation was performed on Days 0, 21 and 42, in two replicates. The training sessions, frankfurters preparation prior evaluation, evaluation procedures and statistical analysis were the same as described by Stajić et al. (2018). Briefly, a 2.5-h session with the panel members was performed in order to train the panellists in using intensity scales and anchoring the minimum and maximum levels of defined sensory attributes. For the purpose of this training, frankfurters were prepared in the laboratory.
Consumer testing
Sensory analysis was performed using check-all-that-apply (CATA) method. As Jorge et al. (2015) suggested, CATA questions were defined before analysis was performed. In a panel discussion, taking into account the specific characteristics of beef and goat meat, seven participants including professors and researchers from Department of Animal Source Food Technology, and Department of Food Safety and Quality Management, Faculty of Agriculture, University of Belgrade, defined terms for describing appearance (pleasant appearance), colour (pleasant colour, dark surface, light pink surface, light surface, dark red surface), odour (pleasant odour, atypical odour), taste (tasty, atypical taste) and texture (soft, juicy, grainy, hard to chew). The attributes were presented at random to the consumers.
All sixty consumers (aged 21–60, 40% male, 60% female) were selected to participate in CATA survey on the grounds of consuming frankfurters and beef at least once a week, among the staff members of the Institute of Veterinary Medicine, Belgrade, Serbia and students from the Department of Animal Source Food Technology, Faculty of Agriculture, University of Belgrade.
Frankfurters were cut into thirds (approximately 3 cm long without 1 cm of frankfurters ends), coded with a randomly selected three-digit number, heated in a microwave (for 15 s at 650 W, 55–60 °C in the central part of the sample) and immediately served to the consumers in broad daylight, randomly. Assessors were asked to complete a CATA questionnaire and to rate (0–10) overall acceptance (liking) of every treatment. Assessors were not informed about recipe formulations of frankfurters. Assessors used water at room temperature to cleanse their palate between samples. The sensory analysis was performed in a single testing session.
Statistical analysis
Results of weight loss and fatty acid profile were subjected to one-way Anova to evaluate effect of frankfurters formulation. Results of purge loss, proximate composition, pH, instrumental colour and texture profile analysis were subjected to two-way Anova to evaluate effect of formulation, storage time and its interaction. These analyses were performed using software Statistica 12.5 (StatSoft, Inc., Tulsa, OK, USA) and presented as mean ± standard deviation (SD). Differences between means were determined using Tukey's HSD test at the significance level P < 0.05. Results of CATA survey were analysed using XLSTAT-Sensory/CATA data analysis (2017). The analysis included data obtained from the survey of five products (four frankfurters with goat meat (GFs) and one with all beef meat (CON) considered as ideal product) by sixty consumers on fourteen attributes, which are recorded in binary format – 0: attribute absent (No) and 1: attribute present (Yes). Moreover, data about the overall acceptance (except for CON) were also included. Three groups of results were presented. First, the results were presented in a table obtained by Cochran's Q test and included data (frequencies as shares 0.00–1.00) on whether the consumers noticed the attribute for GFs or not. The software does not compare the obtained results with CON, but calculates the frequencies for CON, which have been included the Results and Discussion segment. Second, based on a correspondence analysis, a biplot projection was presented which allows product positioning, including CON (ideal products). The third group of results is related to the penalty analysis and provides data as to whether the observed attributes were absent (No) or present (Yes) in GFs and at the same time absent or present in CON, and how this influenced the overall acceptance scores. To interpret the results, the observed attributes were divided into three groups: affirmative attributes (pleasant appearance, pleasant colour, pleasant odour, tasty, soft and juicy) for which we presented the frequency (%) of presence in both GFs and CON (Yes/Yes), and the absence in GFs but presence in CON (No/Yes); negative attributes (hard to chew, grainy, atypical odour and atypical colour) for which we presented the frequency (%) of presence in GFs, but absence in CON (Yes/No), and absence in both GFs and CON (No/No); colour attributes – dark surface and dark red surface for which we presented the frequency (%) of absence in both GFs and CON (No/No), and absence in GFs, but presence in CON (No/Yes); colour attributes – light surface and light pink surface, for which we presented the frequency (%) of presence in both GFs and CON (Yes/Yes) and presence in GFs, but absence in CON (Yes/No).
Results and discussion
Physico-chemical properties
Lower weight loss (Table 1) in frankfurters with goat meat relative to CON (except G25) was observed, but without significance. The similar values of weight loss were reported in different studies with frankfurters stuffed into cellulose casings (Delgado-Pando et al., 2010; Salcedo-Sandoval et al., 2013). Purge loss (Table 1) was also unaffected by frankfurter formulation on both Days 21 and 42, the values were within those reported for frankfurters stuffed in cellulose casings and vacuum stored (Salcedo-Sandoval et al., 2013; Yotsuyanagi et al., 2016). Storage had a significant impact on purge loss and significantly higher purge loss was found in G25, G50 and G75 at the end of storage. However, this increment did not change the relations between frankfurters. Since literature date indicate the similar content of salt-soluble proteins in goat meat and beef and their high emulsion capacity (Madruga & Bressan, 2011), such results were expected.
Weight loss (%), purge loss (%), proximate composition (%) and pH of frankfurters during storage
| CON | G25 | G50 | G75 | G100 | |
|---|---|---|---|---|---|
| Weight loss | 19.26 ± 1.55 | 19.40 ± 1.98 | 18.25 ± 1.83 | 17.36 ± 1.73 | 18.02 ± 1.69 |
| Purge loss | |||||
| Day 21 | 1.30 ± 0.11 | 1.38 ± 0.17A | 1.32 ± 0.11A | 1.44 ± 0.19A | 1.32 ± 0.16 |
| Day 42 | 1.64 ± 0.16 | 1.79 ± 0.15B | 1.93 ± 0.28B | 1.82 ± 0.27B | 1.62 ± 0.16 |
| Moisture | |||||
| Day 0 | 65.21 ± 0.53 | 66.02 ± 1.56 | 65.91 ± 0.53 | 65.22 ± 0.27 | 65.66 ± 0.29 |
| Day 21 | 65.37 ± 0.85 | 64.98 ± 1.36 | 65.45 ± 0.87 | 65.17 ± 1.10 | 65.29 ± 1.04 |
| Day 42 | 64.68 ± 1.31 | 64.78 ± 0.33 | 65.47 ± 1.51 | 65.07 ± 0.71 | 65.40 ± 1.82 |
| Fat | |||||
| Day 0 | 14.33 ± 0.22 | 14.38 ± 0.57 | 14.68 ± 0.59 | 14.80 ± 0.61 | 15.28 ± 0.21 |
| Day 21 | 14.56 ± 0.31 | 14.45 ± 1.00 | 14.67 ± 0.08 | 14.85 ± 0.76 | 15.37 ± 0.64 |
| Day 42 | 14.63 ± 1.19 | 14.37 ± 0.62 | 14.58 ± 0.89 | 14.75 ± 1.02 | 15.06 ± 0.42 |
| Protein | |||||
| Day 0 | 15.30 ± 0.65 | 15.38 ± 0.21 | 14.83 ± 1.02 | 14.80 ± 1.46 | 14.60 ± 0.76 |
| Day 21 | 15.64 ± 1.17 | 15.58 ± 0.10 | 15.21 ± 0.11 | 15.31 ± 0.90 | 14.68 ± 0.68 |
| Day 42 | 15.54 ± 1.17 | 15.54 ± 0.54 | 15.22 ± 0.73 | 15.08 ± 0.62 | 15.05 ± 0.19 |
| Ash | |||||
| Day 0 | 3.36 ± 0.02 | 3.38 ± 0.14 | 3.42 ± 0.20 | 3.50 ± 0.39 | 3.46 ± 0.10 |
| Day 21 | 3.58 ± 0.01 | 3.52 ± 0.14 | 3.42 ± 0.09 | 3.28 ± 0.02 | 3.66 ± 0.28 |
| Day 42 | 3.45 ± 0.19 | 3.53 ± 0.10 | 3.49 ± 0.16 | 3.69 ± 0.13 | 3.49 ± 0.20 |
| pH | |||||
| Day 0 | 6.35 ± 0.01dA | 6.38 ± 0.01cdA | 6.41 ± 0.01cA | 6.48 ± 0.01bA | 6.56 ± 0.01aA |
| Day 21 | 6.21 ± 0.01eB | 6.25 ± 0.01dB | 6.32 ± 0.01cB | 6.37 ± 0.01bB | 6.42 ± 0.02aB |
| Day 42 | 6.09 ± 0.02eC | 6.12 ± 0.01dC | 6.17 ± 0.01cC | 6.23 ± 0.01bC | 6.31 ± 0.01aC |
Frankfurters: CON: all beef; G25: 25% of beef substituted by goat meat; G50: 50% of beef substituted by with goat meat; G75: 75% of beef substituted by goat meat; G100: all goat meat.
(a–e) Lowercase letters are used for comparing values between treatments. Values (mean ± SD) in the same row with different lowercase letters in superscripts are significantly different (P < 0.05).
(A–C) Uppercase letters are used for comparing values within the same treatment during the storage. Values in the same column for the same property, with different superscripts, are significantly different (P < 0.05).
Due to the similar basic chemical composition of meat and similar weight and purge loss, it was expected that basic chemical composition of frankfurters (Table 1) would be similar. The progressive increase in fat content and the decrease in protein content (up to 1%) with higher goat meat content (and smaller beef content) were observed, but were not significant. Storage and the interaction of factors also had no significant impact on chemical composition of frankfurters.
The progressive increase in goat meat content influenced the progressive and significant increase in pH values (Table 1). However, this did not influence the water-holding properties of frankfurters, probably due to small differences which were up to 0.2. pH values were within those for the emulsified type of sausages and were similar to those reported for pork (Pintado et al., 2016), pork/beef (Yotsuyanagi et al., 2016) and beef (Vural & Javidipour, 2002) frankfurters, goat meat mortadella (Guerra et al., 2011) and goat meat patties (Das et al., 2009). The pH values declined during storage in all frankfurters, which can also be considered normal for this type of products (Özvural & Vural, 2012). Lower pH values during storage of vacuum-packaged frankfurters can be a result of organic acids formation by lactic acid bacteria (Alirezalu et al., 2019). The levels of pH decrease during 42 days of cold storage were very similar within frankfurters (0.24–0.26) which cannot be necessarily related to spoilage. Alirezalu et al. (2019) reported lower decrease levels (up to 0.76) during the storage of frankfurter-type sausages, without reaching the upper limit of bacterial total viable count of 5 log CFU g−1 suggested by food authorities. Fernández-López et al. (2019) reported that after 21 days of frankfurters storage, the total viable count of 5 log CFU g−1 was not reached, while pH decrease levels were 0.19–0.32.
Internal colour
In general, a significant influence of frankfurter formulation and storage time (but without significant influence of their interaction) on instrumental colour parameters (Table 2) was observed. Moreover, progressive changes with increasing goat meat content (and the simultaneously decreasing beef) in formulation, in all observed colour parameters (except hue angle), were recorded.
Parameters of instrumental colour analysis of cross section
| CON | G25 | G50 | G75 | G100 | |
|---|---|---|---|---|---|
| L* | |||||
| Day 0 | 57.31 ± 2.60cA | 57.54 ± 2.95cA | 58.56 ± 2.32bcA | 60.00 ± 1.76abA | 61.06 ± 2.22aA |
| Day 21 | 63.00 ± 2.00cB | 65.43 ± 1.45bB | 65.78 ± 1.50abB | 67.27 ± 1.62abB | 67.78 ± 1.73aB |
| Day 42 | 63.93 ± 1.44bB | 65.94 ± 1.56abB | 66.63 ± 1.45aB | 67.26 ± 1.94aB | 68.11 ± 1.66aB |
| a* | |||||
| Day 0 | 16.41 ± 1.09a | 15.54 ± 1.19a | 15.22 ± 0.82b | 14.62 ± 0.79bcA | 13.96 ± 0.74c |
| Day 21 | 15.57 ± 0.76a | 14.67 ± 0.84ab | 14.39 ± 0.70b | 13.39 ± 0.54cB | 13.04 ± 0.43c |
| Day 42 | 15.81 ± 1.30a | 15.06 ± 1.11ab | 14.44 ± 0.66bc | 13.89 ± 0.78cdAB | 13.39 ± 0.54d |
| b* | |||||
| Day 0 | 6.41 ± 0.47A | 6.16 ± 0.56A | 6.15 ± 0.94A | 6.05 ± 0.65AB | 5.81 ± 0.47AB |
| Day 21 | 6.73 ± 0.75aA | 6.28 ± 1.00abA | 6.13 ± 0.89abA | 5.86 ± 0.89abA | 5.48 ± 0.75bA |
| Day 42 | 7.74 ± 0.66aB | 7.43 ± 0.86abB | 6.81 ± 0.62bcA | 6.74 ± 0.91bcB | 6.43 ± 0.85cB |
| C* | |||||
| Day 0 | 17.44 ± 1.02a | 16.73 ± 1.22ab | 16.44 ± 1.06ab | 15.83 ± 0.89bcA | 15.13 ± 0.82c |
| Day 21 | 16.98 ± 0.77a | 15.98 ± 1.05ab | 15.66 ± 0.87bc | 14.64 ± 0.75cdB | 14.17 ± 0.59d |
| Day 42 | 17.62 ± 1.39a | 16.80 ± 1.25ab | 15.99 ± 0.64bc | 15.46 ± 1.04cdAB | 14.87 ± 0.72d |
| h | |||||
| Day 0 | 21.44 ± 2.05A | 21.66 ± 1.72A | 21.88 ± 2.33A | 22.44 ± 1.82A | 22.61 ± 1.17A |
| Day 21 | 23.36 ± 2.56A | 23.09 ± 2.75A | 22.99 ± 2.69AB | 23.52 ± 2.86AB | 22.72 ± 2.58A |
| Day 42 | 26.11 ± 1.46B | 26.23 ± 2.18B | 25.23 ± 2.26B | 25.75 ± 2.2B | 25.56 ± 2.75B |
| TCD | |||||
| Day 0 | 2.61 | 3.58 | 3.96 | 5.68 | |
| Day 21 | 3.19 | 4.08 | 5.34 | 5.85 | |
| Day 42 | 2.76 | 3.54 | 4.44 | 5.59 | |
Frankfurters: CON: all beef; G25: 25% of beef substituted by goat meat; G50: 50% of beef substituted by with goat meat; G75: 75% of beef substituted by goat meat; G100: all goat meat; TCD, total colour difference.
(a–d) Lowercase letters are used for comparing values within treatments. Values (mean ± SD) in the same row with different superscripts are significantly different (P < 0.05).
(A, B) Uppercase letters are used for comparing values within the same treatment during the storage. Values in the same column for the same property, with different superscripts, are significantly different (P < 0.05).
With increasing goat meat content, the surface of frankfurter cross section became lighter, but significant differences, relative to CON, were found when 75% and more of beef was replaced with goat meat (G75 and G100). Also, G100 (all goat meat) significantly differed from G25. The storage significantly (P < 0.001) influenced on lightness changes. At Day 21, the cross-sectional surface of all frankfurters was significantly lighter. The increase in L* values was also observed at Day 42, but not significantly relative to Day 21. The changes were more intensive in GFs; hence, on Day 21 all GFs had significantly higher L* values relative to CON, while G100 compared with G25. At the end of storage, G100 was again significantly lighter to CON but no differences between GFs were observed.
Contrary to lightness, a*, b* and C* values were progressively lower with the increase in goat meat content.
The use of 25% of goat meat instead of beef did not significantly influence redness because no significant differences between CON and G25 were found on Day 0 and throughout the storage period. However, significant differences were observed in GFs with 50% and more of goat meat content in the formulation. Regarding GFs, the use of 75% and more of goat meat in the formulation led to significant differences relative to G25. During storage, a* values were lower in all frankfurters, without significance (except in G75) but similar relations within frankfurters were observed as on Day 0.
Relations very similar to those within a* values were observed in C* values. Significantly lower C* values in frankfurters with 50% and more of goat meat relative to CON were observed. Moreover, more than 75% of goat meat in formulation led to significantly lower values relative to frankfurters with 25% of goat meat. As was for a* values, storage did not lead to significant changes (except G75) while relations within frankfurters were similar to relations as were on Day 0.
The differences in L* and a* of frankfurters can be attributed to the colour differences between beef and goat meat. Though comparative studies on differences in goat and beef meat colour are scarce, by combining data about myoglobin content and colour characteristics of meat of different species (beef vs. sheep meat; sheep vs. goat meat) we can conclude that, in general, goat meat has higher L* values and lower a* values than beef meat (Seideman et al., 1984; Dhanda et al., 1999; Suman et al., 2009).
The lowest impact of goat meat usage in beef frankfurter formulation was observed on yellow tone parameters. On Day 0, no significant differences were observed regarding b* and hue angle values. Storage significantly (P < 0.001) influenced on b* value changes so that on Day 42 were higher relative to both Day 21 and Day 0 (except G50 and G75). This caused significant differences between CON and GFs with 50% and more of goat meat at the end of storage. Regarding hue angle, changes during storage, though significant in all frankfurters, did not lead to significant differences within frankfurters, but storage had significant influence (P < 0.001) which did not led to different relations within frankfurters.
The values of TCD were also progressively increased with goat meat content in formulation. Though the threshold value for human eye detection has not been established, some literature data indicate potential detection interval(s). Brainard (2003) indicates that TCD values in the range 2–10 are perceptible at a glance. Ramírez-Navas & Rodríguez De Stouvenel (2012) indicated that TCD values lower than 2.7 are not noticeable to the human eye and marked TCD values in 3–6 range as appreciable, while values higher than 6 as considerable. According to this, the use of more than 50% of goat meat in beef/goat frankfurter formulation could lead to perceptible colour changes. However, sensory evaluation should confirm if this could lead to a negative perception. TCD values during storage were similar, indicating that all changes in colour in all frankfurters were at the same level.
Textural properties
The use of goat meat in frankfurter formulation and storage resulted in sporadic differences in hardness, adhesiveness and chewiness (Table 3), while their interaction had no significant influence of any of observed textural parameters. Moreover, no significant differences between CON and any of the GFs were recorded on Day 0 and throughout storage, which indicates good emulsifying properties of goat meat proteins and good product stability.
Results of texture profile analysis
| CON | G25 | G50 | G75 | G100 | |
|---|---|---|---|---|---|
| Hardness (N) | |||||
| Day 0 | 18.53 ± 2.15 | 17.09 ± 2.21 | 18.44 ± 2.42 | 18.29 ± 2.22 | 18.96 ± 1.83 |
| Day 21 | 17.60 ± 2.28 | 17.54 ± 2.91 | 17.96 ± 3.00 | 17.59 ± 3.32 | 18.13 ± 3.41 |
| Day 42 | 19.86 ± 3.20 | 17.96 ± 2.78 | 21.05 ± 4.00 | 20.27 ± 3.06 | 18.88 ± 2.74 |
| Adhesiveness (N*s) | |||||
| Day 0 | −0.114 ± 0.081 | −0.100 ± 0.061 | −0.071 ± 0.030 | −0.065 ± 0.034 | −0.121 ± 0.081 |
| Day 21 | −0.102 ± 0.068 | −0.113 ± 0.073 | −0.124 ± 0.080 | −0.103 ± 0.070 | −0.130 ± 0.079 |
| Day 42 | −0.092 ± 0.074 | −0.080 ± 0.052 | −0.126 ± 0.067 | −0.117 ± 0.064 | −0.115 ± 0.061 |
| Springiness | |||||
| Day 0 | 0.855 ± 0.01b | 0.869 ± 0.03ab | 0.878 ± 0.02ab | 0.881 ± 0.01ab | 0.892 ± 0.03a |
| Day 21 | 0.872 ± 0.03 | 0.872 ± 0.03 | 0.880 ± 0.02 | 0.888 ± 0.02 | 0.891 ± 0.02 |
| Day 42 | 0.860 ± 0.02b | 0.874 ± 0.02b | 0.884 ± 0.03ab | 0.885 ± 0.03ab | 0.919 ± 0.08a |
| Cohesiveness | |||||
| Day 0 | 0.715 ± 0.03 | 0.732 ± 0.03 | 0.736 ± 0.02 | 0.730 ± 0.03A | 0.743 ± 0.03A |
| Day 21 | 0.744 ± 0.01ab | 0.747 ± 0.02ab | 0.738 ± 0.02b | 0.756 ± 0.02abAB | 0.769 ± 0.02aAB |
| Day 42 | 0.740 ± 0.02b | 0.754 ± 0.01b | 0.759 ± 0.03b | 0.764 ± 0.04bB | 0.794 ± 0.05aB |
| Chewiness (N) | |||||
| Day 0 | 11.30 ± 1.18 | 10.86 ± 1.40 | 11.90 ± 1.54A | 11.75 ± 1.41 | 12.55 ± 1.22 |
| Day 21 | 11.44 ± 1.65 | 11.39 ± 1.68 | 11.65 ± 1.85A | 11.81 ± 2.32 | 12.39 ± 2.31 |
| Day 42 | 12.64 ± 2.09ab | 11.84 ± 1.81b | 14.11 ± 2.71aB | 13.66 ± 1.84ab | 13.70 ± 1.72ab |
Frankfurters: CON: all beef; G25: 25% of beef substituted by goat meat; G50: 50% of beef substituted by with goat meat; G75: 75% of beef substituted by goat meat; G100: all goat meat.
(a–c) Values (mean ± SD) in the same row with different superscripts are significantly different (P < 0.05).
(A, B) Uppercase letters are used for comparing values within the same treatment during the storage. Values in the same column for the same property, with different superscripts, are significantly different (P < 0.05).
Progressive increases of springiness and cohesiveness with the increase in goat meat content were observed. However, regarding springiness, on Day 0, only G100 (all goat meat frankfurter) had significantly higher values compared with CON, and no differences were found between GFs. Changes during storage were not significant in all frankfurters, but on Day 42 significantly higher values were observed between G100 and CON (and G25). Frankfurters were more cohesive with the increase of goat meat content in formulation, but on Day 0 without significant differences. During storage, frankfurters become more cohesive (significantly in G75 and G100), which at the end of storage led to significant differences between G100 and other frankfurters.
The results of the texture profile analysis together with the results of weight loss, purge loss and proximate composition confirmed previous research which pointed out that goat meat had desirable emulsifying characteristics (Turgut, 1984; Mittal, 2005; Bratcher et al., 2011; Madruga & Bressan, 2011) and also indicated that meat from culled goats can be used in emulsified meat products even as the sole meat source.
Fatty acids profile
In general, palmitic, stearic and oleic acids are the most abundant fatty acids in bovine adipose tissues (Smith & Smith, 2014). Furthermore, these fatty acids are also the most abundant in muscle fats. Beef meat on average contains 0.45–0.48 of SFA, 0.35–0.45 of MUFA and up to 0.05 of PUFA (Scollan et al., 2014). Similarly, goat meat (depending of feed, breed and muscle type) can contain (in total FA) 37–44% SFA, 30–45% MUFA and higher PUFA content than beef, especially higher contents of α-linolenic acid (ALA), eicosapentaenoic acid (EPA) and docosahexaenoic acid (DHA) (Wood et al., 2004; Ivanovic et al., 2016; Corazzin et al., 2019).
Since fatty tissue content, which is the main FA source in this research, was not changed, increase in the goat meat content (and the simultaneously decreasing beef meat content) did not have a significant influence on lauric, myristic, palmitic and stearic acid contents (Table 4). Malekian et al. (2016) also reported no significant influence of increasing goat meat content in beef heat-treated sausages for myristic palmitic and stearic acids. A progressive decrease in other SFAs (significantly in G75 and G100 relative to CON) led to significantly lower SFA content but only in G100, compared with CON and G25. Malekian et al. (2016) reported progressive increase in total SFA content with goat meat content increment in sausage formulation, but without significant differences between treatments. The increase of goat meat in the frankfurter formulation significantly influenced the oleic acid content, which was higher in all GFs relative to CON. Still, the MUFA content was in the narrow range 33.13–33.54, but significantly lower in G25 relative to other frankfurters.
Fatty acids profile of frankfurters (g in 100 g of total fatty acids)
| CON | G25 | G50 | G75 | G100 | |
|---|---|---|---|---|---|
| C12:0 | 0.05 ± 0.00a | 0.06 ± 0.00a | 0.05 ± 0.00a | 0.06 ± 0.00a | 0.05 ± 0.03a |
| C14:0 | 2.33 ± 0.00a | 2.28 ± 0.01a | 2.37 ± 0.00a | 2.37 ± 0.06a | 2.34 ± 0.18a |
| C16:0 | 24.51 ± 0.02a | 24.50 ± 0.01a | 24.59 ± 0.05a | 24.38 ± 0.03a | 24.10 ± 0.98a |
| C18:0 | 33.64 ± 0.03a | 33.73 ± 0.01a | 33.15 ± 0.02a | 33.70 ± 0.10a | 33.79 ± 1.19a |
| Other SFAs | 2.69 ± 0.00a | 2.64 ± 0.01ab | 2.59 ± 0.01abc | 2.42 ± 0.20bc | 2.34 ± 0.17bc |
| C16:1 | 1.30 ± 0.00a | 1.29 ± 0.00a | 1.32 ± 0.01a | 1.26 ± 0.01a | 1.27 ± 0.08a |
| C18:1n9c | 27.40 ± 0.02c | 28.21 ± 0.01b | 28.54 ± 0.03a | 28.45 ± 0.06ab | 28.51 ± 0.31ab |
| Other MUFAs | 4.80 ± 0.03a | 3.63 ± 0.00b | 3.68 ± 0.11b | 3.72 ± 0.00b | 3.65 ± 0.19b |
| C18:2n6c | 2.61 ± 0.00a | 2.61 ± 0.00a | 2.52 ± 0.08a | 2.41 ± 0.01a | 2.47 ± 0.23a |
| C18:3n3 | 0.14 ± 0.00c | 0.24 ± 0.00b | 0.26 ± 0.01b | 0.28 ± 0.01b | 0.36 ± 0.05a |
| EPA + DHA | 0.00 ± 0.00 | 0.04 ± 0.00 | 0.07 ± 0.00 | 0.08 ± 0.00 | 0.15 ± 0.03 |
| Other PUFAs | 0.54 ± 0.00b | 0.81 ± 0.01ab | 0.87 ± 0.02a | 0.94 ± 0.19a | 1.11 ± 0.26a |
| ΣSFA | 63.23 ± 0.05a | 63.21 ± 0.03a | 62.76 ± 0.07ab | 62.92 ± 0.18ab | 62.63 ± 0.45b |
| ΣMUFA | 33.50 ± 0.03a | 33.13 ± 0.01b | 33.54 ± 0.14a | 33.43 ± 0.06a | 33.42 ± 0.07a |
| ΣPUFA | 3.29 ± 0.01c | 3.66 ± 0.01b | 3.65 ± 0.10b | 3.63 ± 0.19b | 3.94 ± 0.16a |
| PUFA/SFA | 0.05 ± 0.00c | 0.06 ± 0.00b | 0.06 ± 0.00b | 0.06 ± 0.00bc | 0.06 ± 0.00a |
| n-6 PUFA | 3.00 ± 0.01c | 3.26 ± 0.01ab | 3.24 ± 0.08ab | 3.21 ± 0.10b | 3.43 ± 0.15a |
| n-3 PUFA | 0.21 ± 0.00d | 0.29 ± 0.01cd | 0.34 ± 0.01bc | 0.42 ± 0.10ab | 0.52 ± 0.03a |
| n-6/n-3 | 14.63 ± 0.18a | 11.36 ± 0.19b | 9.62 ± 0.30c | 8.00 ± 1.40d | 6.63 ± 0.37d |
Frankfurters: CON: all beef; G25: 25% of beef substituted by goat meat; G50: 50% of beef substituted by with goat meat; G75: 75% of beef substituted by goat meat; G100: all goat meat; MUFA, monounsaturated fatty acids; PUFA, polyunsaturated fatty acids; SFA, saturated fatty acids.
(a–d) Values (mean ± SD) in the same row with different superscripts are significantly different (P < 0.05).
The contents of different PUFAs, which are mainly restricted to the phospholipids, were the most affected by the frankfurter formulation. The PUFA content was significantly higher in all GFs relative to CON and in G100 relative to all other GFs, despite the fact that the content of linoleic acid was similar, mainly because of the higher arachidonic acid content (data not shown). The ALA content was higher in all GFs compared with CON and in G100 relative to other GFs. The progressive increase in the EPA + DHA content was also observed with the increase in the goat meat content, as well as with the n-3 PUFA content. These led to a more favourable n-6/n-3 ratio in GFs which was significantly and progressively lower with goat meat content increments. These data are of importance since research studies indicate the beneficial influence of ALA and especially EPA and DHA in preventing and reducing the risk of cancer, coronary heart disease, type 2 diabetes and even neurological disorders (McAfee et al., 2010; Zhang et al., 2010). Another important parameter of balanced fat intake is the n-6/n-3 PUFA ratio, which is closer to the recommended upper value of 4 (Jiménez-Colmenero, 2007) with the goat meat content increments. Higher ratios have been identified as risk factors for different diseases, especially in the formation of blood clots, which lead to a heart attack (Harris & Schacky, 2004).
Linear increment of n-3 PUFA content and more favourable n-3/n-6 rations with increment of goat meat content in beef sausages was also reported by Malekian et al. (2016). Literature data indicated that goat meat can have higher contents of ALA and EPA + DHA compared with beef. Corazzin et al. (2019) stated that ALA content in goat meat ranges between 1.3% and 1.8% and EPA + DHA between 1.3% and 2.8% of total fatty acids. On the other hand, Wood et al. (2004) cited 0.70% of ALA and 0.33% of EPA + DHA contents in total fatty acids in beef.
However, the PUFA/SFA ratios, despite the fact that they are significantly higher in GFs compared to CON, were far from the recommended interval of 0.4–1 (Jiménez-Colmenero, 2007) due to high SFA contents. This opens up the possibility that by improving PUFA/SFA ratio (by increasing n-3 PUFA content) the n-6/n-3 ratios can also be improved to more favourable – below 4 (Jiménez-Colmenero, 2007).
Sensory evaluation
Consumers
In general, the results of CATA analysis indicate that products had very similar sensory profiles (P = 0.151). However, Cochran's Q test for each attribute shows that there were significant differences (P < 0.05) in some observed attributes within goat frankfurters (Table 5).
Cochran's Q test for each attribute
| Attributes | P-values | G25 | G50 | G75 | G100 |
|---|---|---|---|---|---|
| Pleasant appearance | 0.354 | 0.867 | 0.883 | 0.933 | 0.933 |
| Pleasant colour | 0.543 | 0.867 | 0.883 | 0.933 | 0.900 |
| Pleasant odour | 0.002 | 0.783a | 0.783a | 0.983b | 0.817a |
| Tasty | 0.032 | 0.733 | 0.833 | 0.917 | 0.833 |
| Soft | 0.891 | 0.833 | 0.867 | 0.850 | 0.833 |
| Juicy | 0.520 | 0.783 | 0.833 | 0.850 | 0.850 |
| Atypical odour | 0.036 | 0.183 | 0.183 | 0.083 | 0.117 |
| Atypical taste | 0.030 | 0.233b | 0.183ab | 0.067a | 0.217ab |
| Hard to chew | 0.418 | 0.083 | 0.100 | 0.150 | 0.167 |
| Grainy | 0.343 | 0.383 | 0.333 | 0.283 | 0.283 |
| Dark surface | 0.000 | 0.333b | 0.250ab | 0.100a | 0.100a |
| Light surface | 0.000 | 0.617a | 0.700ab | 0.867b | 0.883b |
| Dark red surface | 0.008 | 0.200 | 0.117 | 0.050 | 0.067 |
| Light pink surface | 0.233 | 0.583 | 0.667 | 0.667 | 0.700 |
Frankfurters: G25: 25% of beef substituted by goat meat; G50: 50% of beef substituted by with goat meat; G75: 75% of beef substituted by goat meat; G100: all goat meat.
(a, b) Values (mean ± SD) in the same row with different superscripts are significantly different (P < 0.05).
The correspondence analysis used to evaluate the descriptors explained 94.44% of the total variations (Fig. 1). The map shows that all frankfurters were very similar in terms of their sensory attributes. Of all treatments, G75 was the least characterised by atypical odour and atypical taste. G100 was the least characterised by dark surface and dark red surface, while compared with other treatments, it was mostly characterised by hard to chew.
![Biplot projection of the frankfurter samples and the sensory attributes in the first and second dimensions of correspondence analysis performed on data obtained from CATA questions. Products: CON: all beef; G25: 25% of beef substituted by goat meat; G50: 50% of beef substituted by with goat meat; G75: 75% of beef substituted by goat mean; G100: all goat meat. [Colour figure can be viewed at wileyonlinelibrary.com]](https://oup.silverchair-cdn.com/oup/backfile/Content_public/Journal/ijfst/55/3/10.1111_ijfs.14346/1/m_ijfs14346-fig-0001-m.jpeg?Expires=1750425563&Signature=4zoLGbTu3ImRhJa~ISwGfn5FPw4KokSUWHenmqJupauGjw~5NEnTP35LAPX-nozYQNljKyCddV2eBaQSPTsh9kScS8syZppzFmKdVYfIxtwzOvM0Nq1VQSreHpExbCA~2ogIjbsbwCPQTcCiLz8IGXPQs80yfPLs8I7CAR6bR~RufbxpOG12aHSuVAYuuvZsPKyNQ6h-Z2z9WeDgiJkAPZfUiz3QlMohbfqzG2-hwiLwTquUFm157XdKLU9KItsqTWbP1G6fIIym6MK3ee9onpwdUrWtCbJlFikaJiB15mdWNU08zHGNoALJK4mwsRLr0cgPP4w~eu7EkQaNXqgVhQ__&Key-Pair-Id=APKAIE5G5CRDK6RD3PGA)
Biplot projection of the frankfurter samples and the sensory attributes in the first and second dimensions of correspondence analysis performed on data obtained from CATA questions. Products: CON: all beef; G25: 25% of beef substituted by goat meat; G50: 50% of beef substituted by with goat meat; G75: 75% of beef substituted by goat mean; G100: all goat meat. [Colour figure can be viewed at wileyonlinelibrary.com]
More than 70% of consumers considered that affirmative sensory attributes were present in both GFs and CON (Yes/Yes – Fig. 2a). On the other hand, between 6.7% (for pleasant colour) and 11.3% (for tasty) of consumers, marked that these attributes were present in CON but not in GFs (No/Yes – Fig. 2a). In that case, mean liking scores were lower, from 1.0 (for soft) to 2.9 (for tasty). The results in Table 5 indicate that most consumers marked all affirmative sensory attributes as present in all GFs. Cochran's Q test indicates significant differences within GFs only in pleasant odour between G75 and other GFs. Also, most consumers marked these attributes for CON, from 78.3% (for pleasant odour) to 86.7% (for soft).
![Frequencies (%) of absence (No) and presence (Yes) of sensory attributes in goat frankfurters (GFs) and at the same time absence or presence in all beef frankfurter (CON) –GFs/CON. [Colour figure can be viewed at wileyonlinelibrary.com]](https://oup.silverchair-cdn.com/oup/backfile/Content_public/Journal/ijfst/55/3/10.1111_ijfs.14346/1/m_ijfs14346-fig-0002-m.jpeg?Expires=1750425563&Signature=UcgHFCcW-RgnqVFxfSUAEn3UxmTPmhWLypwuq~ezF~IorliKlSeDc93jkdf~gDbfXQIXZPJUQXMqvw1F0ZJPLeVdcDuiPDkgASzXF~G6kCyuDozznwhAZSIoogShYzk4ctgqEhK36G9nrqaAuPeYJKL4RlP2voQKFPK57cMhBiwWqe7OEsCy8JPHEeW0uhgyuqJQ6RmdhgOvovKS83HzBPHo0eMa32cl5ckcfsFFW4PVgly~3YdtU3-SBbBAeq1DLNgm-NOhC3s6hA1Hw5AA7Hy5cHJOYsYolVwkSQtcpabBz90jKGBgV41NGrc0ZV-v1vIs05uzVMadzCecbfHE0w__&Key-Pair-Id=APKAIE5G5CRDK6RD3PGA)
Frequencies (%) of absence (No) and presence (Yes) of sensory attributes in goat frankfurters (GFs) and at the same time absence or presence in all beef frankfurter (CON) –GFs/CON. [Colour figure can be viewed at wileyonlinelibrary.com]
Sensory attributes that can be associated with negative perceptions were mostly not present in both GFs and in CON (No/No – Fig. 2b). Conversely, between 7.9% (for atypical odour) and 11.3% (for hard to chew) of consumers marked these attributes as present in GFs, but not present in CON (Yes/No – Fig. 2b). In that case, mean liking scores were lower from 0.8 (for grainy) to 1.2 (for atypical odour). The results in Table 5 also indicate that these sensory attributes were not frequently marked in individual GFs. Significant differences were observed only for atypical taste between G25 and G75. CON was more frequently marked than GFs, from 18.3% (atypical odour) to 38.3% (grainy), except for hard to chew (10%). Values for grainy and hard to chew progressively changed with goat meat content, though not significantly (P > 0.05).
Most consumers marked that dark surface and dark red surface were not present in GFs and in CON (No/No – Fig. 2c), while approximately one in five consumers marked that they were not present in GFs, but present in CON (No/Yes – Fig. 2c). However, in that case, mean liking scores were lower by no more than 0.4, which together with the results for pleasant colour indicate that consumers do not perceive this as a negative influence. Consumers progressively frequently marked these attributes with the increase in goat meat content, and significant differences were observed between G25, and G75 and G100 regarding dark surface. CON was more frequently marked for these attributes than GFs, 38.3% (dark surface) and 28.3% (dark red surface). Regarding light surface and light pink surface, about one in five consumers marked them as present in GFs but not in CON (Yes/No – Fig. 2c), which correlates with the results for dark surface and dark red surface. About 55% and 42% of consumers marked that these attributes were present in GFs and in CON (Yes/Yes – Fig. 2c). But in both cases, mean liking scores were different by no more than 0.5. The frequency of consumers that marked these two attributes progressively increased in goat frankfurters. Significant differences were found in light surface between G25, and G75 and G100. CON was less frequently marked for these attributes than GFs, 60.0% (light surface) and 46.7% (light pink surface). These results, together with the results of panel testing for colour, indicate that differences in lightness and redness obtained by instrumental colour measurement were noticed by panellists and consumers. However, this was not negatively perceived given that more that 85% of consumers (Table 5) marked pleasant colour as present in all GFs.
Data in literature are scarce in terms of goat frankfurters but a similar research reported the potential use of goat meat in the production of ground meat products. The results of this research are in agreement with the research by Marshall et al. (1977) who used up to 40% of mechanically deboned goat meat in beef frankfurters and reported that sensory properties of frankfurters were not negatively altered. Bratcher et al. (2011) reported that goat frankfurters with beef fat and canola oil were not unacceptable. The research into other types of goat meat products also reported their good acceptability. Das et al. (2009) reported good acceptability of goat meat patties and concluded that goat fat can reduce flavour and overall acceptability. Paulos et al. (2015) reported that goat meat fresh sausages were defined as harder and more fibrous than the ones made of mutton and concluded that fresh sausages made of the meat of culled goats can be marketable. Good acceptability of fresh sausages made of the meat of culled goats and 30% of pork fat was also reported by Leite et al. (2015).
Panel testing
The results of the intensity scales test (Fig. 3) showed that GFs were graded very close to CON and no significant differences within them were found regarding odour, taste, hardness and juiciness. Only colour was significantly affected by frankfurter formulations. Panellist perceived GFs as lighter than CON, even lighter with the increase in goat meat content. G25 was graded closest to CON and significantly differ relative to frankfurter with all goat meat (G100) on Days 0 and 42 and to G75 on Day 42.
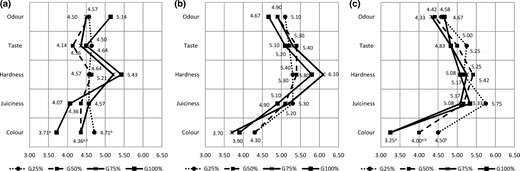
Semantic differential chart; (a) Day 0; (b) Day 21; (c) Day 42. Mean values within the same row with the different superscripts differ significantly (P < 0.05); For all five sensory attributes, value equal to 5 corresponds to CON. Frankfurters: G25: 25% of beef substituted by goat meat; G50: 50% of beef substituted by with goat meat; G75: 75% of beef substituted by goat meat; G100: all goat meat.
Preference ranking requires the presentation of three or more samples, rank-ordered for preference with one sample being preferred over the next (Hein et al., 2008). The results pointed at G50 as the goat frankfurter with the highest rank sums in all three evaluations, while all goat meat frankfurters (G100) was the least preferred (Table 6). After three weeks, changes that occur show statistically significant differences in perceived preferences of the four samples (Friedman test χ2 = 11.229; P < 0.05). Post hoc LSD test revealed three homogenous subsets of rank sums. No statistically significant differences were observed at the beginning and at the end of the period (Days ‘0’ and ‘42’).
Ranks sum preference of goat frankfurters
| Rank sum†,‡ | |||||||
|---|---|---|---|---|---|---|---|
| Homogeneous subsets for α = 0.05 | |||||||
| Day 0 | Day 21 | Day 42 | |||||
| Preference | 1 | Preference | 1 | 2 | 3 | Preference | 1 |
| G50 | 41 | G50 | 46 | G50 | 42 | ||
| G75 | 38 | G75 | 39 | 39 | G25 | 37 | |
| G100 | 32 | G25 | 30 | 30 | G75 | 31 | |
| G25 | 29 | G100 | 25 | G100 | 30 | ||
Frankfurters: G25: 25% of beef substituted by goat meat; G50: 50% of beef substituted by with goat meat; G75: 75% of beef substituted by goat meat; G100: all goat meat.
n = 14 (complete block design).
The four samples were ranked from 1 – the least preferred to 4 – the most preferred (based on the preference of panellists during panel testing). Testing was performed in two replicates. Panel consisted of seven panellists.
Conclusions
The use of meat from culled goats has great potential in the production of emulsified-type meat products such as frankfurters. Technological properties (weight loss and purge loss), the basic chemical composition and texture were not altered by the formulation (goat meat content) or by storage. Despite a progressive and significant increase, pH values were within the range that can be found in the emulsified type of sausages and it did not alter technological properties. Progressively higher lightness and lower redness were measured in frankfurters with the higher goat meat content. This was also observed by consumers, but not perceived as unpleasant colour characteristics. Goat frankfurters had more favourable n-3 PUFA contents, but high SFA contents led to very unfavourable PUFA/SFA ratios, in the 0.05–0.06 interval.
Less desirable goat meat from culled animals can gain additional value when used in the production of frankfurters on its own or in combination with beef (25–75%). However, the panellists pointed at G50 as the most preferred, while consumers most frequently marked G75 in terms of affirmative sensory attributes and less frequently in terms of negative attributes than other GFs.
Data availability statement
Research data are not shared.
Conflict of interests
Authors declare no conflict of interests.
Ethics approval
Ethics approval was not required for this research.
