


Abstract
Different TaqManTM-polymerase chain reaction systems have been developed, which allow the detection of even minute amounts of beef, pork, lamb, goat, chicken, turkey and duck in processed foods. The species-specific systems are able to amplify DNA regions with no more than 108 bp in size (exception: duck, 212 bp) located on the single-copy genes cyclic guanosine monophosphate (cyclic GMP) phosphodiesterase, ryanodine receptor and interleukin-2 precursor. The parallel detection of the common ingredient ‘meat’ produced from mammals and poultry was based on the amplification of a region of the myostatin gene. The limit of detection was determined to be ten genome copies for each system. The relative SD under repeatability condition was below 30%. In addition, a ‘ready-to-use’ reaction plate has been developed, which makes it possible to investigate the presence of the seven animal species in parallel after a single real-time run.
Introduction
According to Commission Directive 2002/86/EC, food ingredients have to be declared. In case of meat, the specification of the animal species has to be disclosed on the label.
In order to enable the authorised food control agencies to supervise compliance with the labelling requirements, suitable detection methods must be available. The polymerase chain reaction (PCR) as DNA analytical method allows the unambiguous identification of animal and plant species in food or feeding stuff. In contrast to protein-based methods, DNA-based ones take advantage of the stability of DNA enabling the investigation of highly processed products. Moreover, the unique specificity and selectivity of PCR affords the analysis of complex matrices (Meyer et al., 1993). In addition, primers as starting points for PCR are – in contrast to antibodies - independent from commercial sources easily accessible to everyone.
In real-time PCR, the exponential amplification of target-specific DNA is measured by the use of fluorescence-labelled specific probes (TaqManTM technology) (Holland et al., 1991). A specific signal is only observed if the species under investigation is present in the matrix. This technique offers significant advantages for routine analysis. Firstly, the real-time PCR happens in a closed tube without post-PCR manipulations, thereby reducing potential PCR products carry-over. Secondly, the assay is less time-consuming because subsequent verification of PCR products is not necessary. Thirdly, a large number of food samples can be analysed in a single run. Finally, the technique holds the potential for developing quantitative assays.
Except one from our laboratory (Laube et al., 2003), there is so far no further publication describing small-sized and single-copy DNA targets for the analysis of meat products. Single copy sequences are the basis for the development of quantitative methods whereas small-sized targets are needed for analyses of species in processed foods. The publication mentioned above describes real-time PCR systems to identify beef and pork as well as a common meat-specific PCR system detecting mammalian and poultry species in foods. Every developed system is based on single-copy targets with approximate 100 bp of size.
The objective of the present study was the establishing of detection methods for beef, pork, lamb, goat, chicken, turkey and duck by real-time PCR using the TaqManTM technology. The selected species are most frequently consumed in Europe.
Materials and methods
DNA from bison, cattle, chicken, duck, elk, fallow deer, goat, goose, hare, hartebeest, horse, kangaroo, lamb, ostrich, pheasant, pig, quail, rabbit, red deer, roe deer, turkey, wild boar, zebra as well as human being, salmon, soya bean and wheat were purchased from CIBUS, Germany, or extracted from commercially available foods.
Home canned food (F = 0.8), normal cans (F = 3.4), cans for use under tropical conditions (F = 12.2) and ultra high heat-treated cans (F = 31) with an amount of at least 0.1% of the respective species were supplied by the Federal Research Centre for Nutrition and Food [Bundesforschungsanstalt für Ernährung und Lebensmittel, BFEL, Karlsruhe, Germany (Table 1)]. The F-value is interpreted as the time required to obtain a given reduction in the number of micro-organisms at a defined temperature. F-value 1.0 indicates a lethality of twelve decimal reductions for Clostridium botulinum, the most dangerous of all toxin-producing organisms, after 1 min at 121.1°C.
Canned Food (w/w), Federal Research Centre for Nutrition and Food, Germany. Content in percentage of the respective species is given for the total weight (product) and for the meat part, respectively
| Sample | Cattle | Pig | Chicken | Turkey | Lamb | Duck | Horse | Other* |
|---|---|---|---|---|---|---|---|---|
| K1 | ||||||||
| % Product | 0.05 | 45.7 | 2.5 | 1.0 | 0.50 | 0.25 | 0 | 50 |
| % Meat | 0.10 | 91.4 | 5.0 | 2.0 | 1.0 | 0.50 | 0 | 0 |
| K2 | ||||||||
| % Product | 0.50 | 0.05 | 0 | 45.7 | 2.5 | 1.0 | 0.25 | 50 |
| % Meat | 1.0 | 0.10 | 0 | 91.4 | 5.0 | 2.0 | 0.50 | 0 |
| K3 | ||||||||
| % Product | 1.0 | 0.25 | 0.05 | 0 | 45.7 | 2.5 | 0.50 | 50 |
| % Meat | 2.0 | 0.50 | 0.10 | 0 | 91.4 | 5.0 | 1.0 | 0 |
| K4 | ||||||||
| % Product | 2.5 | 0.50 | 0.25 | 0.05 | 0 | 45.7 | 1.0 | 50 |
| % Meat | 5.0 | 1.0 | 0.50 | 0.10 | 0 | 91.4 | 2.0 | 0 |
| K5 | ||||||||
| % Product | 0 | 2.5 | 1.0 | 0.5 | 0.25 | 0.05 | 45.7 | 50 |
| % Meat | 0 | 5.0 | 2.0 | 1.0 | 0.50 | 0.10 | 91.4 | 0 |
| K6 | ||||||||
| % Product | 45.7 | 1.0 | 0.50 | 0.25 | 0.05 | 0 | 2.5 | 50 |
| % Meat | 91.4 | 2.0 | 1.0 | 0.50 | 0.10 | 0 | 5.0 | 0 |
| Goat | Kangaroo | Ostrich | Pig | Other** | |
|---|---|---|---|---|---|
| K7 | |||||
| % Product | 0.05 | 0 | 0.25 | 49.7 | 50 |
| % Meat | 0.10 | 0 | 0.50 | 99.4 | 0 |
| Goat | Kangaroo | Ostrich | Pig | Other** | |
|---|---|---|---|---|---|
| K7 | |||||
| % Product | 0.05 | 0 | 0.25 | 49.7 | 50 |
| % Meat | 0.10 | 0 | 0.50 | 99.4 | 0 |
*Vegetable oil, ice, NaCl, pepper, nutmeg, cardamom, cinnamon, phosphate and ascorbate.
**Oats, wheat, barley, rye, pea, soya bean, peanut, celery, vegetable oil, ice, NaCl, pepper, nutmeg, cardamom, cinnamon, phosphate and ascorbate.
Meat and bone meal was provided by ILAT, Berlin, Germany, and Gelatine from DGF STOESS, Eberbach, Germany. DNA from different breeds was obtained commercially: Cattle (Highland, Holstein-Friesian), pig (Bentheimer, Schwäbisch Hällisches), lamb (Cameroon Sheep, German Blackheaded Mutton), goat (German Improved Fawn, German Improved White), chicken (Hamburg, Leghorn), turkey (Black, White) and duck (Peking, Muscovy Duck, Mallard) (CIBUS, Germany).
The samples were minced and homogenised. DNA was extracted using a modified cetyltrimethylammonium bromide (CTAB) method (Laube et al., 2003) based on the procedure published by Tinker (Tinker et al., 1993). The extracted nucleic acid was purified using the QIAquick PCR Purification Kit (QIAGEN, KJ Venlo, The Netherlands) according to manufacturer's instructions.
Candidate genes for TaqManTM PCR were identified either by data base search (Benson et al., 2003 see Results and discussion) or by DNA sequencing using consensus primers in case no sequence entry was available (cyclic guanosine monophosphate (cyclic GMP) phosphodiesterase gene of lamb and goat).
TaqManTM PCR was performed on the Applied Biosystems ABI PRISMTM 7700 Sequence Detection System (SDS, Foster City, CA, USA). The reaction mixture with a total volume of 25 μL contained 1x TaqManTM Buffer A, 0.2 mm of each deoxynucleotide triphosphate (dNTP), 1.5 U AmpliTaq Gold® Polymerase, and 5 μL (25–100 ng) of template DNA solution. Primers, probes and PCR conditions are listed in Tables 2 and 3. Primers were ordered from TIB MOLBIOL (Berlin, Germany), probes from Applied Biosystems. The concentration of primers, corresponding probes and magnesium chloride for the respective system was optimised empirically (Table 4). The resulting high magnesium chloride values might be because of the comparatively low-melting temperatures of the primer. Moreover, the higher concentration of magnesium chloride is needed for the stabilisation of the probe in TaqManTM assays according to Applied Biosystems. An Internal Positive Control (IPC) was developed on the basis of the detection of plasmid pUC19 (New England Biolabs, Ipswich, MA, USA), which permits a reliable identification of false-negative results. For the ‘ready-to-use’ reaction plate, a Master Mix was prepared consisting only of TaqManTM Buffer A, dNTPs, AmpliTaq Gold® Polymerase and water. The company Roboscreen (Leipzig, Germany) was authorised to coat the reaction plates.
Primers and probes used and expected amplicon length
| Primer-probe systems and expected amplicon length | |
| System cattle | |
| Primer forward (bosPDE-f) | 5′-ACT CCT ACC CAT CAT GCA GAT-3′ |
| Primer reverse (bosPDE-r) | 5′-TGT TTT TAA ATA TTT CAG CTA AGA AAA A-3′ |
| Probe (bosPDE-probe) | 5′-(FAM)-AAC ATC AGG ATT TTT GCT GCA TTT GC-(TAMRA)-3′ |
| Amplicon (bosPDE) | 104 bp |
| Primer reverse (bosPDE2-r) | 5′-TTT TTA AAT ATT TCA GCT AAG AAA AAA AG-3′ |
| Amplicon (bosPDE2) | 102 bp |
| System pig | |
| Primer forward (susRY-f) | 5′-CCC CAC CTC AAG TGC CT-3′ |
| Primer reverse (susRY-r) | 5′-CAC AGA CTT TAT TTC TCC ACT GC-3′ |
| Probe (susRY-probe) | 5′-(FAM)-CAC AGC AAG CCC CTT AGC CC-(TAMRA)-3′ |
| Amplicon (susRY) | 108 bp |
| System meat | |
| Primer forward (MY-f) | 5′-TTG TGC AAA TCC TGA GAC TCA T-3′ |
| Primer reverse (MY-r) | 5′-ATA CCA GTG CCT GGG TTC AT-3′ |
| Probe (MY-probe) | 5′-(FAM)-CCC ATG AAA GAC GGT ACA AGG TAT ACT G-(TAMRA)-3′ |
| Primer forward (MYw-f) | 5′-TTG TGC ARA TCC TGA GAC TCA T-3′ |
| Probe (MYw-probe) | 5′-(FAM)-CCC ATG AAA GAC GGT ACA AGR TAT ACT G-(TAMRA)-3′ |
| Amplicon (MY/MYw) | 97 bp |
| System lamb | |
| Primer forward (ovisPDE-f) | 5′-ACC CGT CAA GCA GAC TCT AAC G-3′ |
| Primer reverse (ovisPDE-r) | 5′-TAA ATA TTT CAG CTA AGG AAA AAA AAG AAG-3′ |
| Probe (ovisPDE-probe) | 5′-(FAM)-CAG GAT TTT TGC CGC ATT CGC TT-(TAMRA)-3′ |
| Amplicon (ovisPDE) | 97 bp |
| System goat | |
| Primer forward (capraPDE-f) | 5′-TAC CCA TCA AGC AGA CTC TAG CA-3′ |
| Primer reverse (capraPDE-r) | 5′-ATA TTT CAG CTA AGG AAA AAA AAA GAA G-3′ |
| Probe (capraPDE-probe) | 5′-(FAM)-ATT TTT GTC GCA TTC GCT TCA TCT GT-(TAMRA)-3′ |
| Amplicon (capraPDE) | 96 bp |
| System chicken | |
| Primer forward (galIL-f) | 5′-TGT TAC CTG GGA GAA GTG GTT ACT-3′ |
| Primer reverse (galIL-r) | 5′-TTT TCG ATA TTT TGA ATA GCA GTT ACA A-3′ |
| Probe (galIL-probe) | 5′-(FAM)-TGA AGA AAG AAA CTG AAG ATG ACA CTG AAA TTA AAG-(TAMRA)-3′ |
| Amplicon (galIL) | 95 bp |
| System turkey | |
| Primer forward (melIL-f) | 5′-TGT ATT TCA GTA GCA CTG CTT ATG ACT ACT-3′ |
| Primer reverse (melIL-r) | 5′-TTT ATT AAT GCT GGA AGA ATT TCC AA-3′ |
| Probe (melIL-probe) | 5′-(FAM)-TTA TGG AGC ATC GCT ATC ACC AGA AAA-(TAMRA)-3′ |
| Amplicon (melIL) | 86 bp |
| System duck | |
| Primer forward (anasIL-f) | 5′-GGA GCA CCT CTA TCA GAG AAA GAC A-3′ |
| Primer reverse (anasIL-r) | 5′-GTG TGT AGA GCT CAA GAT CAA TCC C-3′ |
| Probe (anasIL-probe) | 5′-(FAM)-AGG GGA AAA AAG TTA ATT TTT GTG AAC AAA GTT AAT AGA-(TAMRA)-3′ |
| Amplicon (anasIL) | 212 bp |
| System IPC | |
| Primer forward (IPC-f) | 5′-CGT TTC GGT GAT GAC GGT G-3′ |
| Primer reverse (IPC-r) | 5′-CTG ACG GGC TTG TCT GCT C-3′ |
| Probe (IPC-probe) | 5′-(VIC)-TGA CAC ATG CAG CTC CCG GAG AC-(TAMRA)-3′ |
| Amplicon (IPC) | 99 bp |
| Sequencing primers | |
| pGem-f | 5′-CGA ATT GGG CCC GAC GT-3′ |
| pGem-r | 5′-AGG CGG CCG CGA ATT-3′ |
bosPDE, cyclic GMP phosphodiesterase gene of cattle; susRY, ryanodinereceptor gene of pig; MY, myostatin gene of mammals and poultry; ovisPDE, cyclic GMP phosphodiesterase gene of lamb; capraPDE, cyclic GMP phosphodiesterase gene of goat; galIL, interleukin-2precursor gene of chicken; melIL, interleukin-2precursor gene of turkey; anasIL, interleukin-2precursor gene of duck; IPC, Internal Positive Control; pGem, pGem®-TEasy Vector.
Polymerase chain reaction temperature-time-profile
| Process | Time (min:s) | Temperature (°C) |
|---|---|---|
| Initial denaturation | 10:00 | 95 |
| Denaturation | 00:15 | 95 |
| Annealing, extension | 01:00 | 60 |
| Process | Time (min:s) | Temperature (°C) |
|---|---|---|
| Initial denaturation | 10:00 | 95 |
| Denaturation | 00:15 | 95 |
| Annealing, extension | 01:00 | 60 |
Optimum concentration of primers, probes and magnesium chloride (MgCl2) determined by titration
| System | Forward primer (nm) | Reverse primer (nm) | Probe (nm) | MgCl2 (mm) |
|---|---|---|---|---|
| MY | 300 | 300 | 200 | 6 |
| MYw | 300 | 300 | 200 | 6 |
| bosPDE | 300 | 300 | 200 | 9 |
| bosPDE2 | 50 | 300 | 200 | 8 |
| susRY | 300 | 300 | 200 | 2 |
| ovisPDE | 300 | 300 | 200 | 8 |
| capraPDE | 50 | 300 | 200 | 6 |
| galIL | 50 | 300 | 200 | 6 |
| melIL | 50 | 300 | 200 | 8 |
| anasIL | 300 | 300 | 200 | 6 |
| IPC | 50 | 300 | 100 | – |
Amplicons were produced with primer systems encompassing the primer-probe sequences described in Table 2 and were subsequently cloned into pGem®-TEasy Vector using the TA-cloning system (Promega, Madison, WI, USA) according to the manufacturer's instruction (plasmid names are based on the respective primer systems used to generate the inserts: pMYChicken, pMYCattle, pbos, psus, povis, pcapra, pgal, pmel and panas). DNA sequencing using the BigDyeTM Terminator Cycle Sequencing Kit on the ABI PRISMTM 310 Genetic Analyser (both: Applied Biosystems) and the pGem primers listed in Table 2 confirmed the identity of the DNA sequence of the integrated fragments (data not shown). These plasmids were used as positive controls in PCR.
DNA concentrations spectrophotometrically determined were converted into copy numbers (C) on the basis of genome sizes according to Gregory (Gregory, 2005). The term C-value refers to the amount of DNA contained within a haploid nucleus of a eukaryotic organism. In case of diploid organism, the terms C-value and genome size are used interchangeably.
Results and discussion
To date the simultaneous identification of several species in one sample is based on the principle of multiplex PCR usually using consensus primers and specific probes, and subsequent restriction fragment analysis, respectively. However, because of mutual interference between more than one primer pair in one assay, the number of species being investigated in parallel is restricted to approximately five. Moreover, the preferable amplification of targets being predominantly present in the reaction may result in a less efficient PCR concerning those more limited in quantity. To overcome such problems, the identification of seven individual species was tackled by an alternative approach. Single real-time PCR systems have been developed and applied to a ‘ready-to-use’ reaction plate combining in only one assay all detection systems elaborated in this study. This plate is already coated with primers, corresponding probes, positive controls and magnesium chloride. Only one type of Master Mix (TaqManTM Buffer A, dNTPs, AmpliTaq Gold® Polymerase and water) and sample DNA has to be added. Hence, time is saved and throughput enhanced with the persisting potential of separate systems for standardisation and suitability in routine analysis.
The assay is composed of two elements: a general proof of the presence of meat, and secondly the identification of species-specific sequences.
A common meat-specific PCR system has been established detecting mammalian and poultry species on the basis of a region of the myostatin gene (GenBank accession: AF320998 for cattle and AY448007 for chicken) (Laube et al., 2003). To detect beef, lamb and goat, a DNA sequence of the non-coding region of the cyclic GMP phosphodiesterase gene was chosen (GenBank accession: X12756). A DNA sequence in the non-coding region of the ryanodine receptor gene was selected for the detection of pork (GenBank accession: NM_001001534) (Laube et al., 2003). For the detection of chicken, turkey and duck, a region of the interleukin-2precursor gene was chosen (GenBank accession: AJ224516 for chicken, AF209705 for turkey and AY821656 for duck).
The specificity of the primer-probe systems in TaqManTM PCR was studied with DNA from twenty-seven animal or plant species as described in Materials and methods. The plots generated by real-time PCR show the fluorescence representing the increasing target copy number as a function of cycle number.
Ubiquitous occurring myostatin DNA sequence in mammals and poultry
Using the MY primer-probe system (Laube et al., 2003), specific for the myostatin gene of mammals and poultry (Table 2), the DNA of all animal species except salmon as well as human being could be amplified and clearly detected. In addition, the MY primer-probe system was applied to DNA from onion, garlic, paprika and pepper. Neither these spices nor wheat or soya bean exhibited an increase in fluorescence (data not shown). Starting from equivalent DNA copy numbers (1000 DNA copies), different Threshold Cycles (CT) were observed, in particular between mammal and poultry species (data not shown). These divergent efficiencies are because of sequence differences in the primer- and probe-binding region. To solve this problem in the forward primer MYw-f solution, 50% of the primers do have an ‘A’ and 50% a ‘G’ at position eight (written as ‘R’ at the respective primer position in Table 2). In the same way, the probe ‘MY probe’ has been modified at position 21. The optimised system was designated MYw (‘w’ is the letter for ‘wobble’) and resulted in comparable efficiencies for cattle, pig, lamb, goat, chicken and turkey (Fig. 1, Table 5). However, in the binding region of the MYw-f, applied on duck samples, there is still a sequence difference which results in a ΔCT of ca. 1, related to the other species. This result was accepted, because the insertion of further wobble bases could adversely affect the specificity of the MYw system for mammals and poultry. The optimum concentration of primers, probe and magnesium chloride of the MYw system was the same as for the MY system (Table 4).
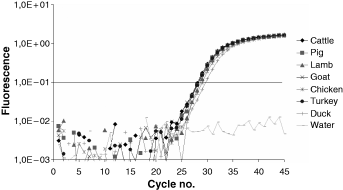
Fluorescence curves for samples of cattle, pig, lamb, goat, chicken, turkey and duck using the MYw primer-probe system. CTs are listed in Table 5.
CT-values measured for each species using the MYw primer-probe system
| Species (1000 DNA copies) | CT |
|---|---|
| Cattle | 29.42 |
| Pig | 29.74 |
| Lamb | 29.78 |
| Goat | 29.64 |
| Chicken | 30.13 |
| Turkey | 29.61 |
| Duck | 31.02 |
| Water | 45.00 |
| Species (1000 DNA copies) | CT |
|---|---|
| Cattle | 29.42 |
| Pig | 29.74 |
| Lamb | 29.78 |
| Goat | 29.64 |
| Chicken | 30.13 |
| Turkey | 29.61 |
| Duck | 31.02 |
| Water | 45.00 |
Species-specific detection
All of the primer-probe systems listed in Table 2 were tested for specificity with the species listed in Materials and methods. No cross reactions occurred using the primer-probe systems specific for pig, lamb, goat, chicken, turkey and duck, whereas the pig-specific susRY primer-probe system is not suitable to distinguish between domestic pig and wild boar. Exemplary graphs of fluorescence curves obtained with species-specific primer-probe systems for pork, lamb, goat, chicken, turkey and duck are shown in Fig. 2.
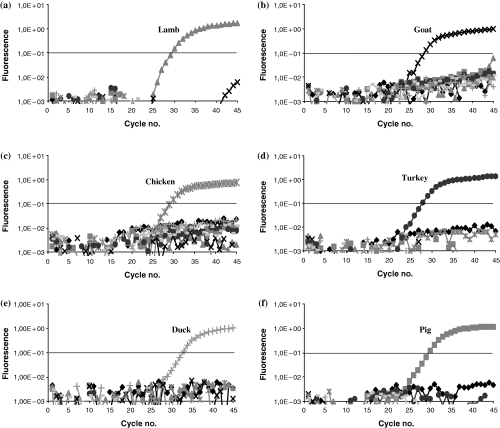
Specificity test. Fluorescence curves for samples of cattle ( ), pig (
 ),lamb (
 ),goat (
 ), chicken (
 ),turkey (
 ) and duck (
 ) including water (
 ) using the (a) ovisPDE, (b) capraPDE, (c) galIL, (d) melIL, (e) anasIL and (f) susRY primer-probe system.
The bosPDE primer-probe system detected DNA from cattle as well as DNA from bison, roe deer, red deer and fallow deer. In order to distinguish cattle from roe deer, red deer and fallow deer, another reverse primer was used recognising an additional base difference (bosPDE2-r in Table 2). The alteration of the reverse primer sequence led to a CT-value shift from around thirty to forty-three when analysing DNA from deer, whereas cattle DNA resulted in a stable CT-value of about twenty-five. A CT-value of forty-three indicates a non-relevant quantity of a food component. A differentiation between cattle and bison was impossible because of identical sequences in the targeted DNA-region. The replacement of beef with bison, however, is not a case of fraud in food production.
The optimum concentrations determined for the bosPDE2 primers and probe are listed in Table 4. Figure 3 shows the fluorescence curves for samples of beef, pork, lamb, goat, chicken, turkey and duck.
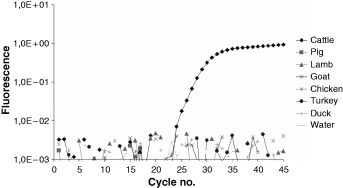
Fluorescence curves for samples of cattle, pig, lamb, goat, chicken, turkey and duck using the bosPDE2 primer-probe system.
To assure that different breeds of the same species result in a positive signal, at least two to three relevant breeds per species were analysed with the respective TaqManTM PCR and by sequencing.
With the exception of duck, the primer- and probe-binding regions of the different breeds matched to the respective animal-specific sequence. The CTs in case of the three duck breeds, starting from the same copy number, varied about 0.5–1.5 CT-units because of sequence differences being identified by sequencing (data not shown). Irrespective of these varying CT-values, in principle all of the studied breeds could be clearly detected using the anasIL primer-probe system.
Sensitivity
In addition to the aspect of specificity, the determination of the limit of detection (LOD), linearity, efficiency and repeatability is an important criteria to assess the suitability and capacity of a detection system. This work was carried out with dilutions series of DNA from the seven animal species. Ten-fold dilution series containing 1–100 genome copies were tested in ten replicates and dilutions in a range from 1000 to 100 000 genome copies in five replicates. An LOD of ten genome copies was determined for each developed system with a probability of 95% to obtain data with CT-values lower than forty-five. Exemplary, the LOD was also determined in a dilution series of a DNA mixture of 1% pig in a background of 99% chicken. The result shows that background DNA, a common realistic situation for composed food, does not decrease the LOD of the respective PCR system. The efficiency of the developed systems is between 88% and 96% according to:
where E denotes efficiency, s denotes slope (log DNA concentration against CT) (Vaerman et al., 2004).
The only exception was duck DNA, amplified by the MYw system with an efficiency of 83%. Most probably, this effect can be attributed to the sequence difference in the binding region of the forward MYw primer in the targeted duck genome sequence. Linearity was given from ten to 100 000 genome copies, except for the bosPDE2 system with 10–10 000 genome copies, and the anasIL system with 100–100 000 genome copies. The repeatability was determined by measuring duplicates of 100, 1000 and 10 000 genome copies on three different days. The results showed a relative SD of up to 30% (data not shown).
When using equal copy numbers of plasmid and genomic DNA, CT-values do not differ significantly. Similar results were obtained when analysing genomic DNA with few copy numbers but high background of non-specific DNA (data not shown).
Selectivity
The selectivity of the developed systems was examined using canned food containing varying shares of the seven species. At the same time, different degrees of processing were included in this study (materials and methods, Table 1). The respective animal species were clearly identified even in ultra high heat-treated cans down to amounts as low as 0.1% of the respective species. A significant rise in fluorescence was also measured in gelatine and meat and bone meal containing cattle and pig after three- to tenfold pooling of CTAB extracted DNA (data not shown).
Controls
False-negative results because of an inhibition of DNA polymerase can be excluded by using an amplification control. On these terms, the MYw system can be regarded as an external amplification control. Even in case that the targeted species is not detected, the amplification control should result in a positive signal in PCR. An internal amplification control (IPC), however, gives an advantage over a separate amplification control, because both, species-specific detection and control, are performed in parallel in the same tube. In this approach, the plasmid pUC19 (New England Biolabs) was used as an IPC. In order to detect the IPC and the species-specific target in one reaction, primer-probe systems have been developed (Table 2) with differently labelled fluorescence probes (reporter dye VIC for the IPC and FAM for the species-specific target). The concentration used for the IPC primers and probe is listed in Table 4. The IPC fragment length is 99 bp. A constant amount of 1000 copies of the plasmid was added to tenfold dilution series of DNA extracts of the different animal species resulting in a constant CT-value of around twenty-nine. Based on a series of repetitions, a CT-value shift of more than two comparing IPC added to the extracted sample DNA and IPC added to the water control (without extracted sample DNA) indicates an inhibition (data not shown).
‘Ready-to-use’ reaction plate
The design of the ‘ready-to-use’ 96-well reaction plate concluded the study. Primer-probe systems, magnesium chloride and the respective controls were fixed on the plate by lyophilisation. The assay consists of four types of controls: positive, ‘cut off’, extraction control (water treated like sample) and the IPC system.
The reliability of the performance can be checked by adding positive and ‘cut off’ controls made either from meat DNA or from plasmid DNA containing the respective target sequence. Plasmid DNA was chosen for this assay because it can be easily reproduced with the same quality, as often as necessary. The positive control aims as an amplification control to demonstrate the functionality of the primer-probe system. The ‘cut off’ control contains a low copy number of target DNA close to the LOD of the primer-probe systems (Table 6).
Copy numbers (C) of the ‘cut off’ and positive control (PC) for plasmid DNA in pre-coated stripes limit of detection (LOD) and CT-values were the assessment criteria for the ‘cut off’ copy numbers, linearity and CT-values for the PC copy numbers
| Plasmid | LOD (C) | Linearity (C) | cut off (C)* | PC (C)† |
|---|---|---|---|---|
| pMYchicken | 5 | 25–100 000 | 10 | 10 000 |
| pMYcattle | 5 | 25–100 000 | 10 | 10 000 |
| pMYchicken/cattle | 5 | 25–100 000 | 10 | 10 000 |
| pbos | 5 | 10–100 000 | 10 | 10 000 |
| psus | 5 | 10–100 000 | 50 | 10 000 |
| povis | 5 | 10–100 000 | 10 | 10 000 |
| pcapra | 5 | 25–100 000 | 10 | 10 000 |
| pgal | 10 | 25–100 000 | 50 | 10 000 |
| pmel | 5 | 10–100 000 | 10 | 10 000 |
| panas | 10 | 10–100 000 | 50 | 10 000 |
*CT-value between thirty-six and forty.
†CT-value lower than 33.
The optimum copy number for the positive controls and the ‘cut off’ controls was evaluated by ready-made strips, additionally pre-coated with plasmid DNA in different quantities and three replicates (Table 6). These ‘cut off’ controls should always result in a PCR product and can be used for quality assurance in order to check the functionality of the PCR system.
Based on the different levels of controls (IPC, positive control, ‘cut-off’ control and extraction control), the whole system guarantees a high grade of reliability and robustness. The use of plasmid DNA is an innovative tool avoiding problems related to DNA isolated from species of different origin.
To demonstrate the efficiency and reliability of the developed ready-to-use’ 96-well reaction plate’, different DNA samples as well as a meat mixture were analysed in triplicates. The results are shown in Fig. 4.
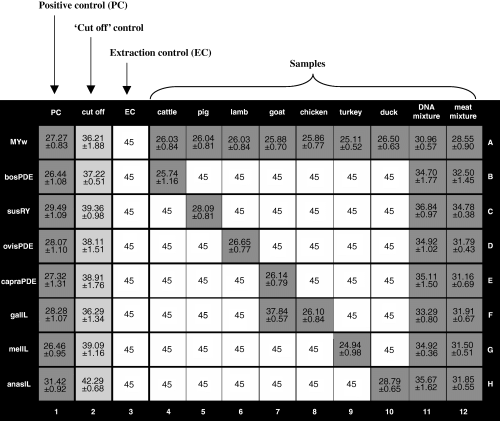
Results of real-time polymerase chain reaction (PCR) expressed as CTs including SD using the ‘ready-to-use’ 96-well reaction plate. DNA quantity per well of column 4–10: 5000 C. Composition of DNA mixture (column 11): 10 C cattle, 50 C pig, 10 C lamb, 10 C goat, 50 C chicken, 10 C turkey, 50 C duck. The meat mixture (column 12) consists in equal parts (w/w) of cattle, pig, lamb, goat, chicken, turkey and duck. Primer-probe systems were used according to Table 2. Positive signals in PCR are highlighted in grey. All values highlighted in light grey are representing the ‘cut-off’CT-value of the respective system.
In each sample, the presence of the respective animal species could be detected. Using the galIL primer-probe system, the sample from goat (well F7, Fig. 4) exhibited an increase in fluorescence. Because in the course of specificity testing no cross reaction was observed with goat, this signal might be the result of contamination during pre-coating of the 96-well reaction plate. The elevated CT-value of ‘cut off’ control ‘panas’ (well H2, Fig. 4) might also be because of irregularity in pre-coating. There was no contamination during extraction and PCR regarding the extraction control. According to the quality of IPC, an inhibition could be excluded (data not shown). Plasmids fixed on the plate resulted in slightly higher CT-values in comparison with plasmids in solution. This could be explained by the effect that not all DNA bound to the surface of the microtitre plate is available after solubilisation. Therefore, lower numbers of targets are present for PCR.
Conclusions
Seven TaqManTM assays have been developed, which can be used to distinguish between cattle, pig, lamb, goat, chicken, turkey and duck from a total of twenty-three food-relevant animal species. The response was linear over at least four decades of genome copies and the assays were able to detect as little as 0.1% of the respective animal species corresponding to ten genome copies. To exclude false-negative results, an external amplification control (MYw system) and an IPC have been established.
Moreover, a ‘ready-to-use’ 96-well reaction plate has been developed, which meets all requirements for quick, reproducible and efficient routine analysis. As all primer-probe systems, including controls and magnesium chloride, are pre-coated on the plate, only one Master Mix has to be prepared. Furthermore, the use of a multipette reduces time and labour. The user is in the position to modify the format of the ‘ready-to-use’ 96-well reaction plate. It is possible to use single tubes as positive controls or stripes consisting of eight wells suitable for the detection of only one animal species.
The main field of application of the ‘ready-to-use’ 96-well reaction plate is the qualitative analysis. Nevertheless, all developed primer-probe systems are targeting single-copy genes. This is the basis for developing methods, which can determine the amount of a species in relation to the total meat content. The relative quantitation requires the set-up of standard curves. For this purpose, the plasmid DNA developed in the frame of the study is well suited to establish the standard curves.
Recent developments in food control have clearly indicated that PCR is a valuable tool. Nationally as well as internationally accepted PCR-based methods are widely applied in food control, e.g. to determine the amount of genetically modified organisms (GMO) or material derived thereof in food and feeding stuff. In particular, the potential for standardisation of PCR-based methods is an advantage.
At the moment, a validation study with a ‘ready-to-use’ 96-well reaction plate is under way.
