


ABSTRACT
Microbial biofilms are an important element of gravity-driven membrane (GDM) filtration systems for decentralized drinking water production. Mature biofilms fed with biomass from the toxic cyanobacterium Microcystis aeruginosa efficiently remove the cyanotoxin microcystin (MC). MC degradation can be ‘primed’ by prior addition of biomass from a non-toxic M. aeruginosa strain. Increased proportions of bacteria with an anaerobic metabolism in M. aeruginosa-fed biofilms suggest that this ‘priming’ could be due to higher productivity and the resulting changes in habitat conditions. We, therefore, investigated GDM systems amended with the biomass of toxic (WT) or non-toxic (MUT) M. aeruginosa strains, of diatoms (DT), or with starch solution (ST). After 25 days, these treatments were changed to receiving toxic cyanobacterial biomass. MC degradation established significantly more rapidly in MUT and ST than in DT. Oxygen measurements suggested that this was due to oxygen-limited conditions in MUT and ST already prevailing before addition of MC-containing biomass. Moreover, the microbial communities in the initial ST biofilms featured high proportions of facultative anaerobic taxa, whereas aerobes dominated in DT biofilms. Thus, the ‘priming’ of MC degradation in mature GDM biofilms seems to be related to the prior establishment of oxygen-limited conditions mediated by higher productivity.
INTRODUCTION
Over the past two centuries, cyanobacterial abundances in coastal and inland waters have disproportionally increased compared to other phytoplankton groups (Taranu et al. 2015). As a consequence, aquatic systems are threatened by harmful cyanobacterial blooms (HABs) of species that produce toxic secondary metabolites such as microcystins (MCs) (Harke et al. 2016; Huisman et al. 2018). A number of studies have identified eutrophication, rising CO2 levels and climate warming as major triggers for the rise and persistence of HABs (Verspagen et al. 2014; Visser et al. 2016; Shi et al. 2017; Ullah et al. 2018). HABs have severe consequences for the local ecosystem and pose a threat to water quality, e.g. for drinking water production, fishing and recreational use (Verspagen et al. 2014; Kurobe et al. 2018).
MCs are rather persistent in the environment due to their chemical stability, and biological degradation by microbes represents a major removal process (Dawson 1998; Li, Li and Li 2017). Numerous MC-degrading bacterial strains have been isolated from different aquatic habitats, e.g. those affiliated with the genera Sphingomonas sp., Novosphingobium sp., Aeromonas sp. and Rhodococcus sp. (Amé et al. 2006; Manage et al. 2009; Jiang et al. 2011; Mankiewicz-Boczek et al. 2015). So far, one pathway for aerobic MC degradation, the mlr gene cluster, has been elucidated, indicating that biodegradation in the aerated water column plays a role in MC removal (Bourne et al. 1996, 2001; Ho et al. 2007). However, MC degradation has been demonstrated in the water column even in the absence of genes from this cluster (Manage et al. 2009; Mankiewicz-Boczek et al. 2015; Bukowska, Kalinski and Chróst 2018). Therefore, other, detoxification-related enzyme systems, in particular glutathione S-transferase and alkaline proteases, have been suggested as alternative candidates for MC degradation (Takenaka and Watanabe 1997; Mou et al. 2013).
Free-living bacteria in aerobic habitats are probably not the only important MC degraders. The process also occurs in lake sediments, likely under anoxic conditions (Holst et al. 2003; Chen et al. 2010), and the bulk of MC degradation in aquatic systems might in fact take place in or on top of the sediments (Chen et al. 2008). MC degradation has been also reported by biofilm communities on membrane filters (Babica, Bláha and Maršálek 2005; Kohler et al. 2014; Silva et al. 2018, 2019). Such mixed-species biofilms are heterogeneous environments with steep chemical gradients, e.g. of oxygen or substrates (Sternberg et al. 1999; Stewart and Franklin 2008; von Ohle et al. 2010), and transport processes are often characterized by strong diffusion limitation (de Beer, Stoodley and Lewandowski 1997; Stewart 2003).
Gravity-driven membrane (GDM) filtration systems are an emerging solution for decentralized drinking water production in developing countries (Pronk et al. 2019). The microbial biofilms that grow on these filtration membranes cause flux reduction, but they also enhance permeate water quality by reducing the concentration of assimilable organic carbon (Derlon et al. 2014). Moreover, mature GDM biofilms can effectively remove high daily doses of MC (Silva et al. 2018, 2019), suggesting that GDM systems might be a powerful tool for the small-scale production of drinking water also from sources that regularly experience HABs.
Interestingly, GDM biofilms that develop upon addition of non-MC-containing cyanobacterial biomass exhibit a ‘cryptic’ potential for rapid MC degradation when the toxin-containing biomass is eventually supplied (Silva et al. 2018, 2019). It remains unclear which are the main triggers for this ‘cryptic’ MC degradation potential. On the one hand, it is possible that (facultative) MC degraders were present in these biofilms because the added biomass was very similar in both cases, i.e. a non-toxic vs. a toxic strain of Microcystis aeruginosa. This similarity might e.g. encompass the suite of other secondary metabolites produced by both strains, such as cyanopeptolins or aeruginosins (Dittmann et al. 1997). It has been shown that specific carbon sources may select for particular bacterial communities in aquatic systems (Cottrell and Kirchman 2000). On the other hand, it is also conceivable that MC degraders might always be members of highly productive GDM biofilm communities irrespective of the composition of the added carbon source. During bioremediation, it is commonly observed that high productivity will lead to a better degradation of xenobiotica (Teng et al. 2010). Higher rates of organic matter mineralization have been observed in marine sediments upon addition of algal organic matter (van Nugteren et al. 2009), and the addition of compost to sediments had a positive effect on the degradation activity of prokaryotes even in a highly eutrophic lagoon (D'Errico et al. 2013).
Deciding between these alternative hypotheses may be important for the operation of GDM systems in a way that maximizes MC degradation during HABs. Specifically, it would be desirable if MC removal could also be ‘primed’ by previous blooms of other algae or by prior addition of a simple carbon source. We, therefore, designed a setup to test whether the ‘priming’ effect of MC degradation in GDM biofilms (Silva et al. 2018, 2019) is a result of supplementation with a particular type of carbon source, or if it is primarily related to the total amount of added carbon irrespective of its composition. For this purpose, the MC degradation rate during a simulated HAB was compared in mature biofilms that had previously been supplemented with different types of carbon sources.
MATERIALS AND METHODS
Cultivation of algae and preparation of the starch solution
Microcystis aeruginosa PCC 7806 (wild-type) and a non-MC producing mutant strain (Dittmann et al. 1997) were grown axenically in cyanobacterial medium as previously described (Silva et al. 2018). The wild-type strain produces two MC variants, MC-LR and [D-Asp3] MC-LR. Fragilaria sp. was grown in a common diatom medium (Anderson et al. 2005). All three strains were maintained at 20°C, under constant light intensity of 3.5 μmol quanta m−2 s−1. Several flasks were inoculated with each strain to produce material for the experiments. Biomass was harvested from dense cultures and concentrated by lyophilization. The total and dissolved organic carbon (TOC and DOC) content of each biomass was quantified (Shimadzu, Japan). The biomass was then re-suspended in artificial lake water (ALW) (Zotina, Köster and Jüttner 2003), and adjusted to an equivalent TOC concentration of 2 mg C L−1 for all variants and distributed into small tubes. Three cycles of freeze-thawing were subsequently performed to lyse the cells of cyanobacterial and diatom biomass prior to use. The MC concentration from the wild-type strain was quantified via HPLC-MS, which was also used to confirm the absence of toxin in the mutant strain.
Starch (Sigma Aldrich, Steinheim, Germany) was dissolved in ALW to a final TOC concentration of 2 mg C L−1. Starch was used instead of glucose to reduce the passage through the membrane, assuming a higher retention due to the higher molecular weight. NH4Cl and K2HPO4 were used to supplement the starch solution according to the Redfield ratio (C:N:P = 106:16:1). The solution was then sterilized (121°C, 20 min) and stored at 4°C until further use.
Experimental setup
A GDM filtration system was used as an experimental setup to investigate the potential of mature biofilms for MC degradation. The system was fed with water from Lake Zurich (from 5 m water depth), an oligomesotrophic lake with seasonally high abundances of the MC-producing cyanobacterium Planktothrix rubescens (Posch et al. 2012). During the experimental period (October–November 2017), the abundances of P. rubescens in the epilimnion of the lake increased, from 4 to 10 µg L−1 (chlorophyll-a). The background concentrations of dissolved organic carbon in the lake were on average 1.33 mg L−1.
The GDM system was assembled as previously described by Silva et al. (2018) (Figure S1, Supporting Information). Lake water from 5 m depth was pumped into a series of three sedimentation tanks and flowed into the feed tank. The water level in the tanks was kept constant by overflow in the feed tank. The 40 L feed tank was directly connected to 21 biofouling monitors, and in between a connection for biomass addition was placed. All the biofouling monitors were equipped with an ultrafiltration membrane (150 kDa nominal cutoff, polyethersulfone membrane, Microdyn Nadir, Wiesbaden, Germany), which was previously sterilized as described in Heffernan et al. (2013). Each biofouling monitor was directly connected to a sterile permeate collection bottle. The transmembrane pressure was kept at 65 mbar. The experimental operation was under room-temperature conditions and the whole system, except for the permeate collection bottles, was kept in the dark.
The experimental setup consisted of five different treatment types: one treatment only received raw lake water (CTRL), while all other treatments were supplied with daily doses of various substrates. The wild-type (WT) treatment received biomass from the cyanobacterium Microcystis sp., corresponding to a daily dose of 40 µg of MC day−1. The mutant (MUT) treatment was amended with MC-free biomass from a mutant Microcystis strain, the diatom (DT) treatment was amended with biomass of Fragilaria sp., and the ST treatment was supplied with pure starch and inorganic nitrogen and phosphorus. The WT, MUT and CTRL treatments had three biological replicates each, while there were six replicates for the DT and ST treatments.
The four substrate-amended treatments (WT, MUT, DT and ST) were supplemented with an equivalent amount of TOC of 2 mg C L−1 day−1. However, the treatments received different doses of dissolved organic carbon: while 100% of the carbon was in its dissolved form in the starch solution, DOC from the MC-containing and MC-free biomass was 62% and 68% of TOC, respectively. DOC from the diatom biomass only represented 12% of TOC. All treatments were continuously fed with lake water except for the periods of substrate delivery. The WT, MUT and DT treatments were supplied with the respective biomass (2 mg C L−1 day−1) once a day. By contrast, the starch solution (2 mg C L−1 day−1) was delivered in pulses of 5 sec every 10 min by a six-way peristaltic pump (MCP V5.21, Ismatec, Wertheim, Germany) to avoid the rapid passage of dissolved starch and nutrients through the GDM membranes. The sterile starch stock solution was continuously stirred; it was added at the entrance point of the biofouling monitors to avoid premature consumption in the feed line. A drop feed was used to preclude back contamination. The stock solution was replaced every two to three days to correct its concentration according to the flux decline, i.e. in order to maintain the daily dose of 2 mg C L−1 day−1.
When the WT treatment had achieved complete MC removal (i.e. no more MC detectable in the filtrates), it was discontinued on day 25. Three replicates of the DT and ST treatments were also stopped at this time point in order to compare their microbial community composition with that of the WT. Since the comparison of the CTRL and MUT treatments with WT has been the focus of a previous investigation (Silva et al. 2018), we did not collect day 25 samples from these treatments, but re-analyzed our previous data instead. The experimental conditions for the remaining DT and ST replicates as well as for the CTRL and MUT treatments were then changed to a single type, i.e. the addition of MC-containing biomass (40 µg day−1 of MC). The experiment was continued at these conditions until day 44. The DT and ST treatments from the two time points are denominated as DT25/ST25 and DT44/ST44, respectively.
Daily monitoring of oxygen concentrations, flux and MC in the permeate
The oxygen consumption on top of the biofilm was monitored daily. For that, an in-line optical sensor (O2 flow-through cell FTC-PSt3, PreSens Precision Sensing GmbH, Regensburg, Germany) was assembled for one replicate of each treatment. The O2 sensors were placed on the opposite side of the biofouling monitor influx (Figure S2, Supporting Information). After the addition of biomass, a clamp downstream of the O2 sensor was carefully opened until the influx water was in contact with the O2 sensor and then closed again. Subsequently, the O2 concentration was measured in intervals of 2 min until a steady state was approached. When the measurements were completed for a particular day a second clamp was closed to block the tubing between the O2 sensor and the biofouling monitor. The O2 sensor line was emptied and cleaned, and the setup would remain closed until the next set of measurements. O2 concentrations were also determined daily in the feed water using an in-line O2 sensor placed at the outflow of the feed tank. All O2 measurements were analyzed with the software 'data manager' (version 2.0.0.57, PreSens Precision Sensing GmbH, Regensburg, Germany).
The permeate collection bottles were exchanged daily to determine the volume of filtrate and MC concentrations. The permeate flux was calculated considering the area of the membrane (19.95 cm2) and the daily volume of water. MC removal was calculated as the difference between the amount of supplied MC and the total MC in the permeate 24 h later. MC quantification was performed in an HPLC-MS (1260 Infinity series system Agilent Technologies and API 500 triple quadrupole mass spectrometry system AB Sciex) equipment as previously described in Silva et al. (2018).
DNA extraction, 16S rRNA gene sequence and processing
Before DNA extraction, the WT biofilms were split into three equally sized vertical sections, designated front, middle and back according to their position with respect to the influx of the GDM system. This division was made in order to assess horizontal gradients of bacterial community composition across the biofilm. DNA was extracted from all the biofilms and from the individual sections of the WT biofilms using the DNeasy Power Biofilm Kit (Qiagen, Hilden, Germany). The extraction was performed according to the manufacturer's specifications, except for the inhibitors removal step that was extended to 1 h. The purified DNA was stored at–20°C in 10 mM Tris buffer for further analysis.
Partial 16S rRNA sequences were obtained by Illumina MiSeq (V3 subunit, 2 × 300 bp, LCG Genomics, Berlin, Germany). Amplification was done with the primer pair 799F–1115R, which excluded chloroplasts amplification (Chelius and Triplett 2001; Redford et al. 2010), and the reverse primer was modified according to Silva et al. (2018). The raw data processing, operational taxonomic unit (OTU) and the taxonomic assignment of OTUs according to the SILVA taxonomy (version 128), were performed by an in-house pipeline as described previously (Silva et al. 2018).
Data processing and statistical analyses
The original sequence dataset included 27 samples (comprising all the treatment replicates, i.e. MUT (3), CTRL (3), DT (6) and ST (6), and the additional 3 vertical sections of each WT replicate), 3928 OTUs and 1 288 101 reads. The normalization was performed to the lowest number of reads per samples (15 245 reads), as previously described (Silva et al. 2018). The normalized dataset with the 27 samples, comprised 1834 OTUs and 411 615 reads. In order to properly compare the treatments, a second dataset was created: the average read number for each individual OTU of the 3 WT sections was calculated, resulting in a dataset with 21 samples. The normalization procedure was also applied to the dataset with 21 samples, resulting in a total of 1824 OTUs and 320 145 reads.
OTUs were classified into genotypes with aerobic or anaerobic (facultative or strict) metabolism according to published data. In total, >40% of all OTUs representing 89% of the total reads could be assigned to one category. In addition, we also classified OTUs from a previous GDM experiment (Silva et al. 2018) that included the treatments WT, MUT and CTRL and that was terminated at a stage corresponding to the day 25 samples (i.e. 100% of MC degradation in the WT). In that experiment, 46% of OTUs and 80% of reads could be categorized.
Statistical analyses were performed in R (version 3.3.2) (R Core Team 2019). The normalized samples were average-linkage clustered based on Bray–Curtis dissimilarity. Similarity profile analyses were used to identify significantly different (α = 0.001) clusters (Whitaker and Christman 2014) and cluster-wise stability assessment confirmed the stability of the main branches (Hennig 2019). The community diversity of DT and ST treatments was visualized by scaled Venn diagrams with the R package VennDiagram (Chen and Boutros 2011). For statistical testing, all proportional data were first logit transformed to approximate normalcy (Warton and Hui 2011). Significant differences between datasets were then either assessed by Student's t-tests, or by ANOVAs followed by Tukey's honestly significant difference (HSD) tests.
RESULTS
Permeate flux
The initial average flux (24 h after the first addition of biomass or starch) was ∼3 times lower in the WT and MUT treatments compared to the DT, ST and CTRL treatments (Fig. 1A). After 10 days of operation, the permeate flux stabilized in the WT and MUT treatments at 1.3 L m−2 h−1 ± 0.1, and at 3.1 L m−2 h−1 ± 0.9 in the ST treatment. In the CTRL and DT treatments, the flux only stabilized after 15 days of operation at 8.7 L m−2 h−1 ± 0.4 and 7 L m−2 h−1 ± 1, respectively. No change of permeate flux was observed in the MUT treatment after the addition of MC-containing cyanobacterial biomass on day 26. In the ST44 treatment, only a small decline was observed as a consequence of this experimental manipulation and the flux stabilized at 1 L m−2 h−1 ± 0.3 after 2 days. By contrast, a pronounced decline was observed in the CTRL and DT44 treatments after changing the conditions. The flux only stabilized 5 days later, at 1.3 L m−2 h−1 ± 0.4 and at 1.1 L m−2 h−1 ± 0.3 for the CTRL and DT, respectively. At day 44, the permeate flux of MUT, CTRL, DT44 and ST44 treatments was approximately the same, at 0.7 L m−2 h−1 ± 0.2.
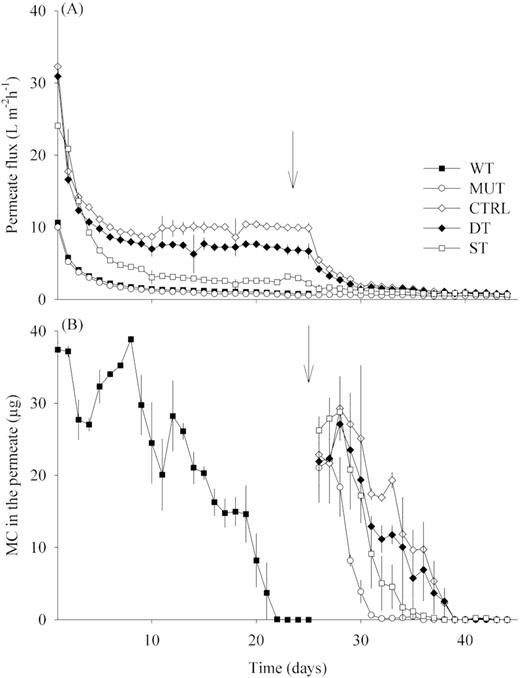
(A) Average permeate flux for all treatments during the 44 days of experimental operation (average ± SD, n = 6/3). (B) Amount of MC in the permeate 24 h after the addition of cyanobacterial biomass containing 40 µg of MC (average ± SD, n = 3). The arrows indicate the day 25, when all treatments started to be supplied with MC-containing biomass only. Treatments – WT: biomass of M. aeruginosa wild type; MUT: biomass of M. aeruginosa non-MC producing mutant; CTRL: no addition; DT: diatom biomass; ST: starch solution.
MC removal
The total amount of MC in the permeates was chosen for comparisons rather than MC concentration because it is independent of the flux variation over time and across treatments (Fig. 1B). During the first 10 days of GDM operation, the MC removal efficiency in the WT treatment was on average 18%. Subsequently, the amount of MC in the permeate steeply declined and reached the detection limit (0.5 µg L−1) at day 22, reflecting the complete removal of the daily dose of MC by the biofilm community. From day 25 onward, all remaining treatments were also supplied with MC-containing biomass. The most rapid decrease of MC in the permeate water was observed in the MUT treatment, where no more toxin was detectable already 6 days later. In the ST treatment, no more MC was present in the permeate 10 days after it was first supplied with toxic biomass, whereas complete MC removal in the CTRL and DT treatments only occurred after a period of 14 days. The slope of MC decrease in the permeate water over time was significantly steeper in the MUT treatment than in any of the other treatments, including the WT treatment. The identical overall trend was observed if MC removal was assessed based on units of concentrations rather than on the total amount (data not shown).
Oxygen consumption in GDM biofilms
Daily O2 measurements were taken after the addition of the respective biomass or substrate to each treatment, until a steady state was reached. For the ST treatment, the O2 measurement was taken at the same time as in the other treatments, since in this treatment the addition of starch was continuous. Due to our measurement setup, oxygen saturation at time point zero likely also reflected the residual oxygen introduced by the manipulation and were, therefore, excluded from rate measurements.
From day 14 until day 24 (phase 1), the WT and MUT treatments had an average O2 saturation <20% (<2 mg L−1 O2) after 10 min of continuous measurements (Fig. 2A), whereas it was between 27 and 63% (5 and 2 mg L−1) in the other treatments. From day 30 until the end of the experiment (phase 2), all the four remaining treatments (MUT, CTRL, DT and ST) had O2 saturation below 15% (Fig. 2B) after 10 min of monitoring. During phase 1, the oxygen consumption rates of MUT were significant different from all other treatments (ANOVA, P < 0.001), and the WT rates were also significant different from those of the CTRL (ANOVA, P < 0.05) (Fig. 2A). During the second experimental phase, there were no significant differences in the oxygen consumption rates across the treatments (Fig. 2B). The O2 saturation in the feed water was on average 87% ± 0.5 (SE) (7.8 mg L−1 O2). Measurements at steady state conditions of O2 concentration showed a significant decrease in the CTRL and DT treatments before and after day 25 (Fig. 2C).
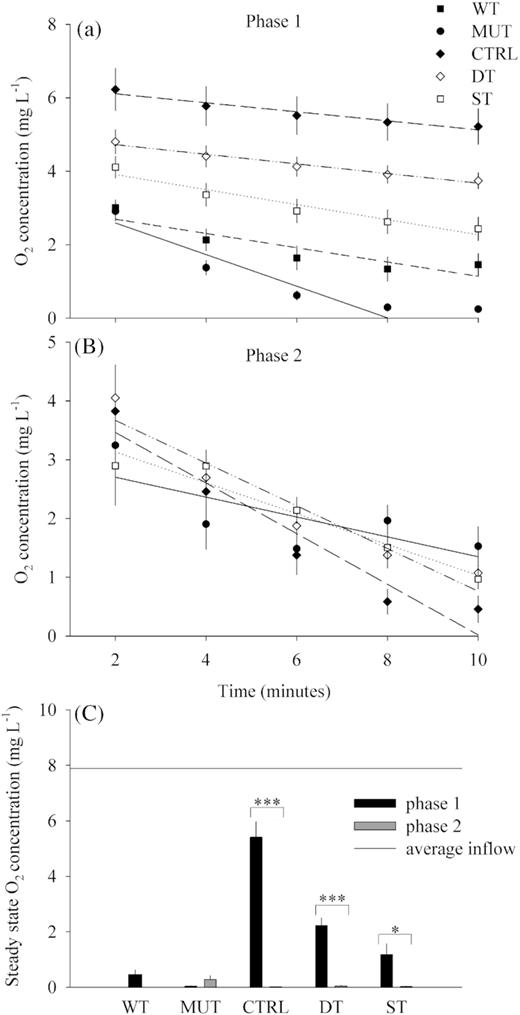
Oxygen saturation on top of the GDM biofilms during the first 10 min after addition of the respective biomass: (A) From day 14 until day 24 (average ± SE, n = 9) and (B) from day 30 until day 43 (average ± SE, n = 8). (C) Oxygen concentration for the steady state of all GDM treatments during the whole experimental operation (average ± SE, n = 8). Only significant differences are highlighted (***P < 0.001, *P < 0.05).
Microbial community composition
The complete dataset comprised 1824 OTUs and 320 145 reads. One hundred and forty OTUs (8%) representing 77% of all reads were shared between all seven treatments (WT, MUT, CTRL, DT25, DT44, ST25 and ST44). Only six OTUs were present in all treatments that received MC-containing biomass (WT, MUT, CTRL, DT44 and ST44) and they represented <1% of the reads. OTUs that were present exclusively in one treatment only represented between 0.03 and 0.5% of the total amount of reads. The OTUs shared between any two treatments always represented >90% of the reads of these two treatments.
Proteobacteria dominated all treatments, representing more than half of both, OTUs and total reads (Figure S3, Supporting Information). The ST25 treatment significantly differed from the WT and MUT treatments in the proportions of 7 or 8, respectively, of the 10 phylogenetic lineages depicted in Figure S3 (Supporting Information) (ANOVA, P < 0.05; Figure S3 and Table S1, Supporting Information). By contrast, the only difference between the ST44 and the WT and MUT treatments was a significantly higher proportion of reads affiliated with the Gammaproteobacteria (ANOVA, P < 0.001; Table S1, Supporting Information). The most diverse communities were present in the DT treatments, varying between 1221 and 1030 OTUs in DT25 and DT44, respectively (Fig. 3A). The CTRL and MUT treatments had intermediate levels of diversity of 839 and 620 OTUs, respectively, followed by ST44 (536 OTUs) and WT (494 OTUs). Significantly (ANOVA, P < 0.05) lower diversity was found in ST25, which harbored less than one-fifth of the OTU numbers (239) of the most diverse treatment type. The communities of the DT and ST treatments responded differently to the addition of MC-containing cyanobacterial biomass in terms of diversity (day 25 vs. day 44). While a significant (Student's t-test, P < 0.05) decrease in diversity (by 15% or 191 OTUs) was observed in DT, the ST biofilms exhibited a significant (Student's t-test, P < 0.01) increase (by 55% or 297 OTUs) after the addition of biomass (day 44) (Fig. 3).
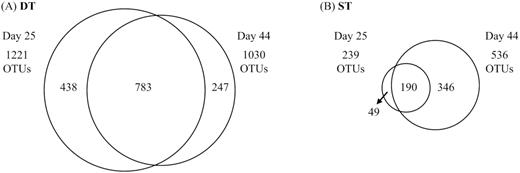
Scaled Venn diagrams depicting the diversity in biofilm communities of treatments DT (A) and ST (B) on day 25 and day 44, and of the fraction of common OTUs between the two time points.
The average linkage cluster of Bray–Curtis dissimilarities showed a significant distinction between the WT, MUT and ST treatments on the one hand and the CTRL and DT treatments on the other hand (Fig. 4). This suggests that bacteria introduced with the biomass from the non-axenic diatom cultures did not substantially affect microbial community composition in the DT treatment. A cluster-wise stability assessment revealed high stability of these two main branches. The individual biological replicates of the WT and MUT treatments were not significantly different from each other. The ST25 and ST44 treatments were more similar to each other than to any other treatment and all samples from this treatment were significantly separated from the WT/MUT branch. All biological replicates of the CTRL treatment together formed a single branch that was well separated from a branch comprising five out of six of the DT samples. Within this DT-specific cluster, there was a significant separation between the samples from day 25 and 44.

Average linkage clustering of all GDM samples according to Bray–Curtis dissimilarities. The stability of the two main branches were tested according to their cluster-wise stability. Similarity profile analyses identified six significantly different clusters (solid line). Samples with a gray background are from day 25.
Responders to MC-containing biomass addition
We operationally defined genotypes as ‘biomass responders’ if they (i) were absent or occurred in very low read numbers (<100 reads) in DT25 and increased considerably (by a factor ≥10 times) in DT44, and if they (ii) maintained or increased their abundances between the ST25 and ST44 treatments. Arguably, the potential MC degraders in the GDM biofilm communities might be among genotypes that fulfil these criteria.
Among the 1824 OTUs present in the GDM biofilms, only 15 OTUs were considered to be biomass responders according to the above definition (Table 1). Thirteen of these OTUs increased in read numbers by >5 times between the two experimental phases in the DT treatments and were also common (>10 reads per treatment) in the ST treatments. The two remaining OTUs were absent in DT25 but were found in DT44, and also significantly increased in read numbers (by a factor >10) between ST25 and ST44. The 15 OTUs were also present (>10 reads) in all other treatments.
OTUs that were either absent in DT on day 25 but found on day 44 or that increased in read numbers by >10-fold in DT between days 25 and 44. Only those OTUs are listed that also had >10 reads in all other treatments. Reads are given as percentage of total reads in all treatments. ND: not detected in DT on day 25.
| Proportion of reads (% of reads in all treatments) | Affiliation | Accession number (sequence identity) | ||||||
|---|---|---|---|---|---|---|---|---|
| WT day 25 | MUT day 25 | CTRL day 44 | ST day 25 | ST day 44 | DT day 25 | DT day 44 | ||
| 0.2 | 0.1 | 0.5 | 4.5 | 2.5 | 0.005 | 0.2 | Aeromonas sp. 1 | FPLP01007781 (100%) |
| 0.3 | 0.1 | 0.1 | 5.0 | 0.7 | 0.01 | 0.1 | Aeromonas sp. 2 | JF497835 (100%) |
| 0.4 | 0.8 | 0.02 | 0.9 | 1.9 | <0.005 | 0.01 | Acetobacteroides 1 | JX828413 (100%) |
| 0.1 | 0.04 | 0.02 | <0.005 | 0.01 | <0.005 | 0.01 | Acetobacteroides 2 | JN873216 (98.9%) |
| 0.4 | 0.4 | 1.1 | 0.1 | 0.2 | 0.01 | 0.4 | Acidaminobacter sp. 1 | JX262570 (99.6%) |
| 1.1 | 0.7 | 0.01 | 0.02 | 0.1 | 0.01 | 0.1 | Acidaminobacter sp. 2 | HQ003641 (98.9%) |
| 0.02 | 0.03 | 0.01 | <0.005 | 0.1 | ND | 0.01 | Acidaminobacter sp. 3 | GU389907 (100%) |
| 0.2 | 0.4 | 0.5 | 0.1 | 0.5 | 0.02 | 0.1 | Dechloromonas denitrificans | LODL01000012 (100%) |
| 0.1 | 0.2 | 0.4 | 0.1 | 0.1 | 0.01 | 0.1 | Zoogloea sp. | FJ356040 (100%) |
| 0.02 | 0.03 | 0.02 | 0.1 | 0.4 | <0.005 | 0.01 | Propionivibrio sp. | JF185748 (99%) |
| 0.03 | 0.1 | 0.01 | 0.1 | 0.2 | 0.01 | 0.1 | Desulfovibrio sp. 1 | EF590036 (100%) |
| 0.01 | 0.04 | 0.03 | 0.01 | 0.2 | ND | 0.005 | Desulfovibrio sp. 2 | FR669240 (100%) |
| 0.1 | 0.02 | 0.01 | 0.04 | 0.3 | <0.005 | 0.03 | Rivicola sp. | KF070978 (100%) |
| 0.05 | 0.03 | 0.005 | <0.005 | 0.02 | <0.005 | 0.03 | uncultured bacterium | KC758957 (96.7%) |
| 0.01 | 0.03 | 0.01 | 0.005 | 0.03 | <0.005 | 0.1 | Rhodocyclaceae | KJ808083 (100%) |
Altogether, 53 OTUs in the GDM biofilm communities were affiliated to genera that have been described as MC degraders (Chen and Chen 2010; Mankiewicz-Boczek et al. 2015; Li, Li and Li 2017). The most abundant OTUs (in terms of read numbers) related to known MC degraders were Aeromonas sp., Acidaminobacter sp., Sphingopyxis sp., Pseudomonas sp., Novosphingobium sp. and Paucibacter sp. Five of the 15 OTUs defined as ‘biomass responders’ (Table 1) were from genera that harbor MC-degrading strains (Acidaminobacter and Aeromonas). The closest isolates of these two MC-degrading genus are facultative or strict anaerobic reflecting the high chances that the MC degradation in GDM biofilms occurs under O2 limited conditions.
Distribution of OTUs from taxa with aerobic and anaerobic metabolism
The WT treatment biofilms were divided into three equal vertical sections that were individually sequenced in order to explore the distribution of distinct metabolic groups of bacteria (aerobes, facultative and strict anaerobes) at increasing distance (front, middle, back) from the influx of the GDM system. This metabolic classification showed significantly higher proportions of reads from strictly aerobic than from facultative or strictly anaerobic taxa in the front and middle sections of the biofilms, but no such differences in the back parts of the biofilm (Fig. 5A), which were characterized by equivalent proportions of reads from the three metabolic categories.
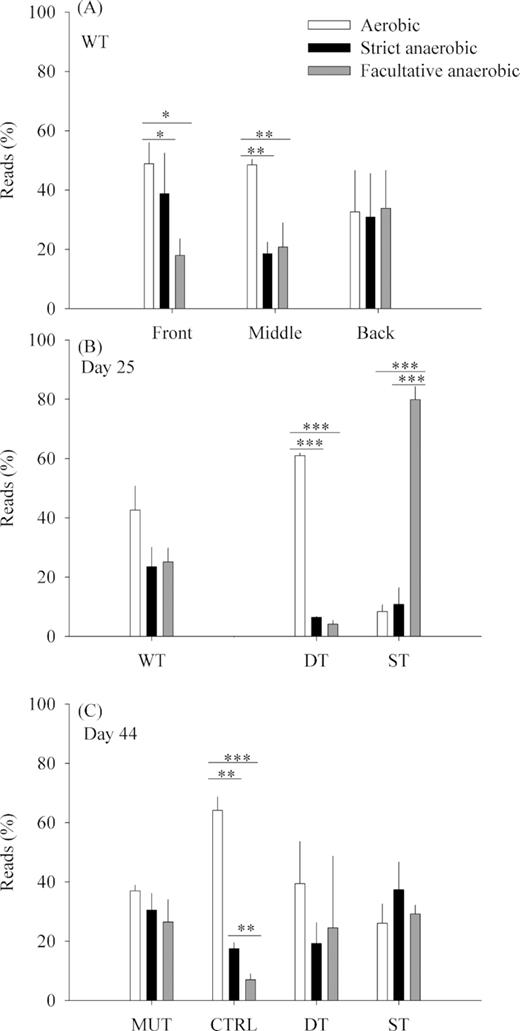
Proportions of reads classified into three metabolic groups (aerobic, strict anaerobic, facultative anaerobic): (A) across the three sections of WT biofilms (average ± SD, n = 3) on day 25; (B) in biofilms collected on day 25; (C) in biofilms collected on day 44. Only significant differences are represented (***P < 0.001, **P < 0.01, *P < 0.05). Altogether, 89% of all reads could be classified.
The distribution of reads within the above metabolic categories was comparatively assessed for biofilms from all treatments and time points (Fig. 5B and C). Reads from aerobic genotypes were significantly more abundant in the DT25 and CTRL treatments (ANOVA, P < 0.001). In the ST25 treatment, there were significantly more reads from facultatively anaerobic genotypes than from the other two metabolic categories (ANOVA, P < 0.001) (Fig. 5B and C). In samples from a previous experiment (Silva et al. 2018), genotypes with an either obligate or facultative anaerobic metabolism represented 14% of OTUs (47% of reads) in the WT treatments, 13% of OTUs (21% of reads) in MUT and 11% of OTUs (9% of reads) in CTRL.
DISCUSSION
Influence of carbon supplements on permeate flux
Permeate flux differed between treatments only during the first experimental phase (i.e. until day 25), reflecting the different types of added carbon source (Fig. 1A). The WT and MUT treatments had the lowest permeate flux, as also observed in previous experiments (Kohler et al. 2014; Silva et al. 2018, 2019). The GDM biofouling monitors were set up vertically to allow for sedimentation of larger particles to the bottom side of the devices rather than deposition on top of the membrane to maximize permeate flux. Several cyanobacterial strains, including M. aeruginosa, have gas vesicles that allow them to regulate their vertical position on the water column (Thomas and Walsby 1985). Cyanobacterial colonies continue to float after a bloom collapses (Leeben et al. 2008), and the biomass remains buoyant even after more than half of the gas vesicles have collapsed (Walsby, Hayes and Boje 1995). The high flux decline in WT and MUT was, therefore, likely a consequence of the even dispersion of biomass across the entire membrane.
By contrast, the biomass of collapsed diatom blooms tends to rapidly sink (Smetacek et al. 2012). The fragmented Fragilaria sp. cells of the DT25 treatment also visibly sedimented to the lower half of the biofouling monitors (data not shown). This likely allowed for higher permeate flux due to the partial clearing of the membrane, similar to the clearing effect caused by metazoan foraging (Derlon et al. 2012). Moreover, large parts of the DT25 biofilm likely only received little surplus organic carbon due to the uneven distribution of the added biomass. Additionally, the amount of DOC released from the disrupted diatom biomass was ∼7 times lower than in the other biomass treatments. As a consequence, the permeate flux of the DT25 and the CTRL treatments were very similar. Thus, it might be profitable to design GDM systems with vertical positioning of the membrane to maximize permeate production from source water with regular diatom blooms.
Finally, the permeate flux in the ST25 treatment, which only received dissolved starch solution, was more similar to WT and MUT than to DT25. Since no particulate biomass was introduced into the ST25 GDM systems, the decline in flux likely was due to the increase in hydraulic resistance caused by the growing biofilms themselves (Desmond et al. 2018b).
Resistance of biofilm communities to changing carbon source
Resistance is the ability of communities to withstand a perturbation or stress (Shade et al. 2012). Bray–Curtis dissimilarity analysis indicated high resistance of the DT and ST biofilm communities to the change of substrate source on day 25 (Fig. 4): Significant separation of clusters was exclusively according to original treatment types, whereas there was no apparent distinction between the communities before and after the addition of toxic biomass. This separation was stable even if the dataset was reduced to the 35 most abundant OTUs (data not shown), indicating that a small number of highly dominant microbial genotypes were responsible for the biomass-specific clustering patterns, as well as for the resistance of the DT and ST biofilm communities to disturbance. This suggests that the resistance of these biofilms to invasion by other taxa was probably mainly biotic, i.e. based on the competitive abilities of (and possibly interactions between) large, well-established populations.
The DT and ST communities were highly similar before and after the disturbance: 96 and 97% of reads in ST44 and DT44 communities were from OTUs that were also dominant (99 and 98% of reads, respectively) before the addition of cyanobacterial biomass. Yet, a substantially higher fraction of OTUs from the original community (53 vs. 33%) was conserved in the significantly more diverse DT biofilms (1221 vs. 239 OTUs) (Fig. 3). These results are in line with the concept of the insurance hypothesis (Yachi and Loreau 1999), i.e. that community resistance increases with species richness, because a higher number of functionally equivalent or similar species can respond to a greater variety of perturbations. A positive relationship between high diversity and enhanced resistance to physical and chemical stressors was also reported in microbial communities from fumigated soil (Griffiths et al. 2000).
Microbial communities in soil ecosystems are generally sensitive to disturbance (Allison and Martiny 2008), i.e. the composition of disturbed communities is distinct from the original one (Rhine, Fuhrmann and Radosevich 2003; Wawrik et al. 2005). By contrast, the high resistance of the biofilm communities from the DT and ST treatments to the new environmental conditions (Fig. 4) seems to indicate a major role of historical contingencies on their composition (Ge et al. 2008; Vass and Langenheder 2017). However, it should be noted that DNA released by dead cells before the addition of M. aeruginosa might have been conserved within the GDM biofilms as part of their matrix structure (Webb et al. 2003; Jakubovics et al. 2013), thereby distorting our assessment of overall community changes (Fig. 4).
Higher productivity leads to oxygen-limited conditions in GDM biofilms
The oxygen saturation on top of the biofilms depended on respiration rates and the influx of oxygen saturated feed water. Oxygen consumption rates are proportional to biofilm productivity (Schramm et al. 1996; Santegoeds et al. 1998; von Ohle et al. 2010). Lower productivity of the DT25 and CTRL than the WT, MUT and ST25 biofilms, as deduced from the permeate flux (Fig. 1A) and visible differences in biofilm thickness (data not shown) agreed with the observed patterns of oxygen consumption (Fig. 2A). Reduction of permeate flux is caused by the thickness and internal structure of the biofilm (Desmond et al. 2018a), and the potential for oxygen limitation also increases with biofilm thickness (Characklis 1981). During the second experimental phase, when all the treatments were receiving identical doses of MC-containing cyanobacterial biomass, all biofilms had comparable oxygen consumption patterns (Fig. 2B), and permeate flux (Fig. 1A), indicating that they were converging in terms of productivity irrespective of their history.
MC degradation
The WT treatments showed a horizontal pattern of functional community composition (Fig. 5A): Aerobic genotypes decreased in read numbers toward the part of the biofilm that was most distant to the inflow. This is evidence that a horizontal gradient of oxygen availability shaped the WT biofilm community structure, and may help to explain the observed co-occurrence of both, strictly aerobic and anaerobic genotypes in GDM biofilms with a constant inflow of oxygen saturated water. A vertical gradient of oxygen availability has been described in slow sand filtration columns designed to represent the sediments of rivers (Mermillod-Blondin, Mauclaire and Montuelle 2005). In these systems, organic carbon was aerobically consumed in the surface layers, while anaerobic carbon consumption likely dominated in the deeper layers. Similarly, aerobic ammonia-oxidizing bacteria in membrane-aerated biofilm reactors were found near the membrane surface where contact with oxygen was highest, whereas denitrifying bacteria grew more distant to the membrane where more anoxic niches were likely available (LaPara et al. 2006).
After an initial period of adaptation, the biofilm community of the WT treatments represented a suitable environment for the growth of MC degraders. This reflects the pattern observed during previous GDM experiments (Kohler et al. 2014; Silva et al. 2018, 2019). It is likely that the WT biofilms were dominated by aerobic genotypes during the first days of GDM operation when permeate flux rates were high (Fig. 1A). An OTU affiliated with Paucibacter sp., a known aerobic MC degrader (Rapala et al. 2005) had a >2-fold higher read number in WT (1143 or 2% of total reads) than in MUT and was virtually absent in all other treatments. MUT only received the toxin when oxygen-limited conditions were already prevalent (Fig. 2C), suggesting that the larger Paucibacter sp. population in the WT treatment developed during the early phase of biofilm formation. However, MC degradation in WT became considerably more effective with the eventual establishment of oxygen-limited conditions (around day 12, Figs 1B and 2A), suggesting that other bacteria than the Paucibacter-related OTU were responsible for this function at that stage. A genotypic succession of degraders of specific compounds that was driven by unrelated functional traits has also been observed in other environments (Eckert et al. 2012).
After the addition of toxic cyanobacterial biomass, MC degradation occurred earlier in MUT than in CTRL, DT44 and ST44, and the subsequent reduction of MC concentrations was significantly faster in MUT than in all other treatments (i.e. the slope of the regression of MC concentration over time was highest, Fig. 2B). This ‘priming’ phenomenon has been observed previously (Silva et al. 2018, 2019). Conceptionally, the ‘priming’ in the MUT treatment might have been either related to the establishment of appropriate environmental conditions or to the community structure of the biofilms. On the one hand, the relative proportions of aerobic and anaerobic genotypes in WT and MUT biofilms were very similar when both were completely removing all added MC (Fig. 5B and C). On the other hand, the composition of WT and MUT communities was statistically indistinguishable, as assessed by Bray–Curtis dissimilarity (Fig. 4). Therefore, a comparison with biofilms grown on other carbon sources was performed in order to assess which factor was more important for the ‘priming’ of MC degradation.
When toxic cyanobacterial biomass was added, the ST biofilms performed significantly better in terms of MC removal than the DT and CTRL biofilms (Fig. 1B). We propose that this was related to functional differences between these communities. Specifically, the ST25 biofilms were mainly formed by anaerobic genotypes, whereas the DT25 (and the CTRL) biofilms were dominated by aerobic genotypes (Fig. 5B). Thus, the ST25 biofilms provided a better habitat for the establishment of anaerobic, facultative MC degraders already before the addition of toxic biomass. For example, genotypes affiliated with the known anaerobic MC degrader Acidaminobacter sp. (JX262570) (Chen and Chen 2010) were already common in the ST25 treatment and increased by only 4-fold after the addition of MC-containing biomass. By contrast, the same genotype increased by >40-fold between DT25 and DT44 (Table 1). This conclusion is also supported by the higher proportions of reads from anaerobic genotypes in MUT treatments with no exposure to MC (as compared to the respective CTRL) in a previous experiment (Silva et al. 2018). Moreover, both, the WT and the MUT community in that experiment also featured substantial populations affiliated with the above mentioned Acidaminobacter sp. (WT: 3%, MUT: 5% of total reads), whereas it was absent in the CTRL biofilms.
The biofilm community of the WT and the CTRL, DT and ST biofilms from day 44, all removed 100% of the added MC. All these communities were significantly different from each other (Fig. 4). This might indicate that the efficiency and stability of the MC degradation process in GDM biofilms is based on functional redundancy, as has been reported for processes in stream biofilms (Wagner et al. 2014; Dopheide et al. 2015). Moreover, the significant community dissimilarity between functionally equivalent biofilm assemblages suggests that the nature of the carbon source mainly imprinted on the overall community structure, whereas the efficiency of MC degradation was predominantly driven by habitat conditions. The differences in the adaptation time for complete MC removal (Fig. 1B), as well as the higher presence of anaerobic genotypes in those biofilms where the MC degradation developed most effectively (MUT and ST) indicate that MC degradation in GDM biofilms was mainly an anaerobic process. This is also supported by the significant shift toward anaerobic genotypes from the DT25 to the DT44 communities (Fig. 5B and C).
Little is known about the degradation of MC under oxygen-limited conditions, and the only described degradation pathway is an aerobic one (Bourne et al. 1996, 2001). In Lake Zurich, the collapse of gas vacuoles below a depth of 80 m and sedimentation are the major elimination processes of MC-containing P. rubescens. Thus, it is likely that MC degradation will occur on sediments in the anoxic deep layers of the lake (Posch et al. 2012). Anaerobic degradation of MC has been shown in both, sediment inocula and MC scums (Holst et al. 2003; Chen and Chen 2010; Xing et al. 2011), and can be more efficient than aerobic degradation in some cases. Holst et al. (2003) reported that >80% of added MC was degraded under anoxic conditions within one day, whereas the same amount of MC was only consumed after 1–2 weeks in the presence of oxygen. The degradation of MC in enrichment cultures of bacteria from Lake Zurich and a nearby stream was also only observed under oxygen-limited conditions (Silva et al. 2019).
CONCLUSIONS
This study provides evidence that MC degradation in GDM biofilms was dependent on the establishment of anaerobic communities. We show that MC degradation in GDM biofilms can be primed by substrate addition, but that this effect is mediated via the creation of appropriate, i.e. anoxic habitat conditions rather than due to direct co-metabolic stimulation or the selection of a particular community structure (Guenet et al. 2010). Our data also indicated that the known aerobic MC degraders were rare or absent in the biofilm communities during the period when the corresponding removal rates were highest. It is thus likely that alternative pathways and/or genes were involved in MC degradation in GDM biofilms (Mou et al. 2013). A metagenomic analysis of GDM biofilms might help to further explore this hypothesis. However, it is likely that alternative degradation pathways are represented by unspecific detoxification systems (e.g. glutathione S-transferase and proteases), and that MC degradation might even be a co-metabolic process in highly productive environments (Jones and Orr 1994; Saito et al. 2003). Thus, unambiguous identification of novel pathways from metagenomic data might still be challenging in the absence of isolates.
FUNDING
This work was supported by the Swiss National Science Foundation (CR32I2_149648/1; 31003A_182336).
ACKNOWLEDGEMENTS
We would like to thank Alessia Prospero for the assistance during the experimental work.
Conflict of interest
None declared.
