


ABSTRACT
As groundwater-fed waterworks clean their raw inlet water with sand filters, a variety of pro- and eukaryotic microbial communities develop on these filters. While several studies have targeted the prokaryotic sand filter communities, little is known about the eukaryotic communities, despite the obvious need for knowledge of microorganisms that get in contact with human drinking water. With a new general eukaryotic primer set (18S, V1-V3 region), we performed FLX-454 sequencing of material from 21 waterworks' sand filters varying in age (3–40 years) and geographical location on a 250 km east–west axis in Denmark, and put the data in context of their previously published prokaryotic communities. We find that filters vary highly in trophic complexity depending on age, from simple systems with bacteria and protozoa (3–6 years) to complex, mature systems with nematodes, rotifers and turbellarians as apex predators (40 years). Unlike the bacterial communities, the eukaryotic communities display a clear distance–decay relationship that predominates over environmental variations, indicating that the underlying aquifers feeding the filters harbor distinct eukaryotic communities with limited dispersal in between. Our findings have implications for waterworks' filter management, and offer a window down to the largely unexplored eukaryotic microbiology of groundwater aquifers.
INTRODUCTION
Waterworks use sand filters to remove undesired chemical compounds, mainly iron and manganese, from the drinking water. In Europe, the most common type is the so-called rapid sand filter (Fig. 1A) with an area of <50 m2 and a water retention time of 10–20 min.

(A) Schematic illustration of a waterwork's rapid sand filter. (B) Dominating geological features with regard to groundwater abstraction. Region 1: Aeolian and diluvial sandy deposits with sandy aquifers. Region 2: Till deposits with sandy aquifers. Region 3: Till deposits with chalk aquifers. Hardness of the water is lowest in region 1 and highest in region 3. Other geochemical parameters are mainly determined by more local geological features.
Filters may be either single or double (split into a pre- and a postfilter). In Denmark, almost all drinking water comes from groundwater aquifers.
A specific biota of prokaryotes, protozoa and small metazoans (primarily nematodes) has been reported from the filters (Madoni et al. 2000; Feld et al. 2016; Palomo et al. 2016; Albers et al. 2018), and several studies (mainly on bacteria) have found that microbial sand filter communities predominantly originate from the source water (Haig 2014; Gulay et al. 2016; Liu et al.2014).
Several recent systematic high-throughput sequencing studies have studied the filter bacterial communities (Bai et al. 2013; Haig et al. 2014; Haig et al. 2015; Gulay et al. 2016), but to our knowledge, no systematic molecular study has hitherto targeted the eukaryotic sand filter communities. A number of metazoan taxa such as nematodes, gastrotrichs and isopods have been described from individual filters (Madoni et al. 2000; Christensen et al. 2011), but it is not known whether they are generally present on all types of filters. Likewise, the factors potentially structuring the microeukaryotic community composition are unknown.
Several eukaryotes in sand filters have been shown to be directly or indirectly harmful to human health (Valster et al. 2009; Thomas and Ashbolt 2011). Further, much of the effort devoted to enhance the removal of unwanted substances by bioaugmentation (direct seeding with beneficial bacteria) (Krüger et al. 2015; Albers et al. 2015b; Horemans et al. 2017; Albers et al. 2018) has often given disappointing outcomes (Vandermaesen et al. 2016), which has at several occasions been shown to be negatively affected by predation from grazing protozoa, and even further by interactions with higher-level meiofauna (Naslund, Nascimento and Gunnarsson 2010; McGenity et al. 2012; Sibilleet al. 1998).
Knowledge about the sand filter eukaryotic microbiology and their trophic levels is thus certainly of immediate interest to filter managers and applied scientists.
For ecologists more generally, sand filters are interesting as another type of extreme (European Science Foundation 2007) but manmade microbial habitats, as their microbiota is mainly sampled from a pool of organisms in (likewise extreme) hypoxic subterranean groundwater environments (Fišer, Pipan and Culver 2014). Like the aquifers, sand filters have a low nutrient content, a limited exchange rate of matter with the outside (Griebler and Lueders 2009), little if any seasonal/climatic variation, and the only primary production is chemolithotrophic oxidation of mostly inorganic ions (NH4+, Fe2+ or Mn2+). However, the aquifer environment changes markedly in the transition to the filter, as the hypoxic groundwater turns hyperoxic by the aeration meant to precipitate the iron from the inlet water. Filters also experience regular disturbances by ‘backwashing’ with clean water pumped backward through the sediment in fixed intervals to clean the sand matrix. Thus, we imagined that sand filters represent a very unique extreme ecological niche with no direct natural parallel, but which presented an opportunity to study highly identical field-scale sized ecosystems with a likely manageable diversity over geographical distances.
In this study, we analyzed the eukaryotic biota from 11 Danish waterworks (21 filters in total) based on FLX-454 titanium sequencing targeting the standard eukaryotic 18S region. We designed a new 18S primer set targeting the V1-V3 region, as the primer sets most frequently applied in HTP sequencing studies (Blaxter et al. 1998; Amaral-Zettler et al. 2009; Creer et al. 2010) are biased against important protozoan groups such as Ciliophora, Excavata and Euglenozoa. This is a major issue in the analysis of the eukaryotic microbiology of an aquatic environment with no photosynthesis and limited niched for filamentous fungi and metazoans, where heterotrophic protozoa were a priori likely to predominate. While the long V4 region has traditionally been the preferred single 18S hypervariable region candidate for a universal eukaryotic pre-barcode (Pawlowski et al. 2012), the usually slightly shorter V2 has been found to reflect 18S diversity equally well across many eukaryotic groups (Blaxter et al. 1998; Ki 2012; Hadziavdic et al. 2014; Harder et al. 2016). We sampled moist filter material from filters with material ages of 3–40 years on a 250 km East–West axis across Denmark through three regions with different geologies and aquifer types: (i) Western Jutland, (ii) Eastern Jutland/Funen and (iii) Zealand (Fig. 1B). We assigned the eukaryotes to their most likely trophic level as bacterivores, potential predators on protozoa and/or potential predators on other metazoans. We place the results into the context of our previously published study of the same waterworks' prokaryotic microbial community of both Archaea and Bacteria, (Albers et al. 2015a), thus providing the (to our knowledge) first high-throughput sequencing-based picture of entire sand filter ecosystems of organisms associated with the filter material particles. Our earlier study on prokaryotes showed their community structure to be mainly determined by groundwater chemistry. Here, we aimed (i) to determine the factors structuring the trophic system complexity in each individual filter community and (ii) to test whether the same pattern of groundwater chemistry also structured the eukaryotic community to the same degree, or whether a distance–decay relationship between the eukaryotic β-diversity similarities and the geographical distances could be identified over relatively short distances in these comparatively uniform environments.
MATERIALS AND METHODS
Primer design
We constructed a new set of 18S primers covering the hypervariable regions V1-V3, 18SGenF-0001 (5’-TGTCTCAAAGATTAAGCCATGCA-’3, Tm = 57.1°C), based on that of Harder, Ekelund and Karpov (2014), and 18SGenR-0550 (5’-GGAATTACCGCGGCTGCT-’3, Tm = 58.2°C) named by the positions in the reference sequence. For details on design, amplification lengths and matches to taxonomic groups, see section 1 in the supplementary material (Supporting Information).
Sampling, DNA extraction and collections/measurements of physical and chemical properties were done as described in our previous article (Albers et al. 2015a). In short, we sampled filter material from the filters with a sterilized sewer grab, froze it immediately in liquid nitrogen, took 2 mL of this filter material and sonicated it for 5−6 min to loosen bacterial biofilms from the sand grains. We then vortexed the samples and did four separate extractions on 4 × 500 mg sonicated sand grains, which were later pooled. All DNA analyses were done on the same DNA extractions as in Albers et al. (2015a).
Additionally, for the eukaryotes we also took a sample of fresh filter material for microscopy that we put on ice (but did not immediately freeze) for visual inspections of metazoans. For microscopy of metazoans, the material was vortexed, put in Nunc bottles and examined directly using an inverted microscope.
PCR and GS-FLX Titanium sequencing
We used a two-step nested PCR approach with 35 cycles (for 1st PCR and 15 cycles in the 2nd at an annealing temperature of 51°C, excising the bands in the targeted length (4–600 bp) from an electrophoresis gel. Libraries were measured with QuBit, pooled in equimolar concentrations and sequences on the GS-FLX Titanium platform. For further details, see section 2 in the supplementary material (Supporting Information).
Bioinformatic analyses
We processed the GS-FLX (Roche, Mannheim, Germany) run in MOTHUR (Schloss et al. 2009), v1.35. For details of the bioinformatic treatment with trimming, sorting and chimera checking, see section 3 in the supplementary material (Supporting Information). We then filtered the alignment, calculated a distance matrix, treating gaps as one event without counting end overhangs, and clustered sequences again at the 3, 5 and 10% thresholds.
The representative sequences of the final OTUs were again identified with the RDP identifier (a naÏve bayesian taxonomic classifier; Wang et al. 2007) on a merged version of the 104, 119 and 123 releases of the SILVA 18S database (Quast et al. 2012) at a 50% bootstrap level, and blasted as a double check. All were assigned as eukaryotes with >90% bootstrap. Except for Fungi, we considered all assignment of OTUs above the phylum level as uninformative/unassigned. To increase the number of identifiable OTUs, we further constructed a tree (not shown) in RaxML (Stamatakis 2014) with 88 eukaryotic representative sequences of 44 phyla and added the representative sequences from the OTUs with the EPA algorithm, accepting a combined likelihood of branch support and likelihood of placement on branch >50 as correct.
For prokaryotes, all bioinformatics analysis steps in MOTHUR were similar to those of the above eukaryotic analysis, and to our previous article (Albers et al. 2015a), except that we now clustered the 251 472 high-quality sequences at not only 3%, but also the 5 and 10% OTU separation levels (using the nearest neighbor algorithm) as for the eukaryotes.
Statistical analyses
The sequence count differed from 138 to 47 032 (Table 1) (558–68 918 for prokaryotes). We did not rarefy samples for community similarity comparisons (McMurdie and Holmes 2014). In comparisons of species richness (Fig. 3), which are more easily skewed by unequal sampling effort (Gotelli and Colwell 2001), we used coverage-based rarefaction standardizing samples by ‘completeness’ (Chao and Jost 2012) with the estimateD function of the R package iNEXT (Hsieh and Ma 2016). We excluded Svenstrup pre- (268 seq) and postfilter (138 seq) from the eukaryotic analyses, and the Lindved (558 seq) and Odense (643 seq) postfilters from the prokaryotic analyses (coverage level ≤90%). From the remaining data, the minimum coverage for all samples was 97.3% (eukaryotes) and 96.9% (prokaryotes) without need to extrapolate beyond sample sizes. Then, we performed a nonmetric multidimensional scaling analysis (NMDS) on the Bray–Curtis dissimilarity index (Bray and Curtis 1957) (BC) using the metaMDS function of the R Vegan package (Oksanen et al. 2015) for the 3% threshold data (Fig. 5A).
Waterwork filter data. Full names and abbreviations of each filter, total sequence counts, OTU (3%) count, and age of filters.
| Waterwork filter name | Abbreviation | Sequences | OTUs (3%) | Age |
|---|---|---|---|---|
| Aike (postfilter) | Aik-D | 47 032 | 244 | 21 |
| Aike (prefilter) | Aik-T | 28 925 | 123 | 21 |
| Astrup (postfilter) | Ast-D | 507 | 36 | 16 |
| Astrup (prefilter) | Ast-T | 1162 | 27 | 8 |
| Landet (single filter, depth) | Lan-D | 32 228 | 85 | 6 |
| Landet (single filter, top) | Lan-T | 24 158 | 75 | 6 |
| Lindved (postfilter) | Lin_D | 19 815 | 184 | 34 |
| Lindved (prefilter) | Lin-T | 16 239 | 152 | 34 |
| Lunde (single filter, top) | Lun-T | 14 914 | 139 | 3 |
| Odense (postfilter) | Ode-D | 9705 | 122 | 26 |
| Odense (prefilter) | Ode-T | 9125 | 108 | 26 |
| Svenstrup (postfilter) | Sve-D | 138 | 29 | 4 |
| Svenstrup (prefilter) | Sve-T | 268 | 33 | 4 |
| Vejle (Søndre Vandværk, postfilter) | Vej-D | 3109 | 67 | 7 |
| Vejle (Søndre Vandværk, prefilter) | Vej-T | 6595 | 67 | 7 |
| Hvidovre (single filter, depth) | Hvi-D | 3477 | 129 | 40 |
| Hvidovre (single filter, top) | Hvi-T | 9170 | 110 | 40 |
| Islevbro (single filter, depth) | Isl-D | 2179 | 91 | 25 |
| Islevbro (single filter, top) | Isl-T | 981 | 50 | 25 |
| Søndersø (single filter, depth) | Søn-D | 2814 | 130 | 29 |
| Søndersø (single filter, top) | Søn-T | 1501 | 33 | 16 |
We created the matrix of the geographical distances between the waterworks with Google Maps (‘as the crow flies’) (Table S1, Supporting Information). We performed Mantel tests (Douglas and Endler 1982) for the shared OTU matrices at the 3, 5 and 10% thresholds on the correlation between the BC-dissimilarity and geographic distance matrices for both pro- and eukaryotes. A stepwise linear regression of all environmental variables with the eukaryotic species richness as dependent variable in the coverage-based resampled datasets was done with the stepAIC function (both directions, 1000 steps) of the MASS package (Ripley et al. 2011).
RESULTS
Sequencing run
We obtained 664 111 reads on 22 tags. The relatively low annealing temperature we selected for a thermostable platinum/phusion polymerase-based PCR gave a certain amount of unspecific amplification (mostly from non-16S bacterial regions). Thus, our quality control left a final set of 234 042 high-quality 400–532 bp long sequences (mean: 454.98) which yielded 752 3%OTUs. Of those, 627 OTUs (95 428 sequences) could be identified to a satisfactory level by this method. The RaxML tree identified another 37 OTUs (75 601 sequences). 88 OTUs (63 013 sequences) could not be reliably assigned to any informative taxonomic level by either method.
Eukaryotic community composition and trophic structure
We could assign 640 (88.3%) of the 752 3%OTUs (73% of sequences) to phylum level or below. In Fig. 2, we identified metazoans to phylum level, and the remaining organisms to higher supergroup (Baldauf 2008; Adl et al. 2012) levels (except Fungi). Protozoa (Stramenopiles, Ciliates, Cercozoa and Amoebozoa) made up 61.6% of all sequences, >50% of all classified sequences. Protozoa dominated the eukaryotic communities in the majority of samples (Fig. 2), except for Astrup in Western Jutland where fungi comprised >50% of both pre- and postfilter samples. Stramenopiles dominated the rest of Jutland and Funen, while Cercozoa dominated in the samples from Zealand. The 27% unidentified sequences were unevenly distributed (Søn-T:89%, Isl-T:4%).
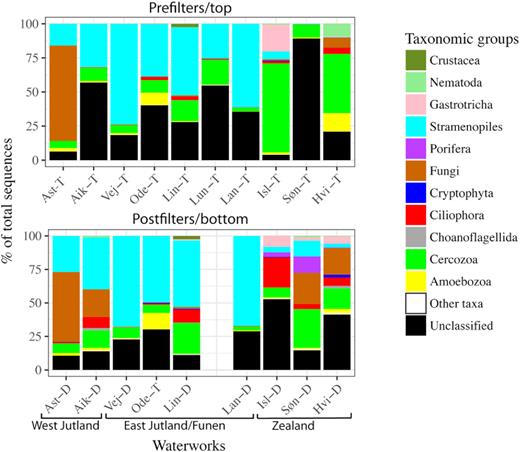
Bar chart of fractions of sequences classified to phylum level. All groups that did not comprise 1% of at least one sample are lumped in ‘other taxa’. For fungi, we accepted the domain level classification as ecologically informative; for all other groups, OTUs not identified to phylum level were listed as unclassified. For a similar figure for bacteria, see Fig. 1 in Albers et al. (2015a).
The most common metazoan groups were nematodes, gastrotrichs and small crustaceans (isopods). We identified a simple trophic structure (Fig. 4): (i) primary producers, i.e. chemolithotrophic Bacteria/Archaea; (ii) primary decomposers, i.e. heterotrophic prokaryotes and fungi; (iii) bacterivorous micrograzers, i.e. protozoa (cercozoa, ameobozoa, stramenopiles, choanoflagellates and non-litonotid ciliates) and nematodes; (iv) litonotid ciliates (known to prey on other protozoa (Lynn 2008) (v) top-predators (turbellaria); and (vi) omnivorous metazoans (crustaceans, gastrotrichs, rotiferans). For a complete taxonomic breakdown of OTUs, see Table S3 (Supporting Information).
In four waterworks, we found no metazoan taxa (Astrup, Landet, Lunde, Vejle); rotifers were present in three waterworks (Lindved, Islevbro, Hvidovre), with Hvidovre as unique in having top predators (turbellarians) in the food web. Stepwise linear regression identified a best model with nine parameters correlating with eukaryotic 3%OTU richness (age, pH, Backwashing, Longitude, Mn, Clw, O2 (w), K (w) and Mg (w)), but only age and Mn correlated significantly in individual linear regressions (P < 0.05), and for postfilters (where manganese is specifically removed), only age was significant (r2 = 0.65, P = 0.005). Thus, our data suggest that age is the most important parameter for filter α-diversity; the older the filter material, the higher its richness (r2 = 0.37, P = 0.003, Fig. 3A) and evenness (r2 = 0.37, P = 0.005, Fig. 3C), and the more complex its trophic structure (Fig. 4). Notably, the large differences in backwashing frequency (1–17 days) were uncorrelated with richness (r2 = 0.04, P = 0.31).
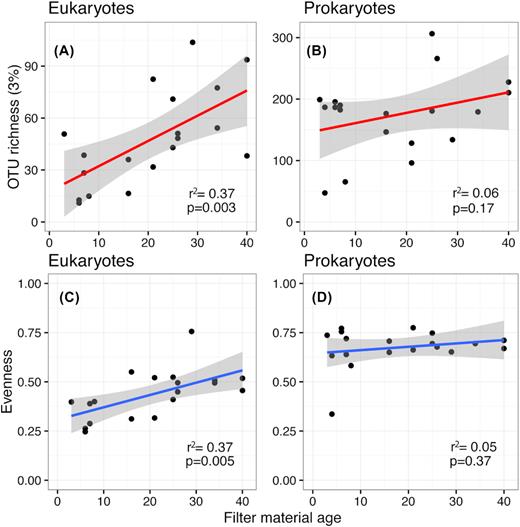
Linear relationships between filter material age and OTU richness/evenness. For eukaryotes, communities get both richer and more even over a timescale of 4–40 years. Bacterial communities show no increase in either and appear to have stabilized over a much shorter timescale.
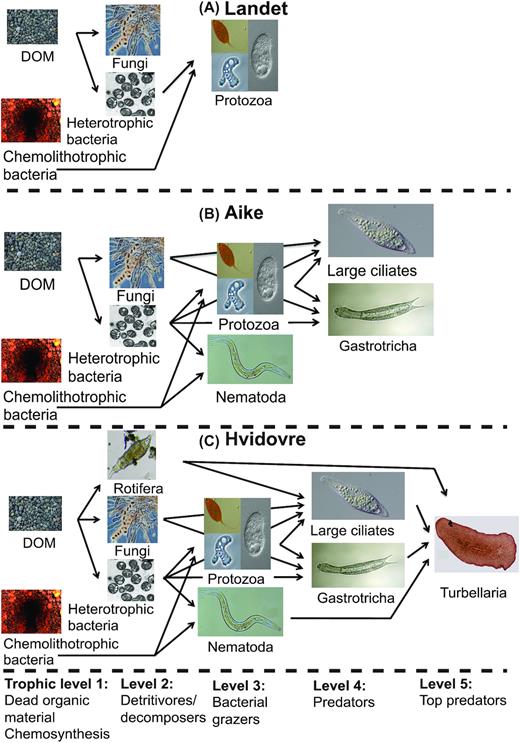
Idealized food webs for three waterworks of different filter material age. (A) Landet (4 years) has a simple food web with bacteria and smaller protozoans, predominantly stramenopiles; (B) Aike (21 years) adds litostomatid ciliates and the metazoan gastrotrichs and nematodes to that; and (C) Hvidovre (40 years) furthermore has large, detritivorous rotifers and turbellarians as top predators. There were no crustaceans found on any of these three waterworks. Photo credits and permissions: DOM: Christian Albers. Chemolithotrophic bacteria (Gallionella ferruginea). Source: https://pixabay.com/photos/water-pipes-pipe-rust-sludge-688431/. Permission: Pixabay License https://pixabay.com/service/license/). Heterotrophic bacteria (Methylococcus capsulatus). Author: Anne Fjellbirkeland. Source: https://commons.wikimedia.org/wiki/File:Methylococcus_capsulatus.png. Permission: Creative Commons Attribution 2.5 Unported license https://creativecommons.org/licenses/by/2.5/deed.en. Fungi: Author: Peter G. Werner. Morchella elata asci. Source: https://commons.wikimedia.org/wiki/File:Morelasci.jpg. Permission: Creative Commons Attribution 3.0 Unported license: https://creativecommons.org/licenses/by/3.0/deed.en. Picture slightly brightened. Protozoa upper left, excavate flagellate (Calkinsia aureus): Author: User "Djpmapleferryman". Source: https://www.flickr.com/photos/63319497@N00/2843250035. Permission: Creative Commons License Attribution 2.0 Generic. Protozoa lower left: Naked amoeba (Acanthamoeba keratitis). Author: Jean-Lou Justine. Source: https://commons.wikimedia.org/wiki/File:Parasite140120-fig3_Acanthamoeba_keratitis_Figure_3A.png. From Lorenzo-Morales, Khan and Walochnik (2015). Permission: https://creativecommons.org/licenses/by/4.0/deed.en). Protozoa right: Small ciliate (Colpoda cucullus). Source: https://www.flickr.com/photos/picksfromoutthere/10783409045. Permission: Creative Commons License Attribution 2.0 Generic. All three pictures slightly cropped. Nematoda (Acrobeles sp.). Author: K-state research and extension´s photostream. Source: https://www.flickr.com/photos/ksrecomm/19700675559. Permission: Creative Commons License Attribution 2.0 Generic. Rotifera (Bdelloidea sp.). Author: Donald Hobern. Source: https://www.flickr.com/photos/dhobern/16254396681. Permission: Creative Commons License Attribution 2.0 Generic. Cropped. Large ciliate(Litonotus lamella): Author, "Picturepest": Source: https://www.flickr.com/photos/picksfromoutthere/24046121015. Permission: Creative Commons License Attribution 2.0 Generic. Cropped. Gastrotrich (Lepidodermella squamatum). Author: Giuseppe Vago. Source: https://commons.wikimedia.org/wiki/File:Lepidodermella_squamatum.jpg. Permission: Creative Commons License Attribution 2.0 Generic. Original scale removed. Turbellaria (Gnesioceros sargassicola). Author: Eric A. Lazo-Vazem. Source: https://commons.wikimedia.org/wiki/File:Gnesioceros_sargassicola_(YPM_IZ_020145).jpeg. Creative Commons CC0 1.0 Universal Public Domain Dedication, permission: https://creativecommons.org/publicdomain/zero/1.0/deed.en.
We observed gastrotrichs by microscopy in all samples where the molecular analysis also confirmed their presence (Aike, Odense, Lindved, Svenstrup, Islevbro, Hvidovre and Søndersø). We also saw rotifers in the Hvidovre, Lindved and Islevbro samples.
We did not observe turbellarians in the Hvidovre sample, and isopods only in Lindved, not in Odense.
Eukaryotic biogeography
An NMDS-plot on the β-diversity (Bray–Curtis dissimilarity) suggested the eukaryotic communities to be largely distributed along a geographic east-west dissimilarity axis (the MDS2 axis), with Astrup as an outlier (Fig. 5A). Of 26 physicochemical parameters (Table S4, Supporting Information) included in the analysis in Fig. 5A, filter age, dH (water hardness), NVOC, Mg2+, NO3−, Mnw, NH4+ and longitude were inter-correlated and correlated significantly with the MDS1 or the MDS2 axes in the NMDS analysis. When partial mantel tests (Smouse, Long and Sokal 1986) correcting for spatial autocorrelation were applied to all these environmental parameters, none of them correlated significantly with the β-diversity anymore (all P-values > 0.05).
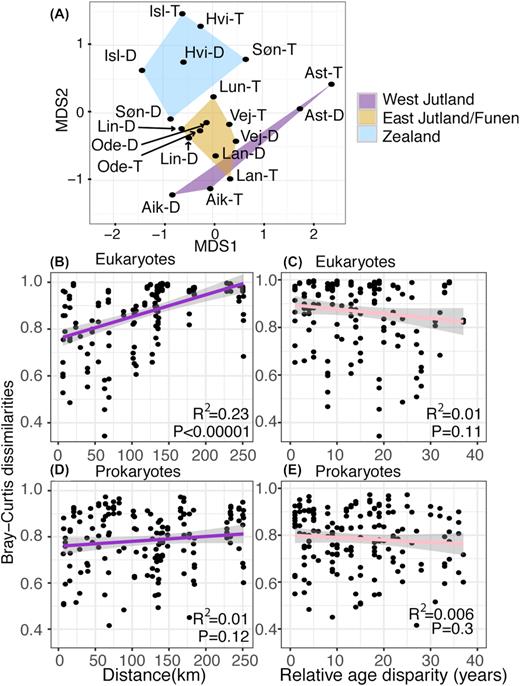
(A) NMDS 2D plot of the eukaryotic dataset. 1000 replications, stress = 0.16. Waterworks encapsulated in polygons according to their geographical region (see the regions in Fig. 1). As in Fig. 2, we used the three first letters in their names as an abbreviation, with a -T added for prefilter/top sample, and -D for postfilter/depth sample. For a bacterial NMDS plot, see Fig. 2 in Albers et al. (2015a). Pairwise geographic distance correlations with pairwise Bray–Curtis dissimilarity for eukaryotes (B), and prokaryotes (D). Pairwise age disparity correlations with pairwise Bray–Curtis dissimilarity for eukaryotes (C), and prokaryotes (E). Pairs of pre- and postfilters from the same waterworks (with a mutual geographical distance and age disparity of 0) were excluded. Grey shades represent 95% confidence intervals of a linear model. Logaritmic models (log (distance)+1) gave similar or poorer fits with BC-dissimilarity. Note that while age of filter material correlates strongly with increasing eukaryotic richness (α-diversity) (Fig. 3A), the eukaryotic community dissimilarity (b-diversity) correlates with geographic distance (Fig. 5B), not with age differences (Fig. 5C).
Geographical distance and Bray–Curtis dissimilarity correlated significantly (mantel test, r2 = 0.48, P = 0.001) for the eukaryotic communities. This result was robust no matter how we reduced or subdivided the data (Table S5, Supporting Information). Distance explains ∼23% of the observed variation in pairwise dissimilarity between waterworks (Fig. 5B). All pre- and postfilter comparisons from the same waterworks (geographical distance = 0) were excluded from all mantel tests as interdependent of each other. A mantel correlogram (Oden and Sokal 1986) (Figure S3, Supporting Information) shows the spatial autocorrelation with the eukaryotic β-diversity to be consistent for all three distance classes (P-values < 0.01). Its three distance classes with centers of 41.9, 125.6 and 209.3 km roughly reflect respective mean distances between waterworks within a region, between neighboring regions and between the eastern- and westernmost region.
Prokaryotes
We previously analyzed the prokaryotic communities and the importance of the groundwater chemistry for community composition; for bar chart and NMDS plot, see (Albers et al. 2015a). Here, we only present new analyses of prokaryotic distance–decay relationships and diversity/richness.
We again left out pairwise comparisons of pre/postfilters. For 1617 prokaryotic 3%OTUs from the 19 samples with coverage of >96.9%, the mantel test was not significant (r2 = 0.12, P = 0.1, Fig. 5C), and this result was robustly nonsignificant to any reduction or subdivision (Table S6, Supporting Information), just as the mantel correlogram (Figure S3, Supporting Information) showed no significant spatial autocorrelation (P > 0.05 for all three distance classes) for the prokaryotic β-diversity. Filter material age showed no clear relationship with prokaryotic OTU richness (r2 = 0.06, P = 0.17, Fig. 3B) or community evenness (r2 = 0.05, P = 0.37, Fig. 3D). Unlike previous research on Danish sand filters (Gulay et al. 2016), we found no difference in richness/evenness between pre- and postfilters (t-test, equal variances, P = 0.88), nor any significant prokaryotic distance–decay relationship. Neither substituting Shannon-index for species richness nor raising the clustering threshold to 5% (1170 5%OTUs) or 10% (866 10%OTUs) thresholds changed results significantly.
DISCUSSION
Choosing the right primer set
It is not possible to design an 18S primer set that covers all eukaryotes, excludes bacteria and simultaneously amplifies a fragment that is both taxonomically representative and has a length fit for all of the (now-defunct) 454-FLX, IonTorrent or Illumina platforms. Thus, any primer set represents a trade-off between coverage, replicability between experiments and expected sequencing depth redundancy. The general eukaryotic 18S primer sets most frequently applied in HTP sequencing studies (Blaxter et al. 1998; Amaral-Zettler et al. 2009; Creer et al. 2010) target the V4 and are 300–400 bp long. However, these are biased against important protozoan groups such as Ciliophora, Excavata and Euglenozoa. Among the 18S hypervariable regions (V1-5, V7-V9), the long V4 region has traditionally been the preferred single-region candidate for a universal eukaryotic pre-barcode (Pawlowski et al. 2012), however, the usually slightly shorter V2 has been found to reflect 18S diversity equally well across many eukaryotic groups (Blaxter et al. 1998; Ki 2012; Hadziavdic et al. 2014; Harder et al. 2016). Our set covers all of the V1-V3 regions, has an overall better taxonomic coverage across eukaryotic super-groups/phyla than the abovementioned sets, and amplifies a fragment (median length ∼550 bp) close to being within reach of the present MiSeq platform (2*300 bp). The set of Hadziavdic et al. (2014) for the V4-V5 region has no bacterial 16S DNA coverage and a reasonable eukaryotic coverage, but amplifies a fragment well outside the range of any present HTP sequencing platforms (∼650 bp). The relatively low annealing temperature we selected for a thermostable platinum/phusion polymerase-based PCR gave a relatively high amount of unspecific amplification (mostly from non-16S bacterial regions), but that can be accommodated by increasing annealing temperatures. We suggest that our primer pair is well suited for studies that truly target all eukaryotes, and especially for those targeting environments dominated by heterotrophic protozoa, which are ecologically similar but genetically vastly diverse.
Reliability of Mantel tests
Application of the Mantel test in spatial analyses has been subject to discussion (Legendre et al. 2015) because of its assumptions of linearity in spatial relationships. The partial Mantel test has a known bias towards type I errors when trying to remove the spatial autocorrelation from environmental variables (Guillot, Rousset and Harmon 2013). However, our partial mantel tests show the environmental variables not to have a significant impact on the eukaryotic community dissimilarity when corrected for the spatial autocorrelation. Furthermore, the Mantel correlogram, the reliability of which is less contested (Borcard and Legendre 2012) shows the spatial autocorrelation in the eukaryotic dataset to extend continuously over the entire distance covered in our study (Figure S3, Supporting Information). Thus, these results suggest that these known biases do not significantly impact our conclusions.
While the sequence count for some waterworks was low, the low overall diversity allowed us nonetheless to obtain a sampling reasonably close to saturation (Figure S4, Supporting Information). Though our sequencing could certainly have missed some rare, larger organisms in the filters, gastrotrichs and rotifers could be readily observed by microscopy of the filter material of all waterworks where sequence data suggested their presence. Furthermore, the sample size of Landet (filter age 6 years, total 56 386 sq) was more than four times higher than that of Hvidovre (40 years, 12 647 sq) without metazoans being observed by either method. Thus, we consider it unlikely that higher sequencing depth would fundamentally change the overall observed pattern of trophic evolution over time.
Community assembly patterns
It has been shown by several studies that microbial sand filter communities predominantly originate from the source water (Haig 2014; Gulay et al. 2016; Liu et al. 2014), and eukaryotes are able to survive in depths well below the range of our waterworks drilling depths of 10- 200 meter (Brad et al. 2008; Por et al. 2013; Borgonie et al. 2015). The presence of sequences from ectomycorrhizal fungi and trees suggests that dispersal from above is also possible, albeit likely limited. Though further direct analyses of the source water are needed to identify the exact contribution of possible eukaryotic seeding sources, the persistent spatial structure found in these communities does make aerial (homogenizing) dispersal unlikely as a major source of eukaryotic colonization, as protozoa and fungi are well able to disperse by air over distances of far beyond 250 km and usually show no spatial structure on these scales in natural or manmade ecosystems with free aerial dispersal (Rivera et al. 1992; Rogerson and Detwiler 1999; Bass et al. 2007; Zalar et al. 2011; Zalar et al. 2018). Furthermore, the problem of ‘Relic DNA’ from dead or non-metabolic organisms which may make up to 40–50% of environmental samples in soil (Carini et al. 2016) and confound the picture of whether the organisms identified actually inhabit the sampled biotope, is greatly reduced in running waters (Thomsen and Willerslev 2015), and likely further by the additional frequent backwashing.
Bacterial communities can display a relatively high degree of similarity over distances of 250 km, or a high local dissimilarity due to local environmental variation. The Astrup prokaryotic prefilter community was completely dominated by iron-oxidizing Gallionella, which were almost absent from the Astrup postfilter, whose prokaryotic community was much more similar to the Hvidovre postfilter 250 km away (Bray–Curtis difference between Astrup postfilter/Hvidovre depth sample = 0.6) than to that of the Astrup prefilter a few meters away (Bray–Curtis difference between Astrup pre- and postfilter = 0.89).
The eukaryotic community dissimilarities were overall higher and more consistently correlated with geographic distances (Figs 4 and 5). For these, the Astrup pre- and postfilters were more similar to each other than to any of the other filters (Bray–Curtis Astrup pre- and postfilter = 0.47, Bray–Curtis Astrup postfilter/Hvidovre depth sample = 0.84). This suggests that environmental filtering by differences in groundwater chemistry is a less important driver of the eukaryotic community assembly than for the prokaryotes (Albers et al. 2015a), and that differences in the source communities and dispersal limitation between aquifers play a larger role. Difference in age between filters does not correlate with Bray–Curtis dissimilarity neither in eukaryotes nor in prokaryotes (Fig. 3B and D), and age is only weakly correlated with the axes in the NMDS analysis (Table 2) compared to longitude. Thus, even as community richness must be assumed to increase with age for all filters if allowed to stay in operation for decades, our findings suggest that filters will still not converge towards more similarity in their community compositions.
Correlations of environmental and spatial variables with NMDS axes.
| All | Zealand–Funen/E Jutland | Funen/E Jutland–W Jutland | Zealand–W Jutland | |||||
|---|---|---|---|---|---|---|---|---|
| Parameter | r2 | Pr (>r) | r2 | Pr (>r) | r2 | Pr (>r) | r2 | Pr (>r) |
| age | 0.4646 | 0.013* | 0.5319 | 0.034* | 0.1479 | 0.551 | 0.5992 | 0.039* |
| BW | 0.4925 | 0.015* | 0.7067 | 0.005** | 0.5811 | 0.040* | 0.5298 | 0.08 |
| Fe (filter) | 0.4197 | 0.028* | 0.1117 | 0.542 | 0.3753 | 0.157 | 0.3907 | 0.147 |
| Mn (filter) | 0.0187 | 0.911 | 0.1226 | 0.524 | 0.3822 | 0.131 | 0.0976 | 0.716 |
| BET | 0.4407 | 0.023* | 0.1566 | 0.418 | 0.3898 | 0148 | 0.4106 | 0.125 |
| pH(w) | 0.2464 | 0.130 | 0.2331 | 0.241 | 0.748 | 0.021* | 0.5232 | 0.082 |
| dH(w) | 0.5522 | 0.006** | 0.4980 | 0.034* | 0.729 | 0.006** | 0.7564 | 0.014* |
| Ca2+(w) | 0.4145 | 0.023* | 0.3403 | 0.131 | 0.6599 | 0.018* | 0.7584 | 0.013* |
| NVOC(w) | 0.5488 | 0.005** | 0.2388 | 0.243 | 0.4018 | 0.134 | 0.8851 | 0.003** |
| Cl−(w) | 0.3835 | 0.033* | 0.4235 | 0.066 | 0.575 | 0.034* | 0.3924 | 0.156 |
| O2(w) | 0.1158 | 0.432 | 0.0457 | 0.781 | 0.4009 | 0.136 | 0.7891 | 0.008** |
| K+(w) | 0.3189 | 0.077 | 0.4927 | 0.037* | 0.1834 | 0.459 | 0.4778 | 0.106 |
| Mg2+(w) | 0.9212 | 0.001*** | 0.9378 | 0.001*** | 0.5805 | 0.034* | 0.8351 | 0.008** |
| Na+(w) | 0.3085 | 0.060 | 0.2956 | 0.174 | 0.5677 | 0.027* | 0.3812 | 0.181 |
| NO3−(w) | 0.7582 | 0.001*** | 0.6250 | 0.007** | 0.3565 | 0.182 | 0.656 | 0.028* |
| P(w) | 0.0746 | 0.590 | 0.1831 | 0.387 | 0.0578 | 0.835 | 0.0207 | 0.948 |
| SO42−(w) | 0.3317 | 0.065 | 0.3087 | 0.164 | 0.4535 | 0.068 | 0.6832 | 0.027* |
| Fe2+(raw) | 0.4036 | 0.028* | 0.0919 | 0.657 | 0.7152 | 0.016* | 0.8511 | 0.003** |
| Mn2+(raw) | 0.8422 | 0.001*** | 0.7284 | 0.002** | 0.2015 | 0.394 | 0.9237 | 0.003** |
| NH4+(raw) | 0.8660 | 0.001*** | 0.7507 | 0.003** | 0.2564 | 0.322 | 0.8702 | 0.004** |
| CH4 (raw) | 0.2645 | 0.110 | 0.1386 | 0.551 | 0.4658 | 0.102 | 0.7327 | 0.036* |
| Latitude | 0.3296 | 0.061 | 0.4230 | 0.064 | 0.1978 | 0.401 | 0.7561 | 0.010** |
| Longitude | 0.7778 | 0.001*** | 0.5944 | 0.014* | 0.6779 | 0.011* | 0.9178 | 0.004** |
The correlation of individual environmental and spatial variables with the axes in the NMDS plot (Fig. 5A). We did not add the variables as vectors to Fig. 5, as the plot became too cluttered. The only three variables that consistently correlated with the NMDS axes between regions were longitude, water hardness (dH) and magnesium (Mg), highlighted in bold. In Denmark, variations in water hardness (dH) and magnesium (Mg) are colinear with the East–West geographical distances (longitudes), but the partial Mantel tests showed that the geographical differences do not disappear when corrected for water hardness, magnesium content or other environmental variability. BET is the specific surface area (m2/g), BW = Backwashing frequency (days), NVOC = non-volatile organic compounds. (Filter) = measured from filter material, (raw) = measured in raw water, (w) = measured in treated water.
However, even though the distance–decay relationship in our eukaryotic sample was robust, distance still explained only about one-fourth of the eukaryotic β-diversity dissimilarity (Fig. 5B). More research on a larger number of waterworks and groundwater aquifer microbial communities with a higher latitudinal and environmental variation could illuminate more details on the balances between geographical and environmental factors that structure microeukaryotic community assembly in groundwater-fed sand filters.
The sand filter food web and implications for purification
Boon et al. (2011) reported that prokaryotic density and biomass may reach equilibrium on sand filters within as little as 90 days of operation. While this may be an extreme example, our filter material ages (3–40 years) did not correlate with prokaryotic diversities, and the prokaryotic communities had apparently reached stable levels of diversity and abundance. The eukaryotic communities, however, differed markedly in successional level (Fig. 4). With a trophic chain of five putative levels, the waterworks in Hvidovre (40 years) with turbellaria as top predators can be considered to be likely as close to a climax ecosystem (Fig. 4), as can be expected for sand filters, as conceivable predators on higher trophic levels known from natural freshwater systems (e.g. crustaceans, newts, fish or stag beetles) have never been shown to be able to survive in sand filters. This is consistent with a bottom-up build-up of increasing trophic complexity similar to that of groundwater and nutrient-poor freshwater (Foulquier et al. 2011) and it suggests that the time to reach equilibrium could be several decades for waterwork ecosystems.
In sterile, undisturbed soils, amoebozoans, stramenopiles and ciliates can colonize and build complex and near-stable communities within less than a year (Altenburger, Ekelund and Jacobsen 2010). The backwashing of sand filters, meant to flush out both microorganisms themselves and their food sources, is likely important for this slower build-up of microbial eukaryotic communities in waterworks as compared to soils. However, we wish to emphasize that while the phenomenon of backwashing qualitatively is a major difference between waterworks and natural soil's microbial communities, the quantitative differences in backwashing frequency (1–17 day intervals) between waterworks had no apparent effect for neither their α- nor the β-diversity differences in this study.
For operators of waterworks who wish to tune their filter to take advantage of the prokaryotic degradation of pesticides (Feld et al. 2016; Samuelsen et al. 2017), removal of inorganic compounds (Albers et al. 2015b; Palomo et al. 2016), or grazing on unwanted bacteria by protozoa or meiofauna (Haig et al. 2016), our results are obviously of high interest. Recent research in bio-augmentation shows that fungi enhance biodegradation (Knudsen et al. 2013), while protozoan grazing inhibits it (Ellegaard-Jensen, Albers and Aamand 2016). Meiofauna and higher trophic levels affects it further negatively (Näslund et al. 2010), and a high evenness of microbial communities is a general impediment to successful invasion and establishment of new species (De Roy et al. 2013). On the other hand, in a microcosm study with BAM-degrading Aminobacter added to series of 7-fold dilutions of soil diversity, Ekelund et al. (2015) found that BAM degradation was highest at their intermediate diversities rather than at both very low and very high diversities. Taken together, though every attempt of bioaugmentation will have unique organism- and site specific challenges we suggest that as a general rule, our results indicate that bioaugmentation will be most unlikely to work on older filters with more diverse and even communities (Fig. 3C) rich in meiofauna. Therefore, filter managers wishing to augment their filters with biodegrading bacteria should make an assessment of the diversity and the age of their filters, and perhaps start by changing their sand filter material, especially if it is older than 10 years where all filters we found contained meiofauna/metazoans.
Waterworks as extreme habitats for biogeography studies
For ecologists interested in extreme habitats as model systems, the study of groundwater-fed sand filters could be a resource for the study of long-term general patterns in microbial biogeography, Biogeography studies on natural extreme sites such as volcanic, CO2-rich hypoxic mofettes (Maček et al. 2016) and oligotrophic high-mountain lakes (Catalan et al. 2006; Triado-Margarit and Casamayor 2012) have shown that like macroorganisms, eukaryotic microorganisms are not always everywhere, but may display patterns of endemism across continents or regions on scales of 1000–10 000 kilometers (Catalan et al. 2006; Kammerlander et al. 2015; Filker et al. 2016). Such natural environments are rare, often inaccessible and patchily distributed, making it difficult to study effects over gradual or local distances (100–200 km)., Waterworks are ubiquitous, and a wide variety of different range of distances can be selected. Thus more microbiologists than only sand filter specialists could benefit from turning their attention to sand filter microbial ecosystems.
CONCLUSIONS
Our primer set is well suited for studies that truly target all eukaryotes, and especially for those targeting environments dominated by heterotrophic protozoa, which are ecologically similar but genetically vastly diverse. The level of unspecific amplification can be reduced by further optimization in increasing annealing temperatures.
We found filter age to be the most significant determinant of a high eukaryotic (but not prokaryotic) species richness/α-diversity (Fig. 5B and C), and filter operators might wish to change their material at shorter intervals (∼10 years) than the often used 25–40 years if they wish to limit the eukaryotic diversity. Differences in b-diversity, however, correlated with geography and not with age or other environmental parameters, suggesting that filters draw from geographically distinct aquifer communities. Waterworks' sand filters can provide a rare empirical example of how geographical distance can contribute to shaping micro-eukaryotic communities even over shorter, local/regional distances (100–250 km) in an extreme habitat where dispersal is limited. Compared to the only 2.6% unassignable sequences/30% OTUs in the marine eukaryotic microbiota in the TARA oceanic expeditions (de Vargas et al. 2015), our high number (25%) of unassignable sequences (11.7% of OTUs; Table S3, Supporting Information) support the notion that groundwater is one of the most poorly explored parts of the biosphere, even as it contains 97% of Earth´s unfrozen freshwater resources (Fišer, Pipan and Culver 2014), and might harbor numerous undescribed species, families and even orders/classes of microbial taxa.
DATA AVAILABILITY
Sequence data, mapping file and environmental data can be accessed from NCBI, BioProject PRJNA352908, BioSample SAMN06006784. OTU tables, geography matrices, RaxML tree and R-scripts for all analyses can be obtained from the corresponding author upon request.
ACKNOWLEDGEMENTS
We thank Thomas Darwin Curtis, Mathis Hjort Hjelmsøe, Ole Hylling and Anja Toft for assistance in testing the primers, Pia Bach Jakobsen for DNA extraction and Karin Vestberg for technical assistance with the pyrosequencing, and above all the water companies HOFOR, Tre-For, Esbjerg Vand, VandCenterSyd and Svendborg Vand for allowing and assisting us when sampling from their filters.
FUNDING
This work was supported by the Danish Council for Strategic Research grant (2104080012, MIRESOWA (MIcrobial REmediation of SOil and WAter) at the time of the practical work. FE was furthermore funded by the Danish Council for Independent Research (DFF400200274).
AUTHOR CONTRIBUTIONS
All authors planned and designed research. CBH, CNA and LEJ did the sampling and the laboratory work. CBH analyzed results. CBH wrote the draft, and all other authors assisted in writing the paper.
Conflicts of interest. None declared.
