


Abstract
Aerobic anoxygenic phototrophic bacteria may play a particular role in carbon cycling of aquatic systems. However, little is known about the interaction between aerobic anoxygenic phototrophic bacteria and hydrochemistry in groundwater-surface water exchange systems of subtropical karst catchments. We carried out a detailed study on the abundance of aerobic anoxygenic phototrophic bacteria and bacterioplankton, hydrochemistry and taxonomy of bacterioplankton in the Maocun watershed, Southwest China, an area with karst geological background. Our results revealed that bacteria are the important contributors to total organic carbon source/sequestration in the groundwater-surface water of this area. The aerobic anoxygenic phototrophic bacteria, including β-Proteobacteria, also appear in the studied water system. In addition to that, the genus Polynucleobacter of the phototropic β-Proteobacteria shows a close link with those sampling sites by presenting bacterial origin organic carbon on CCA biplot and is found to be positively correlated with total nitrogen, dissolved oxygen and pH (r = 0.860, 0.747 and 0.813, respectively) in the Maocun watershed. The results suggest that Polynucleobacter might be involved in the production of organic carbon and might act as the negative feedback on global warming.
INTRODUCTION
In karst aquatic systems, total organic carbon (TOC) is usually considered to originate from aquatic plant via photosynthetic uptake of dissolved inorganic carbon (DIC) derived from carbonate weathering (Liu et al.2017). However, the contribution of aerobic anoxygenic phototrophic bacteria (AAPB), a major group of photosynthetic microorganisms, to TOC sequestration is ignored (Curl 2012; Looman et al.2016). These bacteria are widely distributed in nature, especially in aquatic habitats, with the capability of harvesting light energy and a particular role in carbon cycling (Goericke 2002; Schwalbach and Fuhrman 2005). Consequently, their rapid utilization of a variety of substrates and energy sources (including light), as well as their large and fast growth, significantly contribute to secondary production for aquatic carbon cycling (Koblížek 2015). In this respect, the above findings in turn give rise to the following questions, concerning: (i) the main source of TOC in unpolluted groundwater-surface water exchange systems of subtropical karst catchments (the Maocun watershed, Southwest China); (ii) the distribution and the abundance of AAPB in karstic and non-karstic water systems; (iii) the contribution of AAPB to aquatic TOC pool in karst catchments.
In the previous studies (Koblížek 2015; Huang et al.2016), AAPB was found in six bacterial phyla, including Proteobacteria (purple anoxygenic phototrophs), Chlorobi (green sulfur bacteria), Chloroflexi (green non-sulfur bacteria), Firmicutes (heliobacteria), Acidobacteria and Gemmatimonadetes. The Proteobacteria account for more than 40% of all validly published AAPB (Kersters et al.2006). Moreover, the pufM gene sequences, encoding the M subunit of the photosynthetic reaction center, originate exclusively from Proteobacteria, which usually comprise the α-, β- or γ- Proteobacteria (Achenbach, Carey and Madigan 2001). Although, the evolution, diversity and ecology of AAPB have been reported in the oceans (Rathgeber, Beatty and Yurkov 2004; Zhang et al.2016), freshwater lakes (Cepáková et al.2016; Huang et al.2016; Ferrera et al.2017; Song et al.2017) and rivers (Waidner and Kirchman 2005; Hirose, Matsuura and Haruta 2016), they were not known in groundwater-surface water exchange systems located in subtropical karst regions (Li and Jin 2016). Groundwater-surface water exchange systems as linked components of a hydrologic continuum affect recharge–discharge processes, whose ecological integrity depends on the subsurface and surface-water ecosystems (Sophocleous 2002). To better understand the ecological roles of AAPB and the relationship with hydrochemistry in the groundwater-surface water exchange system of the subtropical karst catchments (the Maocun watershed, Southwest China), it is necessary to explore AAPB abundance and taxonomy. In this respect, AAPB and bacterioplankton based on pufM gene and the V3 region of 16S rRNA gene were detected in our study by using real-time PCR (Schwalbach and Fuhrman 2005; Du et al.2006; Kirchman, Cottrel and DiTullio 2017) and environmental genomics (Yutin et al.2007; Ávila et al.2017).
MATERIALS AND METHODS
Study area
The Maocun watershed (Guilin, Guangxi Zhuang Autonomous Region; Fig. 1) (25°10'11"–25°12΄30″ N, 110°30΄00″–110°33΄45″ E), located in the subtropical region of Southwest China, is about 10 km2 and comprises different geological areas such as sand-shale stone area, dolomite area, quaternary sand and clay area, and limestone area. The groundwater-surface water from tree-like river networks with different geological characters in the Maocun watershed collected at the Maocun outlet (MC) and water levels change from 40 to 60 cm. All groundwater-surface water from rain to ground or spring, reducing food supply for bacteria, was classified as oligotrophic water (Zhao and Gu 2011). Moreover, the Maocun watershed is located in a half-hidden or sheltered state due to the existing subtropical vegetation.
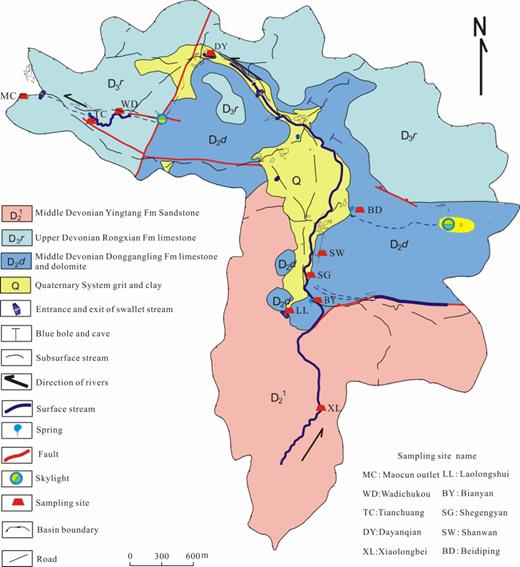
Hydrogeological map of the Maocun watershed marked with the sampling sites.
In the tree-like river networks of the Maocun watershed, the MC within the limestone area (the last outlet of this watershed) comprises the surface and underground flows from the Xiaolongbei river to the MC. The water from the Xiaolongbei river (XL) of the Maocun watershed originates from a sand-shale stone area. The Laolongshui river (LL) originates from a cave flow and the water of the Bianyan river (BY), located in the dolomite area, originates from a sand-shale stone area. Shegengyan (SG) is the first outlet of the subflow in the Maocun watershed. Beidiping (BD) is located at the surface flow of the dolomite area, which originates from the quaternary sand and clay area. Shanwan (SW) and Dayanqian (DY) are the second and third outlet of the subflow in the dolomite area. Wadichukou (WD) is the fourth outlet of the subflow and Tianchuang (TC) is the surface flow, which are located on the ground surface within the limestone area.
Sampling
At each sampling site, the subsurface water (at least 3 L) was filtered in situ for DNA extraction from bacterioplankton sample in September 2015. The water sample was first pre-filtered using 3 μm pore filter membrane, and second filtered through 0.22 μm pore filter membrane (Whatman, UK). Finally, 10 samples were obtained and then stored at −80°C until further processing.
The hydrochemical parameters of the water samples were analyzed in situ and in the laboratory (Table 1). Water temperature, pH, turbidity, conductivity and dissolved oxygen (DO) were determined in situ using a multiprobe sensor (YSI, USA). In situ HCO3− and Ca2+ concentrations of the water samples were determined by titration using the Aquamerck alkalinity and Hardness test kit (Merck Millipore, Germany). The samples for total nitrogen (TN) and TOC were stored in the gray bottles, supplemented with HgCl2 to kill microbes and analyzed in the laboratory using a multi N/C® 3100 TOC analyzer (Analytik Jena AG, Germany). δ13C is usually measured as an indicator of carbon flow in aquatic ecosystems (Fry and Sherr 1989); consequently, δ13C-TOC was detected in the Institute of Karst Geology, CAGS, by using the Delta V Plus (GSIMS) combined with the Gas Bench automated apparatus (Thermo Company, USA); the error of analysis was better than 0.2 ‰ (1σ). The results are expressed in δ13C relative to the PDB standard.
Hydrochemical parameters of the water samples.
| Site | TOC | TN | DO | Ca2+ | HCO3− | T | Conductivity | Turbidity | C/N | pH | δ13C-TOC |
|---|---|---|---|---|---|---|---|---|---|---|---|
| mg/L | mg/L | mg/L | mg/L | mmol/L | °C | μS/cm | NTU | ‰ | |||
| MC | 2.19 | 2.34 | 8.86 | 69.33 | 3.86 | 20.03 | 383.40 | 1.19 | 1.33 | 7.65 | −27.15 |
| TC | 2.07 | 2.16 | 9.32 | 66.00 | 3.45 | 20.34 | 360.03 | 0.84 | 1.23 | 8.30 | −25.92 |
| WD | 2.25 | 2.30 | 9.20 | 86.33 | 3.65 | 20.29 | 369.97 | 0.62 | 1.31 | 8.18 | −25.78 |
| DY | 2.31 | 2.28 | 8.18 | 68.67 | 3.55 | 20.99 | 366.01 | 0.99 | 1.25 | 7.65 | −26.65 |
| BD | 3.98 | 0.53 | 7.49 | 97.67 | 5.72 | 19.90 | 516.23 | 2.34 | 11.70 | 7.25 | −26.09 |
| SW | 2.25 | 0.56 | 7.27 | 41.33 | 2.48 | 19.83 | 268.50 | 1.77 | 4.24 | 7.40 | −25.25 |
| SG | 2.34 | 0.26 | 6.97 | 43.40 | 2.77 | 20.08 | 262.37 | 1.03 | 10.22 | 7.51 | −23.76 |
| BY | 1.29 | 0.22 | 7.04 | 27.33 | 0.98 | 20.91 | 133.80 | 0.54 | 6.02 | 6.94 | −26.14 |
| LL | 1.94 | 0.30 | 8.21 | 42.03 | 3.41 | 19.26 | 296.80 | 1.15 | 8.38 | 7.17 | −26.78 |
| XL | 1.07 | 0.24 | 8.73 | 6.27 | 0.28 | 20.44 | 16.63 | 0.82 | 3.48 | 7.30 | −26.93 |
T, water temperature. MC, TC, WD, DY, BD, SW, SG, BY, LL and XL are the sampling sites.
DNA extraction and 16S rRNA sequencing
DNA extraction was performed using the Power Water DNA Isolation Kit (Mobio Laboratories, Inc., Carlsbad, CA, USA) following the manufacturer's instructions.
For Hiseq sequencing, PCR primers 515f and 909r were used to amplify the V3 region of 16S rRNA genes (Tamaki et al.2011), which was performed using the 100-bp paired-end strategy on the Illumina HiSeq 2000 platform (Illumina Inc., San Diego, CA, USA) at the Chengdu Institute of Biology, Chinese Academy of Sciences.
Quantitative PCR for pufM gene and 16S rRNA gene
The real-time PCR assay of the pufM gene, as a marker for AAPB and of the 16S rRNA gene, as a marker of bacterioplankton, was carried out in a volume of 25 μL. The assay mixture contained 12.5 μL Green-2-Go qPCR Mastermix (Sangon Biotech Co., Ltd, China), 1 μL of primer (10 μmol/μL), 9.5 μL of distilled water and 1 μL of template DNA (at 5 ng/μL). Thermal cycling conditions for the pufM gene were as follows: an initial cycle of 94°C for 5 min; 30 cycles of 94°C for 60 s and 53°C for 60 s, 72°C for 60 s and 72°C for 10 min. Thermal cycling conditions for 16S rRNA gene were as follows: an initial cycle of 95°C for 3 min; 39 cycles of 95°C for 60 s and 56°C for 60 s, 72°C for 60 s and 72°C for 5 min. The following primers were used. The primers for pufM gene were pufM-557f (5΄-CGCACCTGGACTGGAC-3΄) and pufM-750r (5΄-CCCATGGTCCAGCGCCAGAA -3΄). The primers for 16S rRNA gene were 338f (5΄-CCTACGGGAGGCAGCAG-3΄) and 518r (5΄-ATTACCGCGGCTGCTGG-3΄). Thermal cycling, fluorescent data collection and data analysis were carried out with CFX96 Touch Real-Time PCR Detection System (Bio-Rad, USA) according to instruction manual. The relationship between Ct and log starting concentration was linear (R2 > 0.99). The amplification efficiency was 90%–105%.
Statistical analyses
The data of bacterial 16S rRNA sequencing were processed according to Ávila et al. (2017) and summarized in Table S1 (Supporting Information).
For each sample, quantitative PCR was performed three times for each gene. Replicate results of quantitative PCR measurements were averaged (n = 7), and the standard error was calculated. The quantitative PCR results are summarized in Table S2 (Supporting Information).
Correlation analyses were performed using the Pearson correlation method with significance defined as P < 0.05. Statistical analyses were performed using SPSS 13.0 software for Windows XP (IBM, Armonk, NY, USA). The computer program, CANOCO for Windows 4.5 was used to compute canonical correspondence analysis (CCA) and principal component analysis (PCA) to explain the contribution of each influencing factor.
RESULTS AND DISCUSSION
Hydrochemical characteristics of Maocun watershed
Hydrochemical facies are water masses that have different geochemical attributes and are helpful for comparing the water origin and distribution (Sahu and Sikdar 2008). The hydrochemical characteristics in the Maocun watershed are listed in Table 1. By comparing the hydrochemical facies, it was found that the XL water sample has low conductivity, Ca2+ and HCO3− due to its sand-shale stone background. BY originates from a sand-shale stone area and flows through a carbonate area. Accordingly, the pH, Ca2+, HCO3− and conductivity of BY are 6.94, 27.33 mg/L, 0.98 mmol/L and 133.80 μS/cm, respectively, as a result of the mixed effects from soil CO2 and water dilution in the carbonate area (Liu et al.2007). Moreover, under the impact of quaternary sand and clay, the Ca2+, HCO3− and conductivity in BD are 97.67 mg/L, 5.76 mmol/L and 516.23 μS/cm, respectively. The hydrochemical facies at the other sampling sites reflect the effects of the carbonate weathering on water chemistry.
The dissolved organic carbon in unpolluted groundwater or surface water is typically low (Laiz et al.1999; Levy 2007; Simon, Pipan and Culver 2007). To trace the carbon source and answer our first question, the δ13C and C/N ratios of TOC were analyzed. Some studies have suggested that freshwater algae have δ13C values between −26‰ and −30‰ in C3-dominated environments (Meyers 1994) and δ13C values ≤16‰ in C4-dominated environments (Chivas et al.2001). The δ13C values for bacteria range from −12‰ to −27‰, depending on their origin (Coffin et al.1989); the soil organic matter has δ13C values ranging from −22‰ to −25‰ (Goñi, Teixeira and Perkey 2003). C/N is usually analyzed alongside δ13C and provides a further indication on the relative contributions of organic matter sources (Lamb, Wilson and Leng 2006). Bacteria, algae and soil organic matter have low C/N ratios of < 5, 5–10 and 10–13 respectively (Meyers 1994; Tyson 1995; Kendall, Silva and Kelly 2001; Lamb, Wilson and Leng 2006), which are distinct from those of terrestrial vegetation. From Fig. 2, it can be concluded that the main source of TOC in MC, TC, WD, DY, SW and XL is the product of the metabolism of many bacteria, while the main source of TOC in BY, BD and LL is contributed by algae, and the main source of TOC in SG is from soil organic matter. Consequently, this result supports our first question that besides of photosynthesis products by aquatic plant via photosynthetic uptake of DIC and soil organic matter, bacteria make also an important contribution to TOC sequestration in the karst aquatic system.
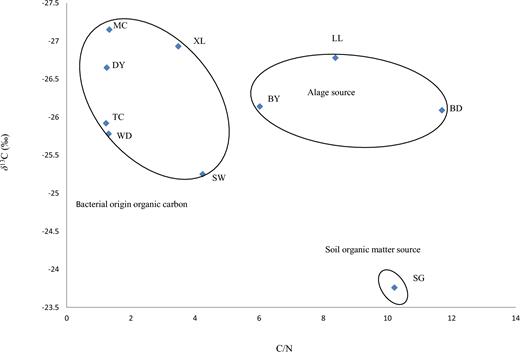
Distinctive source combination of C/N ratios and δ13C values from water samples at the Maocun watershed. MC, TC, WD, DY, BD, SW, SG, BY, LL and XL are the sampling sites.
The abundance of AAPB and bacterioplankton
Previous studies suggest that AAPB are significant for productivity of freshwater ecosystems (Salka et al.2011). However, their abundance remained largely unknown in the groundwater-surface water exchange systems of subtropical karst catchments. In our study, the abundance of AAPB in the Maocun watershed varies from 4.01 × 10² to 6.59 × 10⁴pufM gene copies/mL and the abundance of bacterioplankton varies from 4.00 × 10⁵ to 7.14 × 10⁷ 16S rRNA copies/mL (Table S2, Supporting Information). The abundance of AAPB and of bacterioplankton in LL, BY and BD is low, as shown by the C/N ratios and δ13C values. The higher abundance of bacterioplankton in SG is related to the TOC source contributed by high-soil-organic-matter soil with high microbial biomass (Yao et al.2000). In addition, PCA biplot was performed to investigate which sampling site is closely linked to the abundance of AAPB and of bacterioplankton (Fig. 3). From Fig. 3, it can be seen that AAPB and bacterioplankton show a small angle (significant correlation, r = 0.96) and maintain the close ties with the sampling environment, which supports the answer to our first question that bacteria including AAPB are the plausible sources of TOC to karst aquatic systems at the Maocun watershed.
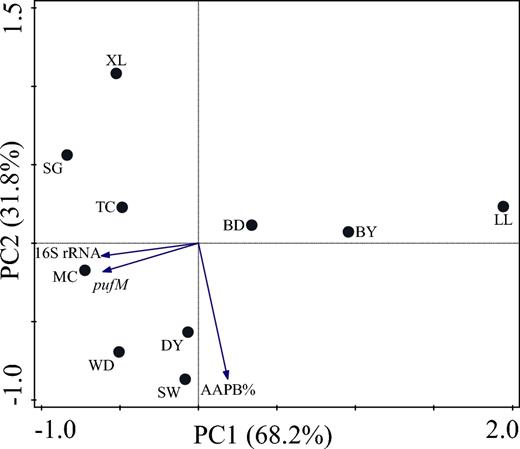
PCA biplot of sampling site and environmental variables at the Maocun watershed. MC, TC, WD, DY, BD, SW, SG, BY, LL and XL are the sampling sites.
Moreover, the percentage of AAPB (AAPB%) in the abundance of total bacterioplankton varies from 0.06% to 0.12% (Table S2), which is less than the percentage in the East China Sea (from 0.5% to 11.6%) (Zhang and Jiao 2007), the Indian Ocean (3.79 ± 1.72%) (Jiao et al.2007), the Pacific Ocean (1.08 ± 0.74%) (Jiao et al.2007), the Crater Lake (from 0.85% to 38.06%) (Chen et al.2012) and the Wulixia karst reservoir (from 1.33% to 1.60%) (Song et al.2017). Dim light as a supplement to energy supply in oligotrophic environment affects the genetic diversity and population structure of AAPB (Zeng, Shen and Jiao 2009); consequently, the AAPB% in the Maocun watershed is low. Although no significant correlation between AAPB and hydrochemical characters, except for pH, was found in our study, the AAPB are mainly present in the sampling sites of MC, TC, WD, DY, SW and XL on the PCA biplot (Fig. 3). In this respect, it was supposed that due to their rapid growth (Koblížek et al.2007; Koblížek 2015), AAPB were likely to be larger sinks for dissolved organic matter than their percentage in our study.
Taxonomy and distribution of bacterioplankton
Of all the reads, most sequences based on the V3 region of 16S rRNA tag of bacterioplankton were assigned to 13 phyla (Table S1). In agreement with previous findings from freshwater lakes (Newton et al.2011; Ávila et al.2017), it was found that Bacteroidetes and Proteobacteria dominate the bacterioplankton communities (mean relative frequency varies from 86.8% to 99.9%) and Proteobacteria are the most prevalent phyla in the Maocun watershed (Fig. 4A), suggesting that they may play a fundamental role in the dim light and oligotrophic environments of the Maocun watershed.
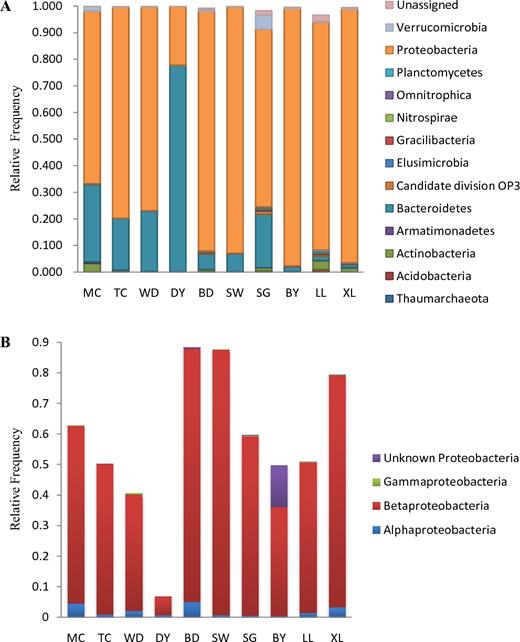
(A) Phyla level of taxonomy and distribution based on the V3 region of 16S rRNA tag of bacterioplankton communities and (B) the relative frequency of α-, β- and γ- and unknown Proteobacteria at the Maocun watershed. MC, TC, WD, DY, BD, SW, SG, BY, LL and XL are the sampling sites.
Moreover, some studies have suggested that AAPB in freshwater belong to Proteobacteria and pufM sequences originate exclusively from α-, β- and γ-Proteobacteria in the environment (Kersters et al.2006). In this respect, the Hiseq sequencing of the V3 region of 16S rRNA tag of Proteobacteria was analyzed. It was found that the α-, β- and γ- and unknown Proteobacteria are present in the Maocun watershed, although their relative frequencies are different in different sampling environments (Fig. 4B). To better understand the role of Proteobacteria, a heat map of the 21 most abundant operational taxonomic units(OTUs) was plotted for all 10 samples collected in the Maocun watershed (Fig. 5). By the closest matches, β-Proteobacteria (OTUs 17) were revealed in the resulting heat map, which displays the accordance with the observed δ13C and C/N ratios of TOC as well as the AAPB abundance in the Maocun watershed, as seen in Figs 2, 3 and 5. The functionality of the β-Proteobacteria has been demonstrated that they are the important phototrophic bacteria in freshwater (Zehr et al.2003) and karstic lakes (Casamayor et al.2012) and significantly contribute to TOC incorporation in karstic lakes (Casamayor et al.2012). Moreover, in a previous report from Casamayor et al. (2012), a contribution of β-Proteobacteria to carbon fixation close to 19% has been reported in five stratified lakes of NE Spain, due to their high rates of non-photosynthetic dark carbon fixation.

Heat map illustrating the relative frequency of the 21 most abundant OTUs based on the V3 region of 16S rRNA sequences at the Maocun watershed. MC, TC, WD, DY, BD, SW, SG, BY, LL and XL are the sampling sites.
Moreover, the relationship between the genera in Proteobacteria and the hydrochemical characteristics at the Maocun watershed was investigated using the software CANOCO for Windows 4.5; consequently, the CCA biplot is shown in Fig. 6. Polynucleobacter of β-Proteobacteria as the phototrophic bacteria show a very good relationship with the bacterial origin organic carbon of TOC in MC, TC, WD and DY from the Maocun watershed, which are positively correlated with TN, DO and pH (r = 0.860, 0.747, 0.813, respectively) and negatively correlated with C/N (r = −0.707). In the groundwater-surface water exchange system of the subtropical karst catchments, pH, TN and DO maybe the key factors driving the diversity and abundance of AAPB in the environment (Feng et al.2014). Although Novosphingobium, Methylophilaceae (Other) and Gammaproteobacteria (Other) are also distributed in MC, TC, WD and DY of the Maocun watershed, they show no significant correlation with hydrochemical characteristics. This result indicates that Polynucleobacter significantly contributes to the organic carbon sequestration in this ecosystem; consequently, it provides the answer to our third question that aerobic anoxygenic phototrophic bacteria may play a particular role in the production of organic carbon at the groundwater-surface water exchange system of the subtropical karst catchments investigated in this study.
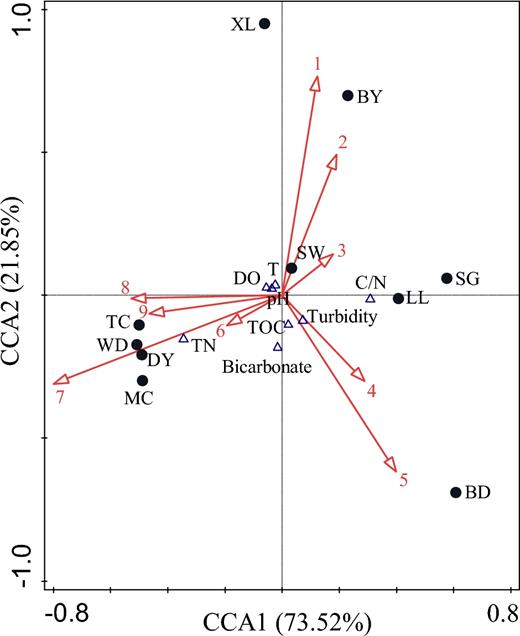
CCA biplot of the genera in Proteobacteria and the hydrochemical characteristics of the Maocun watershed. T, water temperature; 1, Variovorax; 2, Proteobacteria (Other); 3, Rhodobacteraceae (Other); 4, Comamonadaceae (Other); 5, Defluviimonas; 6, Methylophilaceae (Other); 7, Polynucleobacter; 8, Novosphingobium; and 9, Gammaproteobacteria (Other). MC, TC, WD, DY, BD, SW, SG, BY, LL and XL are the sampling sites.
In conclusion, our results show that aquatic plants via photosynthetic uptake of DIC are not the only contributors to TOC source in the karst aquatic system. In this water system, bacteria, algae and soil serve as the contributors to TOC source, which are strongly influenced by the environment and geological background. The abundance of AAPB, including the genera of Polynucleobacter, among the bacteria contributing to the production of organic carbon at the sampling sites shows that AAPB can form a larger sinks for dissolved organic matter due to their rapid growth and photoheterotrophic characteristics; consequently, AAPB will alter the carbon and nitrogen cycle in the aquatic system (Koblížek 2015). Our findings suggest that Polynucleobacter might be involved in the production of organic carbon and acts as a negative feedback on global warming. In addition, our findings also provide the basis for further research on AAPB as a non-negligible factor relating to the argument proposed by Curl (2012) that carbon is shifted or sequestered in CO2-water-carbonate rock system. In this regard, the function of AAPB will lead to a new question whether recalcitrant dissolved organic carbon contributed by bacterial-derived organic carbon exists in karst aquatic system.
SUPPLEMENTARY DATA
Supplementary data are available at FEMSEC online.
FUNDING
This work was supported by the National Science Foundation of China [41641026 and 41361054], the National Science Foundation of Guangxi Province [2015GXNSFGA139010 and 2014GXNSFCA118012] and the Fundamental Research Funds for CAGS [YYW F201505 and YW F201401].
Conflict of interest. None declared.
