


Abstract
Aminobacter sp. MSH1 is of interest for bioaugmentation of biofiltration units in drinking water treatment plants (DWTPs) due to its ability to degrade the groundwater micropollutant 2,6-dichlorobenzamide (BAM). Using a continuous flow chamber biofilm model, MSH1 was previously shown to colonize surfaces and degrade BAM at trace concentrations as low as 1 μg/L under the oligotrophic conditions found in DWTPs. In DWTP filtration units, MSH1 has to compete with the resident biofilm microbiota for space and nutrients. Using the same model, we examined how a sand filter community (SFC) affects MSH1's BAM-degrading activity and biofilm formation under C- and N-limiting conditions when fed with trace concentrations of BAM. MSH1 was inoculated simultaneously with the SFC (co-colonization mode) or after the SFC formed a biofilm (invasion mode). MSH1 successfully established in the SFC biofilm showing growth and activity. In co-colonization mode, MSH1 decreased in number in the presence of the SFC and formed isolated colonies, while specific BAM-degradation activity increased. In the invasion mode, MSH1 also decreased in numbers in the presence of the SFC but formed mixed colonies, while specific BAM degradation was unaffected. Our results show that MSH1 invades and performs successfully in an SFC biofilm under the oligotrophic conditions of DWTPs.
INTRODUCTION
2,6-dichlorobenzamide (BAM) is a transformation product of the widely used herbicide dichlobenil and is a major groundwater micropollutant hampering drinking water production from groundwater in European countries. Typically reported concentrations in groundwater are between 0.1 and 1 μg/L BAM (Björklund et al.2011) and hence often exceed the EU threshold limit (EU 1998) of 0.1 μg/L for drinking water. Extraction wells that produce BAM-contaminated groundwater are either closed or the water needs to be treated in drinking water treatment plants (DWTPs) by introducing expensive techniques such as granular activated carbon filtration or ozonization (Hernández-Leal et al.2011). Bioremediation is suggested as a green alternative for micropollutant removal in DWTPs (Benner et al.2013; Vandermaesen et al.2016). Specialized bacterial strains have been reported that use micropollutants as carbon and energy source (Sørensen et al.2007; Sørensen, Simonsen and Aamand 2009; Horemans et al.2013), and they represent strains of interest for bioaugmentation in filtration units of DWTPs for pesticide removal. In case of BAM-contaminated groundwater, the use of the BAM-degrading Aminobacter sp. MSH1 was suggested (Albers et al.2015). MSH1 is an aerobic soil isolate that uses BAM as sole source of carbon, nitrogen and energy (Sørensen et al.2007). Bioaugmentation-assisted bioremediation of micropollutant-contaminated groundwater in DWTPs is, however, highly challenging compared to that of matrices containing high pollutant concentrations since trace concentrations of an organic pollutant will only deliver a limited amount of energy and carbon for the strain to grow on and maintain itself in the system (Schwarzenbach et al.2006). Indeed, a recent pilot scale study in which MSH1 was used as inoculum in rapid sand filters for treatment of BAM-contaminated intake water suggested that organic carbon other than BAM functioned as the main carbon and energy source (Albers et al.2015). This was recently confirmed by growing MSH1 in monoculture in a continuous flow chamber biofilm model fed with various BAM concentrations including a concentration as low as 1 μg/L (Sekhar et al.2016). In that study, surplus growth of MSH1 on BAM was only observed with BAM feed concentrations of 100 μg/L and higher. At lower BAM concentrations, MSH1 biomass formation did not differ between systems receiving a feed without BAM and with BAM suggesting that uncharacterized assimilable organic carbon (AOC) in the water was the main C-source. Operational DWTP biofiltration units such as sand filters, however, contain a complex indigenous biofilm microbial community that is considered to be composed of microbiota specialized in surviving in this extreme oligotrophic environment (Gulay et al.2016). Indigenous heterotrophic bacteria in the sand filter will compete strongly for the limited available AOC and nutrients with the introduced bacterium and hence might affect activity and maintenance of strain MSH1 in such systems. To further improve our understanding of the impact of the oligotrophic environment of DWTPs on the long-term establishment and activity of micropollutant-degrading organisms for bioremediation of polluted intake water in DWTPs, we determined the impact of a DWTP sand filter bacterial community (SFC) on the survival and BAM-degradation activity of MSH1 under C- and N-starvation conditions in the same biofilm model used in the study of Sekhar et al. (2016). A green fluorescent protein (GFP)-labeled variant of strain MSH1 (MSH1-GFP) was inoculated in flow cells either simultaneously with an SFC originating from a DWTP or after the SFC had formed a biofilm on the glass support of the flow cell (Figure 1) allowing to examine co-colonization and invasion, respectively. The flow cell systems were irrigated with a C- and N-limited medium without BAM and BAM added at concentrations of either 1 μg/L or 1 mg/L, representing trace and macropollutant BAM concentrations, respectively. The BAM-degrading activity in the systems was monitored and at the end of the experiment, confocal laser scanning microscopy (CLSM) allowed to trace MSH1-GFP biofilm occupation.
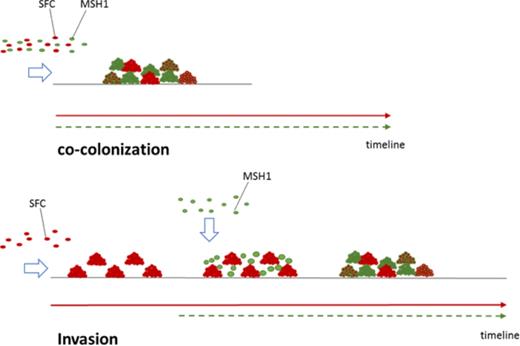
Schematic overview of the biofilm experiments performed in this study either according to the co-colonization mode (MSH1-GFP inoculated simultaneously with the SFC) or invasion mode (MSH1-GFP inoculated in flow channels already occupied by the SFC biofilm).
MATERIAL AND METHODS
Bacteria and SFC preparation
The GFP-labeled variant Aminobacter sp. MSH1-GFP (Sekhar et al.2016) was grown on R2A (Reasoner and Geldreich 1985) plates for 4 days at 25°C, and a streak of colonies was transferred to R2B amended with 200 mg/L BAM and grown for 1–2 days (25°C, 100 rpm). MSH1-GFP cells were harvested in the exponential phase (optical density at 600 nm (OD600) of 0.4) by centrifugation (6000× g, 15 min, 15°C), washed three times with 10 mM MgSO4 and finally resuspended in 10 mM MgSO4 at an OD600 of 0.25. The used SFC originated from a sample collected from an operational rapid sand filter unit of a DWTP located in Sinaai (Belgium). The sample was stored at 4°C and used within 1 month. The community was extracted by suspending 5 g of sand filter material in 20 mL MS in a 100 mL Erlenmeyer flask. The flask was vortexed for 1 min and shaken at 27°C at 100 rpm for 24 h. The sand filter material was allowed to precipitate for 30 min after which 10 mL of the upper aqueous phase was collected. Cell density in the SFC extract was determined using a Helber-counting chamber and an Olympus BX51 microscope (Olympus, Japan). The extract was diluted with 10 mM MgSO4 to yield a final cell density of 2.5 × 10⁸ cells/mL.
Flow channel experiments
Biofilm experiments were performed using the three-channel flow chamber setup described by Weiss Nielsen et al. (2011). The flow chamber channels were sterilized by filling the channels with a 0.5% sodium hypochlorite (Acros Organics, Geel, Belgium) solution for 3 h and subsequent rinsing with sterile ultrapure water (Milli-Q®, Merck, Germany). The channels were then filled with the appropriate medium. The pump was stopped, the flow chamber was turned upside down and 300 μL of MSH1-GFP and/or SFC cell suspensions in 10 mM MgSO4 were injected. When co-colonization was assessed, nine flow channels were inoculated with a mixture of SFC and MSH1-GFP (2 × 10⁷ cells each/channel), nine flow channels with the SFC (2 × 10⁷ cells/channel) and nine flow channels with MSH1-GFP (2 × 10⁷ cells/channel). Cells were allowed to adhere for 1 h before the flow was initiated at 3.5 mL/h using a peristaltic pump (Watson Marlow 205S). When invasion of MSH1-GFP in the sand filter biofilm was assessed, 18 flow channels were inoculated with the SFC (2 × 10⁷ cells/channel) and nine flow channels were not inoculated. The flow was initiated at 3.4 mL/h as described above. After 20 days of operation, nine flow channels inoculated with the SFC were harvested for CLSM analysis. The remaining nine flow channels inoculated with the SFC and the other nine channels, which had not been inoculated, were inoculated with MSH1-GFP (2 × 10⁷ cells/channel) by injection as described above. After 1 h, flow was resumed. In all cases, triplicate flow channels were fed with MS medium amended with either 1 μg/L BAM, 1 mg/L BAM or no BAM. All conditions were operated in triplicate. For each feed condition, one non-inoculated flow channel was included as control to assess abiotic removal. At the end of the experiment, all remaining flow chambers were harvested for CLSM analysis. One-milliliter samples of both the influent and the effluent of the flow channel systems were taken regularly in 2 mL vials containing 5 μL of 37% HCl to stop bacterial activity. The samples were directly centrifuged at 10 000× g for 10 min at 20°C and 900 μL was transferred to glass vials for determining BAM concentrations as described below.
CLSM analysis and biofilm biomass calculations
Cells in the flow channels were stained by injecting 250 μL of a 100 nM SYTO® 62 Red Fluorescent Nucleic Acid stain (Molecular Probes, Thermo Fischer Scientific, San José, USA) solution. The channels were analyzed on an Olympus IX70 inverted microscope with a Fluoview FV500 confocal scanning unit (Olympus, Japan). GFP and SYTO® 62 signals were collected sequentially. GFP was visualized using the 488 nm laser for excitation in combination with a 494–520 nm band pass emission filter and SYTO® 62 using the 633 nm laser combined with a 660 nm long pass emission filter. The flow channels were examined for biomass occurrence and distribution over the length of the flow cell, and since homogenous distribution was recorded under all conditions, images for biofilm visualization were only captured in the first 20 mm of the channels at three positions at 1 μm increments (512 × 512 pixel frame; 0.414 μm pixel size) with a 60× oil immersion UPL SAPO x60/1.35 objective (Olympus, Japan). Imaris 7.2 software (Bitplane, USA) generated 3D projections of the CLSM image stacks.
Determination of BAM concentrations
BAM concentrations higher than 5 μg/L were determined with reverse phase UHPLC (Nexera, Shimadzu) as described (Sekhar et al.2016) using an injection volume of 10 μL. Limits of detection (LOD) and quantification (LOQ) were 1 and 3 μg/L, respectively. BAM concentrations lower than 5 μg/L were determined with a UHPLC-MS/MS (Thermo Scientific, USA) consisting of an Accela pumping system coupled with a triple quadrupole mass analyzer (TSQ Vantage) as described (Sekhar et al.2016). LOD and LOQ for BAM were 1 and 5 ng/L, respectively.
Data analysis
BAM-degradation rates (μg BAM/min) were calculated by multiplying EffBAM with the influent BAM mass flow rate (μg BAM/min) that was calculated as the influent BAM concentration (μg BAM/L) multiplied with the flow rate (5.8 × 10⁻⁵ L/min). Total and MSH1-GFP biovolumes were calculated using COMSTAT1 (Heydorn et al.2000). Total biofilm biomass (μm3;/μm2;) was calculated as the combined voxels of the SYTO® 62-stained biomass and GFP-labeled biomass, and MSH1-GFP biofilm biomass (μm3;/μm2;) was calculated as the voxels of the GFP-labeled biomass. Total MSH1-GFP cell numbers were estimated by dividing the total GFP-labeled biovolume in the flow channel (μm3;) with the MSH1-GFP cell volume (0.37 ± 0.04 μm3;/cell) as described (Sekhar et al.2016). Specific BAM-degradation rates (μg BAM/cell/min) at the end of the experiment were estimated by dividing the BAM-degradation rate (μg BAM/min) by the total MSH1-GFP cell numbers in the flow channel. Significant differences between BAM-degradation efficiency, total biofilm biomass, relative MSH1-GFP abundance, total MSH1-GFP cell numbers and (specific) BAM-degradation rates for biofilms grown in the different conditions were determined with the unpaired Student's T-test and for P-value < 0.05, the difference was considered significant.
RESULTS
Biofilm occupation and BAM-degradation activity of strain MSH1-GFP in the presence of an SFC: co-colonization mode
Both the SFC and MSH1-GFP were simultaneously inoculated into flow channels fed with MS medium without BAM or containing nominal BAM concentrations of 1 and 1000 μg/L. Control systems included flow channels either inoculated with only the SFC or with only MSH1-GFP. Time lapse residual BAM concentration in the effluent presented as a percentage of the BAM concentration in the effluent of the abiotic control are shown in Figure 2. In flow channels fed with 1 μg/L BAM, differences in BAM degradation between systems inoculated with MSH1-GFP alone and those with MSH1-GFP combined with the SFC became apparent after 20 days of operation. Flow channels containing MSH1-GFP alone were more efficient (factor 1.6 at the end of the experiment) than flow channels containing MSH1-GFP combined with the SFC (Table 1). Similar results were obtained in flow channels fed with 1000 μg/L BAM. Only after day 45 was a slightly but significant higher BAM-degradation efficiency observed in systems inoculated with MSH-GFP alone compared to systems containing MSH1-GFP combined with the SFC (1.1-fold at the end of the experiment) (Table 1). No significant BAM degradation occurred in flow channels inoculated with the SFC alone (Figure 2; Table 1).
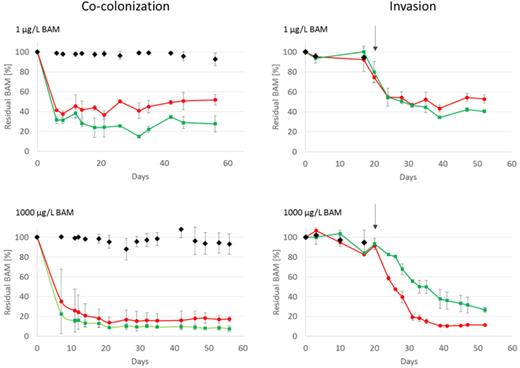
Residual BAM in the effluent (expressed as the percentage of the effluent concentration of the abiotic control) of flow channels fed with either 1 μg/L BAM (top) or 1000 μg/L BAM (bottom), inoculated according to the co-colonization mode (left) or the invasion mode (right): channels inoculated with the SFC (black diamonds), channels inoculated with the combination SFC and MSH1-GFP (red circle) and systems inoculated with only MSH1-GFP (green square). The arrow in the left panel indicates the moment of inoculation of MSH1-GFP in channels operated according the invasion mode. Values are average values (n = 3) with standard deviation indicated by the error bar.
Overall biofilm biomass, MSH1-GFP abundances and overall and specific BAM-degradation rates in flow channels that were operated either according to the co-colonization mode (MSH1-GFP inoculated simultaneously with the SFC) or according to the invasion mode (MSH1-GFP inoculated in flow channels already occupied by the SFC biofilm).
| Nominal BAM | BAM | Relative | Total | Specific BAM- | |||
|---|---|---|---|---|---|---|---|
| concentration | degradation | BAM | abundanced | abundancee | degradation ratef | ||
| in feed | extenta | degradation rateb | Total biomassc | MSH1-GFP | MSH1-GFP | MSH1-GFP | |
| Inoculum | [μg/L] | [%] | [μg BAM/min] | [μm3;/μm2;] | [%] | [Cells] | [μg BAM/cell/min]] |
| Co-colonization mode | |||||||
| MSH1-GFP | 0 | n.a. | n.a. | 2.30 ± 0.76A | 59 ± 9A | 5.5 ± 1.8 × 10⁸A | n.a. |
| MSH1-GFP + SFC | 0 | n.a. | n.a. | 2.24 ± 0.68A | 45 ± 20A | 4.5 ± 1.6 × 10⁸A | n.a. |
| SFC | 0 | n.a. | n.a. | 1.61 ± 0.36A | 0B | n.a. | n.a. |
| MSH1-GFP | 1 | 77 ± 6A | 3.0 ± 0.3 × 10⁻⁵A | 1.61 ± 0.27A | 70 ± 12A | 5.0 ± 0.9 × 10⁸A | 6.0 ± 0.5 × 10⁻¹⁴A |
| MSH1-GFP + SFC | 1 | 48 ± 6B | 1.9 ± 0.3 × 10⁻⁵B | 0.54 ± 0.19B | 39 ± 10B | 1.1 ± 0.5 × 10⁸B | 1.8 ± 0.2 × 10⁻¹³B |
| SFC | 1 | 7 ± 8C | 0.3 ± 0.3 × 10⁻⁵C | 0.86 ± 0.42C | 0C | n.a. | n.a. |
| MSH1-GFP | 1000 | 90 ± 3A | 5.1 ± 0.2 × 10⁻²A | 7.40 ± 1.40A | 90 ± 8A | 2.9 ± 0.7 × 10⁹A | 1.7 ± 0.0 × 10⁻¹¹A |
| MSH1-GFP + SFC | 1000 | 83 ± 2B | 4.7 ± 0.1 × 10⁻²B | 5.50 ± 1.40A | 89 ± 8A | 1.5 ± 0.8 × 10⁹B | 3.1 ± 0.1 × 10⁻¹¹B |
| SFC | 1000 | 8 ± 11C | 0.5 ± 0.6 × 10⁻²C | 5.94 ± 1.14A | 0B | n.a. | n.a. |
| Invasion mode | |||||||
| MSH1-GFP | 0 | n.a. | n.a. | 0.60 ± 0.38A | 40 ± 23A | 1.1 ± 0.6 × 10⁸A | n.a. |
| MSH1-GFP + SFC | 0 | n.a. | n.a. | 0.55 ± 0.27A | 40 ± 15A | 9.9 ± 0.4 × 10⁷A | n.a. |
| SFCg | 0 | n.a. | n.a. | 0.74 ± 0.83A | 0 | n.a. | n.a. |
| MSH1-GFP | 1 | 59 ± 2A | 3.6 ± 0.1 × 10⁻⁵A | 0.38 ± 0.16A | 27 ± 17A | 4.7 ± 0.3 × 10⁷A | 7.6 ± 0.2 × 10⁻¹³A |
| MSH1-GFP + SFC | 1 | 47 ± 4B | 2.8 ± 0.2 × 10⁻⁵B | 0.65 ± 0.66A | 12 ± 10A | 3.6 ± 0.3 × 10⁷B | 7.8 ± 0.7 × 10⁻¹³A |
| SFCg | 1 | 6 ± 2C | 0.3 ± 0.1 × 10⁻⁵C | 2.30 ± 1.30A | 0 | n.a. | n.a. |
| MSH1-GFP | 1000 | 73 ± 2A | 4.6 ± 0.2 × 10⁻²A | 1.41 ± 0.62A | 84 ± 12A | 5.3 ± 0.3 × 10⁸A | 1.1 ± 0.0 × 10⁻¹⁰A |
| MSH1-GFP + SFC | 1000 | 89 ± 0B | 5.6 ± 0.0 × 10⁻²B | 6.36 ± 3.06B | 45 ± 15B | 1.3 ± 0.7 × 10⁹B | 3.6 ± 0.1 × 10⁻¹¹B |
| SFCg | 1000 | 5 ± 13C | 0.3 ± 0.8 × 10⁻²C | 5.01 ± 3.79B | 0 | n.a. | n.a. |
Capital letters A, B and C indicate significant (unpaired Student's T-test; P-value < 0.05) difference between values recorded for systems either inoculated with the SFC alone, MSH1-GFP alone or with SFC and MSH1-GFP combined for the same feed condition.
BAM-degradation efficiency calculated as the residual BAM in the effluent of the abiotic control subtracted with that in the effluent of the inoculated flow channel and then divided by the residual BAM in the abiotic control.
BAM-degradation rate was calculated by multiplying the BAM-degradation extent with the residual BAM concentration in the effluent of the abiotic control.
Total biomass in the flow channels is expressed as the GFP-labeled and Syto® 62-labeled biovolume (μm3;) per substrate surface (μm2;) as determined from CLSM image stacks using COMSTAT1.
MSH1-GFP relative abundance was calculated as the ratio of the GFP-labeled biovolume over the total biomass.
Total MSH1-GFP cell abundance in the flow channels was calculated by multiplying the GFP-labeled biovolume (μm3;/μm2;) with the total substrate surface in the flow channel (1.6 × 108 μm2;) divided by the cell volume (0.36 μm3;/cell).
The specific BAM-degradation rate was calculated by dividing the BAM-degradation rate by the total MSH1-GFP cell abundance.
SFC at day 20 in invasion mode at the moment of inoculation with MSH1-GFP.
‘n.a.’ stands for ‘not applicable’
CLSM analysis of control channels inoculated with the SFC only showed that the SFC formed a biofilm covering the entire surface of the flow channel when irrigated with 1000 μg/L BAM, while when fed with 1 μg/L BAM and no BAM only small microcolonies developed (Figure 3). These observations corroborated with the higher total biofilm biomass in flow channels fed with 1000 μg/L BAM compared to those fed with MS without BAM or with 1 μg/L BAM (Table 1). A plausible explanation of this unexpected higher SFC biomass in flow channels irrigated with 1000 μg/L BAM is growth of the SFC on organic carbon impurities in the BAM solution (purity of used BAM was 95%) that will increase in content with increasing BAM concentration.
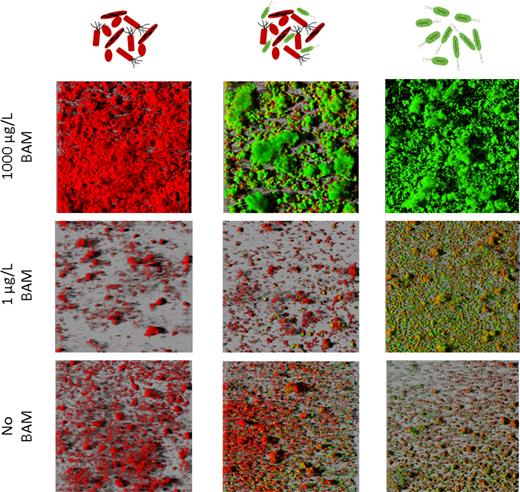
Representative 3D images of biofilms in the front of flow channels that were operated according to the co-colonization mode. Flow channels were either inoculated with SFC (left), SFC mixed with MSH1-GFP (center) or MSH1-GFP, (right) and fed with MS medium without BAM (bottom), 1 μg/L BAM (middle) and 1000 μg/L BAM (top). MSH1-GFP cells expressing GFP are shown in green and cells counterstained with Syto® 62 are shown in red.
MSH1-GFP colonization of flow channels inoculated with MSH1-GFP alone was as previously described (Sekhar et al.2016) showing a mixture of GFP-expressing and non-GFP-expressing cells with GFP-expressing cells forming the largest fraction (80%–90%). In flow channels fed with 1000 μg/L BAM, the biofilm was composed of macrocolonies of MSH1-GFP covering the entire surface of the channel. In flow channels receiving no BAM or 1 μg/L BAM, only MSH1-GFP microcolonies formed that partially covered the surface. Total MSH1-GFP cell numbers in systems receiving 1000 μg/L BAM were a 6-fold higher compared to the numbers in systems receiving no BAM and 1 μg/L BAM (Table 1).
In systems inoculated with MSH1-GFP combined with the SFC, only MSH1-GFP cells expressing GFP were accounted as MSH1-GFP cells since we could not discriminate between SFC cells and MSH1-GFP cells not expressing GFP. Therefore, when comparing numbers of MSH1-GFP in flow channels with and without SFC inoculation, only MSH1-GFP cells that expressed GFP were considered. The morphology of biofilms of SFC and MSH1-GFP combined resembled that of biofilms of MSH1-GFP alone when fed with 1000 μg/L BAM. MSH1-GFP formed macrocolonies and composed the main biomass in the channel with non-GFP SFC microcolonies growing on the periphery of the MSH1-GFP colonies (Figure 3). In channels fed with no BAM and 1 μg/L BAM, the SFC and MSH1-GFP formed separated microcolonies, and overall the biofilm morphology resembled this of biofilms that developed in channels inoculated with the SFC alone. The total biofilm biomass estimated in the flow channels fed with 1000 μg/L BAM was significantly higher than in those that received no BAM (2.5-fold) or 1 μg/L BAM (10-fold) (Table 1). Total MSH1-GFP cell numbers, based on the GFP-labeled biovolume, were significantly lower in the presence of the SFC compared to systems where MSH1-GFP was inoculated alone (5- and 2-fold for 1 and 1000 μg/L BAM, respectively) (Table 1), while no significant difference was observed when BAM was not fed. Consequently, the specific BAM-degradation rate (μg BAM/MSH1-GFP cell/min) of MSH1-GFP was higher in the presence of the SFC compared to MSH1-GFP alone (3- and 2-fold in systems fed with 1 and 1000 μg/L BAM, respectively).
Biofilm occupation and BAM-degradation activity of strain MSH1-GFP in the presence of an SFC: invasion mode
In the invasion approach, the SFC was allowed to colonize the flow channel for 20 days in advance to MSH1-GFP inoculation. During the 20 days of operation prior to MSH1-GFP inoculation, no removal of BAM was observed compared to the abiotic control (Figure 2). CLSM analysis of flow channels sacrificed at day 20 showed that in flow channels inoculated with the SFC a biofilm had formed whose coverage and biomass, as in the ‘co-colonization’ experiment, depended on the BAM feed concentration (Figure 4). Again, the highest biomass was formed in channels fed with 1000 μg/L BAM (Table 1). No biofilm formation was observed in non-inoculated flow channels.
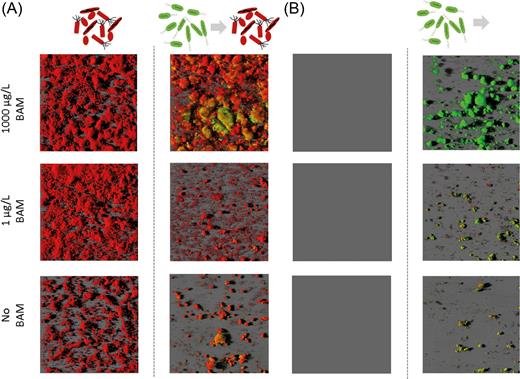
Representative CLSM 3D images of biofilms in the front of flow chambers that were operated according to the invasion mode. Flow channels were inoculated with either the SFC followed by inoculation with MSH1-GFP at day 20 (Panel A), or were operated without inoculation of the SFC followed by inoculation with MSH1-GFP at day 20 (Panel B). Panel A (left) shows biofilms of the SFC after 20 days of operation prior to MSH1-GFP inoculation. Panel A (right) depicts biofilms in flow channels that were first colonized for 20 days by the SFC and then inoculated with MSH1-GFP with the pictures taken 39 days after MSH1-GFP inoculation. Panel B (left) shows flow channels not inoculated with the SFC after 20 days of operation and before being inoculated with MSH1-GFP. Panel B (right) depicts biofilms in channels that were first operated (for 20 days) without SFC inoculation and then inoculated with MSH1-GFP with the pictures taken 39 days after MSH1-GFP inoculation. The channels were fed with MS without BAM (bottom), with BAM at 1 μg/L BAM (middle) and with BAM at 1000 μg/L BAM (top). MSH1-GFP cells expressing GFP are shown in green and cells stained with Syto® 62 are shown in red.
Upon MSH1-GFP inoculation, BAM was immediately degraded (Figure 2). In systems fed with 1000 μg/L BAM, BAM degradation was significantly higher when the SFC was present (Figure 2) (1.4-, 3.6- and 2.3-fold higher at days 4, 20 and 35 (end) after MSH1-GFP inoculation, respectively). In systems fed with 1 μg/L BAM, BAM degradation was initially (first 20 days after inoculation of MSH1-GFP) not different between systems containing the SFC biofilm and those that did not (Figure 2). However, from day 20, BAM degradation was significantly lower (1.25-fold at the end of the experiment) when the SFC was present (Table 1). Overall, biofilm morphology and biomass did not significantly change 35 days after inoculation of MSH1-GFP in systems fed with 1000 μg/L BAM (Table 1). In those systems, MSH1-GFP clearly integrated into the biofilm and became part of the SFC macrocolonies (Figure 4). Total MSH1-GFP cell numbers were 2-fold higher in channels containing the SFC compared to channels that did not (Table 1). In systems that received MS medium without BAM or with 1 μg/L BAM, biofilm morphology had clearly changed 35 days after MSH1-GFP inoculation, and the biofilm consisted of microcolonies with MSH1-GFP cells covered by SFC cells (Figure 4). Total MSH1-GFP cell numbers were 1.3-fold lower when the SFC was present compared to the MSH1 monoculture system when fed with 1 μg/L BAM. No significant difference was observed for systems fed with MS without BAM (Table 1).
Specific MSH1-GFP BAM-degradation rates (μg BAM/MSH1-GFP cell/min) in channels fed with 1 μg/L BAM were not significantly different in systems containing the MSH1-GFP/SFC mixture compared to systems inoculated with MSH1-GFP alone. However, in channels receiving 1000 μg/L BAM, specific BAM-degradation rates (considering only GFP-expressing cells) were 3-fold lower in systems containing the MSH1-GFP/SFC mixture.
DISCUSSION
Aminobacter sp. strain MSH1 is proposed to be used for bioaugmentation of DWTP filtration units to treat water contaminated with the micropollutant BAM. During bioaugmentation, MSH1 needs to invade an existing community adapted to the local, in this case, highly oligotrophic conditions. According to the definition proposed by Kinnunen et al. (2016), MSH1 can be regarded as a true invader since the strain is an ‘alien’ microbial entity that was not part of the resident community prior to the point of observation. We previously showed that Aminobacter sp. MSH1 is able to successfully colonize a solid substratum under continuous flow conditions under C- and N-starvation supplied with a feed of BAM at a concentration as low as 1 μg/L BAM added as C- and N-source. Here, we show that MSH1 is able to co-colonize with and even invade a pre-existing relevant resident biofilm community originating from a rapid sand filter of a DWTP. The experimental model used in this study largely agrees with a relevant situation in the field. DWTP sand filters and especially those that treat groundwater are chemically quite static systems, i.e. they receive groundwater with a constant composition at a constant flow rate. Hydraulic retention times are fixed and community composition is rather stable (Gulay et al.2016). BAM at trace concentrations of 1 μg/L are highly relevant, while 1000 μg/L BAM was used mainly as a control to assess the importance of selective growth conditions for MSH1 during invasion. In this study, disturbances like backwashing though were not included, as well as the possible supply of new bacteria or protozoa that can impact community composition and succession (Kasuga, Shimazaki and Kunikane 2007; Yu, Peng and Ren 2011; Pinto, Xi and Raskin 2012).
A GFP-labeled MSH1 strain was used to track MSH1's colonization and invasion into the receiving biofilm. MSH1-GFP showed the same growth and biofilm-formation capacity as its wildtype and is therefore representative for MSH1 (Sekhar et al.2016). A fraction of the MSH1 cells however do not express GFP in the flow chambers. However, only 1–2 MSH1-GFP cells on 10 do not express GFP, and therefore only small biases on abundance estimation in mixed biofilms are expected. Whether co-inoculated or added into a system that was already occupied by the SFC, MSH1-GFP did establish in the SFC biofilm community under C- and N-starved conditions, i.e. when fed with no BAM and 1 μg/L BAM. The establishment of MSH1-GFP in the SFC and in the biofilm system includes presence but also proliferation and activity that are three criteria to label invasion as successful (Kinnunen et al.2016). Indeed, at the end of the experiment, MSH1-GFP was clearly present in flow channels, either as separate colonies in case of co-colonization or integrated in the SFC biofilm in case of invasion. MSH1-GFP clearly grew in the system as MSH1-GFP cell numbers were 2–5-fold higher or more in flow channels fed with BAM-free MS medium and MS containing 1 μg/L BAM at the end of the experiment than the number of inoculated MSH1-GFP cells (2 × 10⁷ cells). Growth was probably underestimated since this calculation does not take into account that not all cells attach upon inoculation and that cells are lost during operation for instance due to shearing (Sekhar et al.2016). The MSH-GFP cells considered were only the GFP-expressing cells and probably the population of MSH1-GFP might be even larger. On the other hand, we can assume that the GFP-expressing cells of MSH1-GFP are actually the active cells. BAM-degradation activity by MSH1-GFP in the systems was shown by the continuous BAM removal observed in the channels compared to the none-inoculated controls. Moreover, MSH1-GFP grew and performed BAM degradation, while the SFC was growing since also the number of SFC cells in the biofilm had increased 10-fold or more compared to the inoculum at the end of the experiment. We previously showed that intrinsic AOC forms the major C-source for MSH1-GFP when cultured alone in the flow channels when BAM was provided in the feed at concentrations lower than 100 μg/L (Sekhar et al.2016). The observation that MSH1-GFP successfully establishes in SFC biofilms at trace BAM concentrations suggests that MSH1-GFP can successfully compete with the SFC for the limited C and N present in the medium. Moreover, the observation that MSH1-GFP establishes equally well in system fed with trace BAM concentrations and in systems without BAM in the feed shows that the presence of BAM as a selective C- and N-source under trace concentrations of N and C is not required.
Total MSH1-GFP cell numbers in the biofilm depended on the concentration of BAM that functions as a selective C-source. However, also the presence of the SFC affected MSH1-GFP cell numbers. This was especially the case when co-colonization was examined where MSH1-GFP cell numbers were 5-fold (feed of 1000 μg/L BAM) to 3-fold (feed with 1 μg/L BAM) lower when the SFC was present compared to the channels without SFC. The lower cell establishment can be attributed to a lower growth rate, e.g. due to competition for nutrients with the SFC, or to a higher cell loss rate. The presence of BAM apparently increased the negative effect of the SFC on establishment since no effect of the SFC on total MSH1-GFP cell numbers was observed when BAM was not added to the feed. We observed previously that BAM leads to the expression of stress-related genes in MSH1 (T'syen, unpublished results). Interestingly, negative effects of the SFC on MSH1-GFP cell numbers in the biofilm were also seen in case of the invasion mode at BAM feed concentrations of 1 μg/L BAM, but not at 1000 μg/L BAM. In the latter case, the presence of the SFC rather resulted into higher MSH1-GFP cell numbers.
MSH1-GFP colonized the flow channel in a different way in the co-colonization mode than in the invasion mode, i.e. MSH1-GFP formed separate colonies in the co-colonization mode, while it formed mixed colonies with the SFC in the invasion mode. The different mode of inoculation might have created different opportunities for MSH1-GFP to establish in the system. In case of co-colonization, MSH1-GFP has the opportunity to start from a single cell at a certain location and influence its nearby environment as such that other microbiota will not grow in its vicinity, for instance through interference competition (Garbeva et al.2011; Oliveira et al.2015). This way, MSH1-GFP even might affect the local community composition. Several studies suggest that interference competition mechanisms can be induced by stress due to exploitative competition (competition for growth resources) with co-colonizing organisms (Cornforth and Foster 2013). In contrast, in the invasion mode, MSH1-GFP has to invade a mature and well-established biofilm community that has optimized the interactions between the community members and that might differ in composition from the SFC that developed under co-colonization conditions. This might have affected the mode of MSH1-GFP colonization and effects of the SFC on MSH1-GFP cell numbers. Furthermore, the integration of MSH1-GFP in SFC microcolonies might point to direct metabolic interactions. Juxta positioning of cells in biofilm was linked with exchange of nutrients (Nielsen et al.2000; Breugelmans et al.2008) that might explain, at least for systems receiving 1000 μg/L BAM, the higher number of MSH1-GFP cells in case of invasion (Yoshida et al.2009). Interestingly, in the invasion mode and at BAM feed concentration of 1000 μg/L BAM, BAM removal rates were initially higher in systems that contained an SFC biofilm compared to systems that did not. This points to an improved attachment of MSH1-GFP cells to the existing SFC biofilm compared to the non-colonized glass substrate. Colonization of a substratum by pollutant-degrading bacteria was previously improved by the presence of an existing biofilm (Gilbert, Walker and Keasling 2003; Yoshida et al.2009). Co-aggregation is perceived as an important process in the development of multispecies biofilms where initial colonization of the substratum is done by bacteria called pioneers, in this case the sand filter bacteria, to which other bacteria—called successors—can easily attach (Rickard et al.2003).
Interestingly, despite differences in MSH1-GFP abundance between biofilms formed in co-colonization mode and invasion mode, overall BAM degradation was only slightly different. MSH1-GFP cells that had formed in the presence of the SFC in the co-colonization mode when fed with 1 μg/L BAM even displayed a specific BAM-degrading activity that was higher compared to monoculture MSH1-GFP cells, but lower compared to MSH1-GFP cells that had invaded the SFC biofilm. Specific BAM-degradation rates calculated in our study for monospecies biofilms of strain MSH1-GFP in the co-colonization and invasion procedure were similar as those reported previously by Sekhar et al. (2016). In case of co-colonization with the SFC, the specific BAM-degrading activity was 3- and 2-fold higher for both 1 and 1000 μg/L BAM, respectively, compared to MSH1-GFP monoculture system. This was unexpected since MSH1-GFP decreased in numbers or remained the same when combined with the SFC compared to the MSH1-GFP monoculture system and hence shows rather indications of a competitive behavior. A possible explanation is that AOC is less available to MSH1-GFP, hence the lower MSH1-GFP cell numbers, due to partial degradation by the SFC. At the same time, inhibitory effects due to easy degradable C-sources, for instance through carbon catabolite repression, are reduced or nullified. Carbon catabolite repression of pesticide degradation at micropollutant concentrations was observed before (Horemans et al.2013, 2014). In case of invasion, the specific BAM-degrading activity was, however, negatively affected (factor 1.5) in systems receiving 1000 μg/L BAM but unaffected in systems receiving 1 μg/L BAM compared to the monospecies MSH1-GFP biofilms, while MSH1-GFP cell numbers were not significantly different. This likely indicates that co-localization did not stimulate BAM-degradation activity. Moreover, the presence of more SFC biomass in systems fed with 1000 μg/L BAM might hamper BAM-degradation activity due to limitation of nutrients for MSH1-GFP as a result of consumption by the SFC. Otherwise, co-metabolic degradation of BAM by the SFC might have produced toxic metabolites. For instance, 4-chlorobenzoate, the product of 4-chlorobiphenyl degradation by a Pseudomonas strain, was transformed by indigenous soil bacteria into a toxic compound that inhibited the 4-chlorobiphenyl-degrading strain (Havel and Reineke 1992).
We conclude that the BAM-degrading strain MSH1 can establish in SFC biofilms under N- and C-limiting conditions and hence is able to successfully compete with the SFC for scarce C and N nutrients. Depending on the presence/absence of BAM, the BAM concentration and mode of inoculation, subtle but significant differences in MSH1 cell biomass and specific BAM-degradation rates were recorded. This points to the occurrence of specific interactions of MSH1-GFP with the SFC members under the different conditions. However, further research is needed whether MSH1-GFP can also invade other SFC since community diversity is known to affect the invasion success (van Elsas et al.2012). Recently Ekelund et al. (2015) showed that MSH1 persisted longer and showed a higher BAM-mineralization activity at intermediate diversity levels of the receiving community in batch systems. The composition of the bacterial community of the SFC used to inoculate the flow chambers was determined by means of 16S rRNA gene pool 454 pyrosequencing (Vandermaesen, Lievens and Springael 2017). The community showed strong resemblance with communities from other sand filters regarding the most dominant phyla as reported by Gulay et al. (2016) and is therefore representative for a sand filter DWTP community. However, we do not know the composition of the SFC that developed in the flow channels. The synthetic ecological biofilm model used in this study provides a valuable tool to fundamentally study the impact of community composition on MSH1 survival/activity and vice versa as well as to study other ecological questions and theories that relate to invasion of and bioaugmentation with MSH1 and other bacteria in filtration units in DWTPs. Answering such questions can help to improve and steer bioaugmentation of DWTP filtration units.
Acknowledgments
We thank K. Simoens for his excellent help in setting up flow chamber experiments.
FUNDING
This work was supported by EU FP7 project Biotreat n°: 266039, FWO post-doctoral fellow grant 12Q0215N to BH, BELSPO IAP-project μ-manager n° P7/25 and KULeuven C1 project n°C14/15/043.
