


Abstract
Recurrent self-fertilization is thought to lead to reduced adaptive potential by decreasing the genetic diversity of populations, thus leading selfing lineages down an evolutionary “blind alley.” Although well supported theoretically, empirical support for reduced adaptability in selfing species is limited. One limitation of classical theoretical models is that they assume pure additivity of the fitness-related traits that are under stabilizing selection, despite ample evidence that quantitative traits are subject to dominance. Here, we relax this assumption and explore the effect of dominance on a fitness-related trait under stabilizing selection for populations that differ in selfing rates. By decomposing the genetic variance into additional components specific to inbred populations, we show that dominance components can explain a substantial part of the genetic variance of inbred populations. We also show that ignoring these components leads to an upward bias in the predicted response to selection. Finally, we show that when considering the effect of dominance, the short-term evolutionary potential of populations remains comparable across the entire gradient in outcrossing rates, and genetic associations can even make selfing populations more evolvable on the longer term, reconciling theoretical, and empirical results.
Plant mating systems are highly variable and range from functional asexuality to obligate outcrossing (Barrett 2003). Predominant selfing is uncommon compared to obligate outcrossing enforced by self-incompatibility, but many plant species self-fertilize at rates ranging from near zero to near one (Moeller et al. 2017). Within selfing species, outcrossing rates often vary widely among populations (Whitehead et al. 2018). The main fitness advantages associated with the transition from outcrossing to selfing are the reproductive-assurance benefits of ensuring reproduction when cross-pollination fails (Baker 1955; Eckert et al. 2006), and the two-fold transmission advantage of genes (Fisher 1941). Despite these short-term advantages, there are few predominantly selfing species (15% of species in Igic and Kohn 2006), and their generally recent origin is at least sometimes associated with a negative diversification rate (Goldberg et al. 2010), suggesting that selfing could be an evolutionary dead-end (Stebbins 1957, and see Takebayashi and Morrell 2001; Igic and Busch 2013 and Wright et al. 2013 for reviews). An important component of Stebbins's original dead-end hypothesis is that selfing populations should exhibit less genetic diversity, so that they are less adaptable and thus more prone to extinction.
Although reduced quantitative-genetic variation under recurrent inbreeding is expected theoretically (Lande and Porcher 2015; Abu Awad and Roze 2018), empirical results from quantitative surveys and meta-analyses are equivocal. Charlesworth and Charlesworth (1995) compiled estimates of outcrossing rates, heritabilities, and coefficients of genetic variation from published studies of plants, and detected weak overall relationships between outcrossing rates and standing genetic variation. They did, however, detect the predicted positive relationship when restricting the analysis to additive genetic coefficients of variation, and found that the magnitude of the reduction in quantitative-genetic variance in selfers was larger than expected theoretically. More recently, Opedal et al. (2017) reported only minor differences in evolvabilities (mean-scaled genetic variances) of floral traits between predominantly selfing, mixed-mating, and predominantly outcrossing plants, while Clo et al. (2019) detected a weak positive relationship for certain traits. The discrepancy between theory and data could arise from the fact that existing theoretical models considering the effect of selfing on quantitative traits under stabilising selection assumes a purely additive architecture (Lande 1977; Lande and Porcher 2015; Abu Awad and Roze 2018). This assumption contradicts the observation that fitness-related traits do not always behave additively, and that dominance relationships among alleles at a given locus are common (Shaw et al. 1998, Kelly and Arathi 2003, Wolak and Keller 2014).
(Cockerham and Weir 1984), where σ²genic (the variance of additive effects of alleles) and σ²DR (the variance of dominance deviations of a randomly mating population) are the classical terms most often inferred in quantitative genetics. With dominance and inbreeding, these terms are not sufficient to describe the adaptive potential of populations. The additional terms arising under partial inbreeding include the variance of dominance deviations of a fully inbred population σ²DI, and the covariance between the additive effect of an allele and its homozygous dominance deviation σADI. This covariance arises because the increased homozygosity in inbred populations increases the probability that an allele occurs in its homozygote state, which creates covariance between the contribution of an allele to the breeding value and the dominance deviation of the homozygote genotype (Wolak and Keller 2014). Note that unlike the other terms of equation (1), this term is a covariance and can thus be negative. The third additional component, H*, is the squared per-locus inbreeding depression, summed over all loci. This last term is expected to be small if inbreeding depression is due to the cumulative effect of a large number of loci with small effects (Shaw et al. 1998). The new terms of equation (1) and their contributions due to F arise because the genetic components are inferred under the assumption of random mating. With inbreeding, an individual may have common ancestors through both parental lines, such that non-additive effects can contribute to the covariance between parents and offspring, which does not occur under random mating. While σ²DR does not affect the response to selection, the additional dominance components (notably σ²DI and σADI) contribute to the adaptive potential because they contribute to the covariance between parents and offspring, on which selection response depends (Wright and Cockerham 1985; Kelly 1999a, 1999b).
Accurate predictions of the adaptive potential of populations are of critical importance in light of ongoing environmental changes. With ongoing pollinator declines and other changes in pollinator communities, a question of particular interest is how a transition from outcrossing towards partial selfing affects the immediate and long-term adaptive potential of populations (e.g. Opedal et al. 2017; Clo et al. 2020; Cheptou 2021). A consequence of the focus of theoretical and empirical studies on the additive variance is that little is known about the effect of dominance on the evolutionary potential of populations, or how its interaction with self-fertilization can modify the effect of inbreeding on evolvability. Here, we use simulation models to study the relationship between mating systems and the genetic variance, focusing in particular on the contribution of those variance components related to dominance interacting with inbreeding. Specifically, by introducing dominance into classical models of quantitative traits under stabilizing selection, we dissect the genetic architecture of quantitative traits at mutation-selection-drift equilibrium. We test if incorporating all relevant components of the genetic variance into a simplified model of selection response yield accurate estimates of the rate of evolution of partially selfing populations, notably compared to purely additive models. Finally, we use the insights from our model to discuss the short- and long-term effects of self-fertilization on the adaptive potential of populations.
Material and Methods
SIMULATION PROGRAM
Description of model parameters, their abbreviations and range of values considered in the simulations
| Parameter | Abbreviation | Value(s) |
|---|---|---|
| Population size | N | 1000 |
| Selfing rate | S | 0 to 1 |
| Number of loci | L | 50 |
| Dominance genetic effect | di | 0 (additive model), ri/2 (partial dominance), ri (complete dominance) |
| Strength of stabilizing selection | ω² | 1 or 9 |
| Haploid phenotypic mutation rate | U | 0.005 or 0.05 |
| Mutational variance for the quantitative trait | a² | 0.05 |
| Environmental variance | VE | 1 |
We initiated each simulation from a population of genetically identical individuals at the phenotypic optimum (all loci carried ancestral alleles with effect 0 and Z = ZOPT = 0, Abu Awad and Roze 2018). Following Clo et al. (2020), the life cycle can be summarized by five successive events. First, there is a phenotype-dependent choice of the first parent (selection), followed by mating-type choice (selfing versus outcrossing at rates s and [1- s], respectively). In the case of outcrossing, the choice of the second parent is also phenotype dependent. Selection takes place as follows: if the ratio of the selected parent's fitness over the highest recorded fitness value in the current generation is higher than a threshold value sampled from a uniform distribution between 0 and 1, the individual is allowed to reproduce. Once the two parents are chosen, they each contribute a gamete produced by random sampling of one allele per locus. This phase is then followed by the introduction of mutations from allele 0 to allele 1 and vice versa, the number of which is sampled from a Poisson distribution with parameter U (with U = μL, where μ is the per-locus mutation rate and L is the number of loci underlying the quantitative trait; Abu Awad and Roze 2018).
Each simulation run consists of two phases, of which the first is a “burn-in” period allowing the population to attain Mutation-Selection-Drift equilibrium (M-S-D). The population is considered to be at M-S-D equilibrium when the average fitness value calculated over the last 1000 generations does not differ by more than 1% from the mean fitness calculated over the previous one thousand generations (Abu Awad and Roze 2018; Clo et al. 2020). The second phase consists of following the population after a shift in the phenotypic optimum (from 0 to 2.5, as in Clo et al. 2020), during 20 generations. After the shift, the haploid genomic mutation rate U is set to 0 so that the only source of genetic variation available to approach the new optimum is the standing variation accumulated before the environmental change.
INVESTIGATED PARAMETER VALUES
We ran simulations for several parameter sets (Table 1). The values chosen for the mutation rate U (0.005 and 0.05) reflect the expected per-trait haploid genomic mutation rate reported in the literature (Keightley and Bataillon 2000; Shaw et al. 2002). This also reflects two distinct mutation regimes, one where genetic associations are negligible, as deleterious mutations arise slowly enough to be efficiently purged (U = 0.005), and one where they are influential, as mutations arise faster and the generation of associations between alleles having opposite effects on the phenotype allow populations to stay close to the phenotypic optimum (U = 0.05, see Clo et al. 2020). We chose parameter set values similar to those explored in Bürger et al. (1989) and Ronce et al. (2009), with the number of freely recombining loci under selection L = 50, and a² = 0.05 (in agreement with empirical estimates, Lynch 1988), VE = 1, ω² = 1 or 9. We considered three levels of dominance, di = 0 (additive model), di = ri/2 (partial dominance) and di = ri (complete dominance). Scenarios of partial and complete recessivity are not presented as they gave results similar to those for partial and complete dominance. Simulations were run for the full range of selfing rates (s varied from 0 to 1). We considered a constant population size of N = 1000, but initial simulations assuming smaller or larger N (250 and 10.000) did not change the conclusions of the study (data not shown).
QUESTION 1: WHAT IS THE RELATIVE CONTRIBUTION OF EACH GENETIC VARIANCE COMPONENT?
Our simulations allow us, for the first time, to evaluate the contribution of each genetic parameter of equation (1) for a quantitative trait under stabilizing selection. To estimate each component of the genetic variance, it is necessary to calculate the average effects of alleles 0 and 1 at each locus, and the statistical dominance deviations of each of three genotypes, under the assumption of random mating (see Falconer & Mackay 1996 chapter 7, and Wolak and Keller 2014 for details).
(Cockerham and Weir 1984). It is important to note that this decomposition of genetic variance into “additive” and “dominance” components minimizes (Cockerham and Weir 1984).
QUESTION 2: THE INTERACTIVE EFFECTS OF DOMINANCE AND SELFING ON SHORT-TERM ADAPTIVE POTENTIAL AND THE ACCURACY OF PREDICTED SELECTION RESPONSE UNDER INBREEDING
We investigated how dominance affects the short- to mid-term adaptive potential of selfing populations. To do so, we inferred the cumulative response to selection (calculated as the fitness gain) in a population for 1 and 20 generations after the environmental change. As pointed out by Abu Awad and Roze (2018), the number of traits under selection can have strong effects on the adaptive potential of populations. We assessed if this is the case also when dominance occurs on phenotypes. To do so, we inferred the cumulative response to selection of populations for which fitness is determined by ten independent quantitative traits controlled by the same genetic architecture described above. We introduced the environmental change by shifting the optimum of one trait from 0 to 2.5, so that the Euclidian distance to cross in phenotypic space is the same for the two sets of simulations.
QUESTION 3: THE EFFECT OF SHIFTING FROM OUTCROSSING TO SELFING ON HERITABLE VARIANCE
Results
QUESTION 1: WHAT IS THE RELATIVE CONTRIBUTION OF EACH GENETIC VARIANCE COMPONENT?
Overall, the within-loci genetic variance (i.e., ignoring genetic associations) is dominated by the additive component for all selfing rates and all dominance genetic effects (Fig. 1). As expected, the contribution of additive variance to genetic variance decreases with the degree of dominance. In the case of complete dominance (di = ri), the additive component explains around 75% of the genetic variance for outcrossing populations (Fig. 1). These patterns are found for all simulation parameters we considered, and additive variance never explained less than 70% of the genetic variance (Fig. 1). For completely selfing populations, the contribution of dominance variance to total genetic variance is always zero (eqs. 12 and 13).
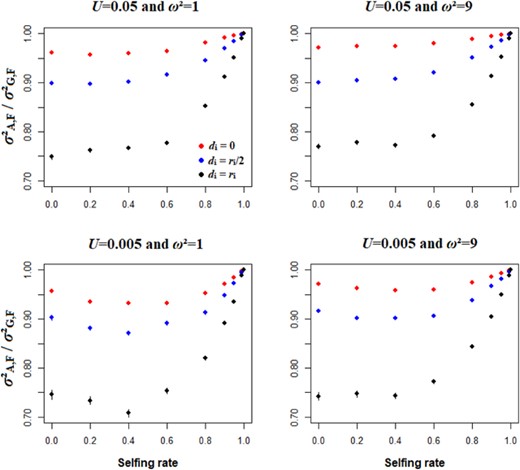
Effects of selfing rate and the dominance genetic effect between alleles at a given locus on the proportion of the within-loci genetic variance that is additive see eqs. 12 and 13 for details). All figures are for N = 1000 and L = 50, while the strength of stabilizing selection (ω² = 1 or 9) and mutation rate (U = 0.005 or 0.05) vary among panels. The red, blue and dark points represent data for additivity, partial dominance and complete dominance scenarios. Errors bars indicate 95% confidence intervals (n = 200).
The overall effect of dominance is to flatten the relationship between the genetic variance and the selfing rate (Fig. 2). When the model is additive (di = 0), the genetic variance decreases progressively with the selfing rate (Fig. 2). In the presence of dominance, the genetic variance is smaller in outcrossing and mixed-mating populations (s < 0.8), and higher in predominantly selfing populations (s ≥ 0.8), compared to an additive scenario (Fig. 2), even if the magnitude of the effect is moderate.
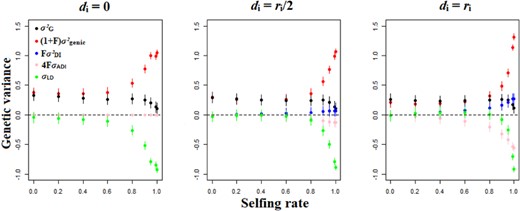
Genetic variance decomposition (contribution of each component) as a function of the selfing rate and the dominance genetic effect among alleles. Other parameters are N = 1000, L = 50, U = 0.05, and ω² = 1. Errors bars indicate 95% confidence intervals (n = 200).
The genetic variance is dominated by those components contributing to the additive variance, that is the genic variance (σ²genic), the variance of homozygous dominance deviations (σ²DI), and the covariance between additive effects of alleles and their homozygous dominance deviations (σADI, Fig. 2). The main effect of dominance is to increase the strength of purifying selection against deleterious mutations, leading to a loss of genic variance (σ²genic) for outcrossing and mixed mating populations, and less diversity stored through linkage disequilibrium (σLD) when the degree of dominance increases (Fig. 2), except for highly selfing populations. This is due to the fact that the frequency of allele 0 is generally higher and close to 1 when dominance increase for low and high selfing rates (Fig. 3). The contribution of the variance of homozygous dominance deviations (σ²DI), and the covariance between additive effects and their homozygous dominance deviations (σADI) slowly increase with the selfing rate, so that these components become important contributors of the genetic variance at high selfing rates (s ≥ 0.8) and for strong dominance (di = ri, Fig. 2). The genetic associations (σLD) are important to consider only for predominantly selfing populations (s ≥ 0.8, Fig. 2). The higher the degree of dominance, the higher the selfing rate for which the effect of genetic associations becomes substantial (Fig. 2). This leads to the result that the covariance between additive effects and their homozygous dominance deviations (σADI) can be the main factor decreasing the genetic variance and thus the adaptive potential of populations (Fig. 2), notably when the mutation rate is low (Fig. S5). Decreasing the mutation rate or the strength of stabilizing selection does not alter the described patterns (Fig. S5 and S6), although, when selection is weaker, positive genetic covariances between alleles at different loci can arise for mixed-mating populations (Fig. S6). Overall, the dominance variance of a random-mating population (σ²DR) and the sum over all loci of squared per-locus inbreeding depression (H*) has minor effects on genetic variance (Fig. S4-S6) and have been omitted from Fig. 2 for clarity.
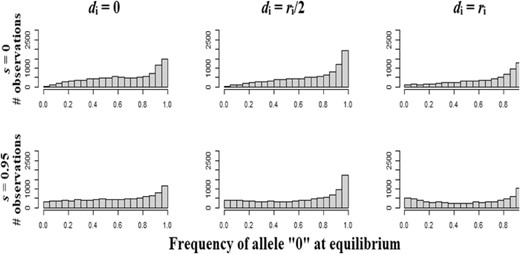
Distribution of the frequency of allele “0” at mutation-selection-drift equilibrium for the 10.000 simulated loci (L = 50 and 200 repetitions), as a function of the dominance genetic effect, for two representative selfing rates (s = 0 and 0.95). Other parameters are N = 1000, L = 50, ω² = 1, and U = 0.05.
The reduction of genic variance for outcrossing populations with dominance also lead to the surprising result that the genic variance is higher in predominantly selfing populations than in outcrossing or mixed-mating populations, independently of the mutation rate for the quantitative trait and hence the strength of genetic associations (Fig. 2; Fig. S5 and S6). Even though some genetic components do not contribute to the total genetic variance due to the value of the inbreeding coefficient, it does not mean that the genetic component itself equals zero.
Question 2: The interactive effects of dominance and selfing on short-term adaptive potential and the accuracy of predicted selection response under inbreeding
EFFECTS OF THE MATING SYSTEM ON THE SHORT- AND MID-TERM RESPONSE TO SELECTION
Dominance modifies the effect of the selfing rate on the response to selection (Fig. 4). The additive model (di = 0) yields classical results (Charlesworth and Charlesworth 1995; Lande and Porcher 2015; Abu Awad and Roze 2018), with a nonlinear decay of adaptive potential of populations as a function of the selfing rate in the short term (Fig. 4, 1 generation of selection). The decay is slow for mixed-mating populations (s ≤ 0.9), and abrupt for predominantly selfing populations (s > 0.9). In the mid-term (20 generations of selection), the effect of selfing vanished and all populations have the same cumulative response to selection, except for extreme rates of selfing (s ≥ 0.99, Fig. 4). For scenarios with dominance (di = ri/2 or ri), the immediate response to selection declines rapidly at very high selfing rates (s ≥ 0.99), while the relationship is more U-shaped for more moderate selfing rates (Figure 4, 1 generation of selection). The initial decline in response to selection for intermediate rates of inbreeding followed by an increase for highly selfing populations (0.6 ≤ s ≤ 0.95) means that predominantly selfing populations may exhibit adaptive potential comparable to that for outcrossing populations (Fig. 4), notably for higher degrees of dominance (di = ri). These patterns remain true for low mutation rates (Fig. 4). In the mid-term, when dominance occurs, the response to selection is positively correlated with the selfing rate, unless populations are obligately selfing (Fig. 4, 20 generations of selection). When the mutation rate is low, however, long-term response to selection is limited in selfing populations, independently of the dominance level of alleles (Fig. 4). Adding several quantitative traits under stabilizing selection does not change the conclusions (Fig. S7).
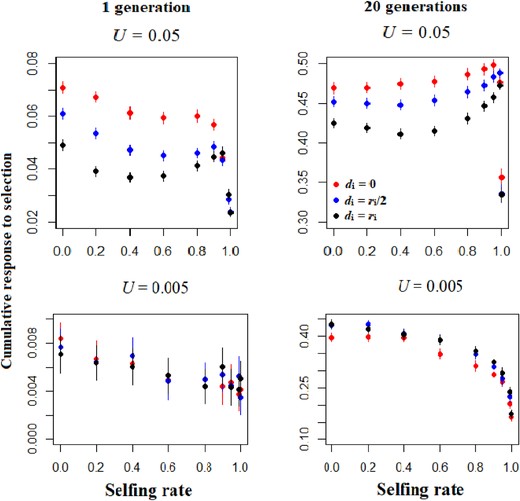
Cumulative response to directional selection over 1 and 20 generations as a function of the selfing rate, the dominance genetic effect and two mutation rates (U = 0.005 or 0.05). The red, blue and dark points represent data for additivity, partial dominance and complete dominance scenarios. Other parameters are N = 1000, L = 50, ω² = 1. Errors bars indicate 95% confidence intervals (n = 200).
PREDICTING RESPONSE TO SELECTION WITH INBREEDING AND DOMINANCE
Considering all relevant components of the genetic variance allows more accurate prediction of the response of a population to selection than is possible with a restricted model focused on the genic variance only (Fig. 5). Both models tend to overestimate the response to selection, but the upward bias is much greater when considering only the genic variance as a source of adaptive potential (Fig. 5). This effect relates largely to the contribution of the covariance of additive effect of alleles and their homozygous dominance deviations (σADI), which is negative and thus tends to decrease the response to selection. Importantly, the prediction of the full model can be far from the observed mean fitness change for populations that are highly but not completely selfing (0.9 ≤ s ≤ 0.95, Fig. 5), notably when the change in the optimum occurs in the same direction as the direction of dominance (Figure S8). The higher the degree of dominance, the more accurate is the full model compared to the restricted model (Fig. 5). The fact that this simplified model is reasonably accurate also comes from the fact that the level of inbreeding depression is negatively correlated with the selfing rate (Fig. 6) and can even be negative (i.e., outbreeding depression) for highly selfing populations (Fig. 6).
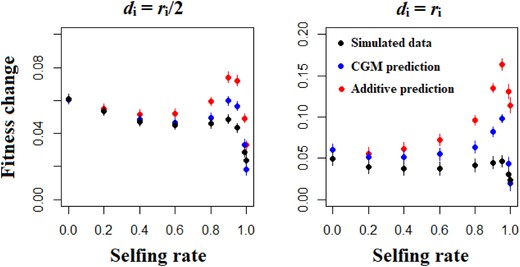
Simulated and predicted mean fitness change after one generation of directional selection, as a function of the selfing rate and the dominance genetic effects. The blue points represent predictions computed by using all the components of the genetic variance that contribute to adaptive potential (Covariance Genetic Model, equation 18). The red points represent predictions computed by using the genic variance only. The black points are the simulated data. Other parameters are N = 1000, L = 50, U = 0.05, and ω² = 1. Errors bars indicate 95% confidence intervals (n = 200).
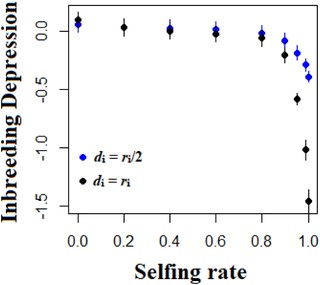
Mean level of inbreeding depression (ID, equation 19), as a function of the selfing rate and the level of dominance. The blue and black points represent values for partial dominance and complete dominance. Other parameters are N = 1000, L = 50, U = 0.05 and ω² = 1. Errors bars indicate 95% confidence intervals (n = 200).
QUESTION 3: THE EFFECT OF SHIFTING FROM OUTCROSSING TO SELFING ON ADDITIVE VARIANCE
The empirical estimates of all the genetic-variance components for floral and fitness traits compiled from the literature suggest that considering all the components is critical for understanding the adaptive potential of historically outcrossing populations in the event of a shift towards selfing (Fig. 7). In the full model, switching from obligate outcrossing to complete selfing increases the adaptive potential by a factor of 3, compared to a factor of 2 for the additive model (Fig. 7). The simulated data agree with this pattern when genetic diversity is low (i.e., for low mutation rates and/or strong stabilizing selection, Fig. 7; Fig. S9 and S10). The rate of increase in adaptive potential with increasing selfing rate depends on the degree of dominance and is stronger for complete dominance (Fig. 7). When genetic diversity is higher (for high mutation rate and/or weak stabilizing selection), on the other hand, the increase in adaptive potential with selfing is weaker under the full model than under the additive model (Fig. S11). Interestingly, several of our simulation sets corresponds well to the pattern in the empirical data (Fig. 7; Fig. S9 and S10), especially the case N = 1000, U = 0.005, L = 50, D = 1, and ω² = 9 (Fig. 7). These observations suggest that the studied traits may tend to be subject to strong dominance (0.5 ≤ D ≤ 1) and strong stabilizing selection (1 ≤ ω² ≤ 9).
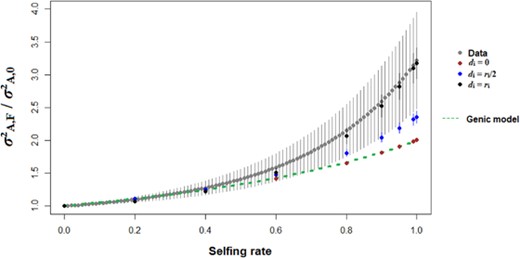
Evolution of the additive variance (equation 12) for a randomly mating population (s = 0) in the event of a switch to a given selfing rate s. Grey points represent average values for empirical estimates (± 1 SE, see eq. 20 for details, and Table S1 for the data), whereas red, blue and black points represent simulation results for di = 0, ri/2 and ri, respectively. The genic model represents the classical prediction of an increase of the adaptive potential of a factor (1+F). Other parameters values are N = 1000, U = 0.005, L = 50, and ω² = 9. Errors bars indicate 95% confidence intervals for simulated values (n = 200), and standard errors for empirical values (n = 22).
Discussion
Shifts in mating systems can have important implications for trait evolvability and hence the potential of populations to adapt to shifting adaptive optima. Here, we have explored the effect of dominance on a quantitative trait under stabilizing selection. We have shown that the additive variance is always the largest component of the genetic variance, but the relative contribution of each component of the genetic variance depends on the degree of dominance and the selfing rate of the population under study. For inbred populations, even if the contribution of those dominance terms specific to inbred populations can be moderate, incorporating them into models of response to selection greatly improves the predictive power. We also showed that a simplification of existing models of selection response in partially selfing populations do not lead to dramatic reductions in predictive power. The overall effect of dominance is to flatten the effect of mating system on the immediate response to selection, notably by reducing the standing genetic variation of randomly mating populations compared to the additive model (Fig. 2). In the mid-term, the effect of selfing depends on the patterns of genetic associations within populations. For high mutation rates, response to selection is positively correlated with the selfing rate of populations, as the release of genetic diversity stored in linkage disequilibrium may then fuel response to selection. For low mutation rates and low linkage disequilibrium, we found the opposite pattern that the immediate response to selection was uncorrelated with the selfing rate with dominance, but the relationship became negative over time. Finally, based on empirical estimates of all relevant components of genetic variance in partially inbred species, we have shown that the transition from obligate outcrossing to selfing is probably more advantageous in terms of adaptive potential than previously expected, suggesting that selfing may evolve under a wider range of conditions than traditionally thought. The comparison of empirical estimates of variance components to our simulation results allowed us to formulate hypotheses about the strength of stabilizing selection typically acting on fitness-related traits.
THE DECOMPOSITION OF THE GENETIC VARIANCE UNDER DOMINANCE AND INBREEDING
Our simulations demonstrate that most of the genetic variance is explained by the additive variance (as defined by Cockerham and Weir 1984). For outcrossing populations, where only the genic and classical dominance variance (σ²DR) contributes to genetic diversity, we found that dominance variance never explains more than 30% of the genetic variance. This result extends the theoretical predictions of Hill et al. (2008), namely that dominance variance contributes only a small fraction of the genetic variance and that adding selection on the focal trait does not alter qualitatively these results. Empirical results are more variable, and dominance variance can explain from 0 to almost 100% of the genetic variance (see Wolak and Keller 2014 and Class and Brommer 2020 for brief reviews). Estimates from natural populations are rare and hence prevent generalization about the contribution of dominance to genetic variance, but most estimates suggest a dominance contribution of less than 50% (Mullin et al. 1992; Abney et al. 2000; Merilä et al. 2001; Waldmann et al. 2008; Silva et al. 2010; Class and Brommer 2020), in agreement with our simulation results.
When considering all relevant components of the genetic variance, we found that the genic variance, the variance of dominance deviations in a fully inbred populations, and the covariance between additive effects of alleles and their homozygous dominance deviations are important components to consider if we want to understand the adaptive potential of populations. The contribution of these terms to the genetic variance is important mainly for highly selfing populations for which the inbreeding coefficient is high. This result agrees with the few empirical data available in the literature (Hoeschele and Vollema 1993; Shaw et al. 1998; Edwards and Lamkey 2002; Kelly 2003; Kelly and Arathi 2003; Marriage and Kelly 2009). Again, more empirical results are needed to gain insight into the evolutionary importance of these components in concrete cases. The scarcity of such data in the literature almost certainly relates to the complexity of their inference, which necessitates either complicated crossing designs (Shaw et al. 1998), or the use of fully inbred lines (Kelly and Arathi 2003). Exploiting predominantly selfing species is probably the easiest way forward towards greater empirical insight into these processes (Gay et al. 2013), because their populations are naturally organized into fully inbred lines (Siol et al. 2008; Jullien et al. 2019). By considering the selfed progenies of these natural lines as well as the rare hybrids produced by residual allogamy between the repeated multi-locus genotypes, it is possible to estimate all the components of the genetic variance (Kelly and Arathi 2003).
CONSEQUENCES OF A MATING SYSTEM SHIFT FOR SHORT- AND LONG-TERM ADAPTIVE POTENTIAL
Based on a fully additive model, a shift from outcrossing to selfing increases the adaptive potential by a factor 1 + F (Wright 1931). By considering a more realistic genetic architecture of quantitative traits, and by compiling empirical estimates of all genetic components of mixed-mating plants, we have shown that the gain in adaptive potential can be greater than in the additive model, notably when tending toward high selfing rates (s ≥ 0.8). This strong beneficial effect can contribute to explain why transitions from outcrossing to selfing are so frequent (Wright et al. 2013). The good fit between our simulation results and the empirical data allowed us to hypothesize that the floral traits studied in N. menziesii (Shaw et al. 1998) and M. guttatus (Kelly 2003; Kelly and Arathi 2003; Marriage and Kelly 2009) tend to be under strong stabilizing selection (1 ≤ ω² ≤ 9). This insight must be taken as provisional, however, because other parameter sets not consider here could conceivably fit the empirical data equally well. Estimates of the strength of stabilizing selection acting on fitness-related traits are rare in the literature (Kingsolver et al. 2001), and our results stress the importance of further investigations.
One important insight from our simulations is that, in the long term, the reduction of genic variance due to purifying selection and dominance in outcrossing and mixed-mating populations lead to a limited effect of the selfing rate on the immediate response to selection. This is in agreement with the overall weak relationship between the selfing rate and the adaptive potential of populations detected in meta-analyses (Charlesworth and Charlesworth 1995; Geber and Griffen 2003; Ashman and Majetic 2006; Opedal et al. 2017; Clo et al. 2019). In addition, Clo et al. (2019) found that narrow sense-heritabilities of strictly allogamous species did not differ detectably from broad-sense heritabilities of predominantly selfing species (selfing rate ≥ 0.8), which is expected to be a more accurate predictor of evolutionary potential for this mating-system category. While these studies have assessed relationships between mating systems and standing genetic variance, we are not aware of any experiments comparing the realized response to selection for a trait in populations that truly differ in their mating regimes (Holeski and Kelly 2006 and Noël et al. 2017 artificially manipulated the selfing rates of their model organisms). Such experiments are necessary to assess the realized effect of mating systems on adaptive potential because no integrative measures of the additive variance of populations as a function of their selfing rate are available in the literature. The best way to estimate the “realized” evolvability (additive variance) of a trait remains to impose directional selection, and control for the selection differential (as in Noël et al. 2017). In addition, this approach may be the most promising way forward for estimating additive variance in mixed-mating and predominantly selfing populations, notably if the aim is not to estimate the exact value of each component of the genetic variance. The effect of selfing on the mid-term adaptive potential will depend on the strength of genetic associations. When they are strong, selfing remains at least as advantageous as outcrossing, and can even be more advantageous, as the remobilization of the diversity stored within genetic associations will fuel the response to selection in later generations. Such associations are expected to be common in natural populations (Rieseberg et al. 1999). If these associations are negligible, on the other hand, the neutral effect of selfing in the short-term becomes negative in the mid-term, as selection in selfing populations will occur on the few lines segregating in the populations (Clo et al. 2020), while outcrossing populations will adapt from standing genetic variation accumulated at equilibrium.
PREDICTING THE RESPONSE TO SELECTION IN PARTIALLY SELFING POPULATIONS
To evaluate the importance of non-additive variance components for selection response, we tested if a simplification of the structured linear model (Kelly 1999a) can be a good predictor of the evolution of population mean fitness. Although the additional genetic variance components relevant to inbred populations (σ²DI, σADI, and H*) contribute only moderately to the genetic variance of the population, the single-cohort model we used proved always to be more accurate than a fully additive model, even when dominance is not directional on average, in agreement with a previous investigation by Kelly and Williamson (2000). The additive model generally overestimates the response to selection compared to the full model, notably because it ignores the covariance between the additive effects of alleles and their homozygous dominance deviations, which can be substantially negative as previously pointed out by Shaw et al. (1998). The single-cohort model is expected to be inaccurate when inbreeding depression is strong (Kelly and Williamson 2000), which was not the case in our simulations because the quantitative trait under study is already under selection, or when the selected individuals are not a random sample of the inbreeding classes (Kelly 1999a; Walsh and Lynch 2018). Inbreeding depression does not seem to alter our ability to predict response to selection, notably because it is purged with selfing (Fig. 6). A surprising result was that, with dominance, highly selfing populations may be subject to substantial outbreeding depression. Dominance can cause negative inbreeding depression within a highly selfing population because inbred individuals have high fitness (they are adapted to the local optima), but outcrossing events among inbred lines revealed the dominance relationship among alleles fixed in parental lines, and make hybrids deviate from the phenotypic optimum, leading to a more or less drastic decrease in fitness. This result is supported empirically, because studies of Caenorhabditis elegans (Dolgin et al. 2007; Gimond et al. 2013) and Priquieta caroliniana (Rhode and Cruzan 2005) have found that hybrids from naturally occurring inbred lines within a population were less fit than selfed parental lines.
We found that this latter mechanism can greatly bias the predictions derived from the simplified model for highly but not fully selfing populations when the dominance deviations and selection act in the same direction. This discrepancy is notably due to the fact that for such selfing rates populations are organized into inbred lines (Lande and Porcher 2015; Abu Awad and Roze 2018), and hybridization events between those lines creates F1 hybrids in which directional dominance is fully expressed. If the dominance and selection act in the same direction, it will split the population into two cohorts, one with those F1 that were selected against before the change, and another cohort of inbred lines that are less fit than their hybrids (Clo et al. 2020). In such cases, the inbreeding coefficient of the selected individuals is much lower than expected for such selfing rates, explaining the difference between predicted and observed changes (Kelly 1999a). If dominance and selection act in different directions, F1 hybrids will be less fit than inbred lines in the new environment, and the selected individuals will have an inbreeding coefficient closer to that expected under such a high selfing rate, explaining why our simplification is more accurate in this case (Fig. S6). Because the response to selection after an environmental change can be fuelled by the remobilization of cryptic diversity stored in negative linkage disequilibrium by residual allogamy in predominantly selfing species (Clo et al. 2020), we expect that the alignment between dominance and selection will have a major effect on the short-term adaptive potential of inbred populations. Notably, if hybrids are selected against because dominance generates recombinant individuals far from the new phenotypic optimum, the remobilization of cryptic diversity by residual allogamy will not occur, and response to selection will be based on inbred lines, limiting the adaptive potential of selfing populations (Noël et al. 2017; Clo et al. 2020).
Conclusions and Implications for Evolution in Changing Reproductive Environments
Our results offer some insights into the consequences of a change in the reproductive environment, such as a decline in the reliability of pollination leading to a shift toward a greater rate of selfing. Based on our simulations, if a shift in the phenotypic optimum occurs, the ability of populations to track this shift is not compromised by an increased rate of selfing. This suggests that reduced adaptive potential is unlikely to make predominantly selfing an evolutionary “dead end” (Stebbins 1957), at least in the short term. Indeed, if the mutation rate on the phenotypic trait is sufficiently high so that genetic associations contribute to genetic variance, the release of such diversity could allow predominantly selfing lineages to evolve faster than outcrossing or mixed-mating lineages. While some support for Stebbins’ classic hypothesis has come from phylogenetic studies showing increased diversification rates of some self-incompatible taxa (e.g., Goldberg et al. 2010), it is not well understood whether similar trends exist for mixed-mating lineages with continuous variation in outcrossing rates (Wright et al. 2013). Our finding that evolutionary potential remains comparable across the entire gradient in outcrossing rates suggest that other ecological or evolutionary mechanisms need to be invoked to explain reduced evolutionary success of (partially) selfing species. For example, it is known that selfing populations occurs more frequently at range margins (Griffin and Willi 2014), and at higher latitudes (Grossenbacher et al. 2015), compared to outcrossing populations. These environments are generally harsh, with for example more extreme temperatures, increased seasonality, and less biotic diversity (Mittelbach et al. 2007). It is possible that the probability of extinction is not affected by the mating system in the core of species distributions, but selfing populations occurring in harsher environment could be more prone to extinction as genetic variance is reduced under such conditions (Martínez-Padilla et al. 2017). Another interesting question would be to investigate which levels of selfing are more prone to extinction. Goldberg et al. (2010) reported higher extinction rates of self-compatible lineages, but nothing is known about which levels of selfing are driving this pattern. Notably, the transition from outcrossing to selfing can be highly risky, as it exposes inbreeding load to selection, decreasing at least temporarily the fitness of the population (Cheptou 2004), and increases the probability of fixing deleterious mutations due to a decrease in effective population size (Abu Awad and Billard 2017). Nevertheless, in such a case, the extinction is theoretically so fast that it could not be detectable in phylogenetic data (Abu Awad and Billard 2017). These two phenomena can lead to population extinction (Cheptou 2019).
Hence, further studies are needed to understand when and how selfing can be an evolutionary dead-end. For example, it is important to note that our model remains simplistic and does not consider other factors influencing the amount of diversity for a quantitative trait such as linked selection and recurrent bottlenecks that often occur for selfing populations. In addition, quantitative-genetic models do not consider the effect of background deleterious mutations on the fitness of selfing populations, which are known to play a role in population viability. Integrating these factors into future model would contribute to a deeper understanding of the adaptive potential of selfing populations.
AUTHOR CONTRIBUTIONS
J.C. wrote the simulation code and compiled empirical data. J.C. and Ø.H.O. analyzed the results and wrote the manuscript.
ACKNOWLEDGMENTS
We thank J.K. Kelly for providing information about the interpretation of the quantitative traits measured in Mimulus. We thank R. Shaw, T. Bataillon, J. Ronfort, and E.V. Tambarussi for helpful comments on the manuscript. We thank Sylvain Glémin and two anonymous reviewers that helped improve the clarity and interpretation of the manuscript. We finally thank the Evolvability Working Group at the Centre for Advanced Study in Oslo for hosting us during parts of the work. This work has been conducted with the help of the data and calculation centre South Green of the CIRAD-UMR AGAP.
DATA ARCHIVING
Code and data will have been deposited on Dryad (https://datadryad.org/stash/share/ps5OvvZMk2PNg8WQvANqQG964IT1FkGmGVCbBdkG4m0).
CONFLICT OF INTEREST
Authors declare no conflict of interest.
LITERATURE CITED
Associate Editor: S. Glemin
Handling Editor: M. Zelditch
