


Abstract
Parasitic worms (i.e., helminths) commonly infect multiple hosts in succession. With every transmission step, they risk not infecting the next host and thus dying before reproducing. Given this risk, what are the benefits of complex life cycles? Using a dataset for 973 species of trophically transmitted acanthocephalans, cestodes, and nematodes, we tested whether hosts at the start of a life cycle increase transmission and whether hosts at the end of a life cycle enable growth to larger, more fecund sizes. Helminths with longer life cycles, that is, more successive hosts, infected conspicuously smaller first hosts, slightly larger final hosts, and exploited trophic links with lower predator–prey mass ratios. Smaller first hosts likely facilitate transmission because of their higher abundance and because parasite propagules were the size of their normal food. Bigger definitive hosts likely increase fecundity because parasites grew larger in big hosts, particularly endotherms. Helminths with long life cycles attained larger adult sizes through later maturation, not faster growth. Our results indicate that complex helminth life cycles are ubiquitous because growth and reproduction are highest in large, endothermic hosts that are typically only accessible via small intermediate hosts, that is, the best hosts for growth and transmission are not the same.
Parasitic worms (i.e., helminths: acanthocephalans, cestodes, trematodes, and nematodes) have diverse life cycles. Some exhibit a simple (direct) life cycle in which they grow and sexually mature in a single host before releasing propagules (eggs or larvae). Many more have complex (indirect) life cycles in which one or more intermediate hosts are infected before transmission to a definitive, or final, host (Chubb et al. 2010). Complex life cycles delay reproduction at the expense of mortality (Parker et al. 2003, 2015; Iwasa and Wada 2006; Ball et al. 2008). For example, a helminth with an obligate two-host life cycle risks dying without reproducing if the first host dies, if the first host does not encounter the second host, if the parasite cannot establish infection in the second host, or if the parasite dies before sexual maturation in the second host. Only the first of these risks occurs in a one-host cycle. Helminths exhibit various adaptations to minimize these risks, such as sub-lethal exploitation of intermediate hosts (Hurd et al. 2001; Michaud et al. 2006; Benesh 2011), low host specificity at some stages (Rudolf and Lafferty 2011; Benesh et al. 2021), manipulating hosts to increase transmission (Moore 2002; Cézilly et al. 2010), changing morphologies to aid establishment in the next host (Hammerschmidt and Kurtz 2005; Lee et al. 2020), and optimizing maturation time (Gemmill et al. 1999). Nonetheless, helminths with complex life cycles risk two or more transmission events versus one in a simple life cycle. Given this, complex life cycles should also have benefits that can explain their ubiquity.
Helminths are often trophically transmitted—one host is eaten by the next host. So, one way to evolve a complex life cycle is to incorporate a prey item of the current host as a new intermediate host, which Parker et al. (2003) called downward incorporation. The benefit is that the new host reduces propagule mortality and facilitates transmission to the original host. The other way to extend a life cycle is upward incorporation; a predator of a parasite's current host is added to the life cycle as a new definitive host. Infecting the predator reduces the parasite's mortality and may enable it to grow rapidly to larger sizes with higher fecundity; fecundity is normally proportional to body size in helminths, both within (Sinniah and Subramaniam 1991; Schärer et al. 2001; Hassanine and Al-Jahdali 2008) and across species (Skorping et al. 1991; Trouvé et al. 1998). There are possible examples for both upward (acanthocephalan definitive hosts; Wey-Fabrizius et al. 2014) and downward (trematode and cestode intermediate hosts; Perkins et al. 2010) host incorporation. But regardless of how complex life cycles evolved, their evolutionary maintenance suggests the benefits of downward and/or upward incorporation should still be evident in life cycles with more successive hosts.
Facilitating transmission is undoubtedly a key function of intermediate hosts (Morand et al. 1995; Choisy et al. 2003; Gandon 2004; Poulin and Leung 2011), but how many intermediate hosts are needed to reach a given definitive host? Nematode life cycles include more intermediate hosts when they end in top predators, presumably because transmission to top predators is likelier via prey intermediate hosts than via propagules; the intermediate hosts fill a trophic vacuum (Benesh et al. 2014). This trophic vacuum may “widen” when the life cycle starts in smaller, lower-trophic-level hosts. Smaller animals are presumably more likely to encounter parasite propagules (if they are more numerous than larger animals; Cohen et al. 2003; Hatton et al. 2019) and to consume them (if propagules are the size of their normal food items; Williams and Martinez 2000), so propagule transmission may be higher to small, low-trophic level hosts (i.e., a selective benefit of downward host incorporation). However, getting from them to large, high-trophic-level hosts likely requires more intermediate hosts in between. This is not inevitable, though, as there are various ways to ascend trophic chains. Most prey have multiple predators (Digel et al. 2011) and predators generally feed across multiple trophic levels (Williams and Martinez 2004); parasites may even forge new trophic interactions (Thompson et al. 2005; Amundsen et al. 2009; Valtonen et al. 2010). Thus, shorter parasite life cycles might have larger trophic “jumps”, that is, larger changes in host mass and/or trophic level between successive hosts. However parasites get to a large host, once in them, there is little reason to suppress reproduction, because there are few or no predators as potential next hosts (Benesh et al. 2021) and those next hosts may not be much bigger (predator-prey mass ratios decline with size; Bersier and Kehrli 2008; Brose et al. 2019).
Host body mass and diet not only affect transmission but also parasite growth. For example, growth in bigger hosts may be limited by a more sophisticated immune system (Stear et al. 1999; Sorci et al. 2003; Brace et al. 2017) or by competition with other parasites (intraspecific: Arneberg et al. 1998; Randhawa and Poulin 2009, or interspecific: Sousa 1994; Poulin et al. 2003a), especially since parasite aggregation increases with host trophic level (Lester and Mcvinish 2016). On the other hand, parasites may be able to grow faster in hosts that consume more energy, like large endotherms (Brown et al. 2004). Larger animals also live longer on average, so parasites infecting them may have lower mortality. When parasites can grow rapidly and safely, life history theory suggests they should mature at larger sizes (Gemmill et al. 1999; Parker et al. 2003; Sorci et al. 2003; Iwasa and Wada 2006). Consistent with this, large hosts often harbor large helminths (Morand et al. 1996; Arneberg et al. 1998; Poulin et al. 2003b; Trouvé et al. 2003; Randhawa and Poulin 2009) and endotherms harbor larger helminths than ectotherms of the same size (Poulin et al. 2003b, but see Poulin and Latham 2003). But are “good” hosts for growth only encountered after more transmission steps (i.e. the presumed benefit of upward host incorporation)? Nematodes with longer life-cycle length (LCL; number of successive hosts in the life cycle) reproduce in top predators (Benesh et al. 2014), and top predators tend to be large and disproportionately endothermic (Riede et al. 2011), perhaps enabling large parasite sizes. As a counterexample, though, many nematodes with simple life cycles infect large grazing mammals (Chubb et al. 2020). Thus, a key-but-untested benefit of longer life cycles is that they transmit helminths to “good” definitive hosts for growth and thereby favor larger, more fecund reproductive sizes.
Larger adult sizes typically come at the expense of prolonged development, but it is not clear that age at maturity (i.e., the cumulative development time across hosts) should vary with LCL. In theory, total developmental time is constrained by interdependencies between hosts, for example, growing larger in an intermediate host decreases the optimal development time in the definitive host (Ball et al. 2008). Total developmental time may be shortened by rapid growth in some hosts and/or by forgoing development in others, like paratenic hosts (Parker et al. 2009), which are more common in longer life cycles (Chubb et al. 2010). So, depending on how growth rates vary, long LCL may or may not be associated with later ages at maturity.
Each transmission step in a complex life cycle entails some risk of dying before reproducing. Complex life cycles may nevertheless evolve if they facilitate transmission to hosts that enable further growth and thus higher fecundity. We assessed the presumed benefits of downward and upward host incorporation by combining an extensive compilation of acanthocephalan, cestode, and nematode life cycles with host traits. We tested whether parasites with longer life cycles are more likely to (i) infect small, low trophic level first hosts, (ii) exploit trophic links characterized by smaller changes in host mass or trophic level, and (iii) reproduce in large, carnivorous endotherms. Then we examined how these differences impact parasite life history, specifically whether parasites with longer life cycles (iv) grow to larger adult sizes, (v) mature later, or (vi) grow faster. Our results suggest longer life cycles have benefits in terms of both growth and transmission.
Methods
HELMINTH LIFE CYCLES AND LIFE HISTORIES
For trophically transmitted acanthocephalans, cestodes, and nematodes, LCL was obtained from a database that includes 973 species from 123 parasite families (Benesh et al. 2017). Although diverse, the database includes proportionally fewer marine parasites, fewer reptile and amphibian parasites, and more mammal parasites, relative to their overall diversity (Froelick et al. 2021). The database does not include trematodes, whose life cycles usually include an asexually reproducing larval stage that is not trophically transmitted. Some parasites can complete their life cycles facultatively, with or without certain hosts; for these species, we recorded the maximum life-cycle length.
The database also includes body sizes and development times at each parasite life stage. Life stage refers to the “host in the cycle,” not specific ontogenetic stages (e.g., cysticercoid). For example, a parasite with a three-host life cycle has three stages: first intermediate host, second intermediate host, and third, definitive host. Parasite sizes were reported as lengths and widths, which we converted to biovolume based on a stage's shape (e.g., volume of a cylinder for thread-like worms, an ellipsoid for eggs, or a ribbon for flatworms). Biovolumes approximate masses when tissue density is constant (e.g., ∼1.1 g/cm3, Lambden and Johnson 2013; Llopis-Belenguer et al. 2018), and our biovolume estimates were similar to masses calculated from length-weight allometries for cestodes (Benesh et al. 2013), acanthocephalans (Benesh et al. 2009), and nematodes (Andrássy 1956). Acanthocephalans and nematodes are dioecious, and for adults of these taxa, we took just female size since it determines fecundity. Developmental times were the days until infectivity (for intermediate hosts) or sexual maturity (for definitive hosts; the prepatent period). Development is temperature-dependent, so we also calculated development in degree days (Trudgill et al. 2005): D × (T − B), where D is developmental time in days, T is the temperature at which development was observed, and B is a baseline temperature below which development does not occur (assumed to be 5°C). When stages had multiple measurements for body size or developmental time, we calculated averages.
For some species, the life cycle is only partially known (89 species). These were excluded from analyses requiring all life stages, such as age at maturity. We also excluded some cestode stages because of asexual reproduction (27 species). For example, Echinococcus spp. produce cysts containing many individual scolexes in intermediate hosts before they are transmitted to carnivore definitive hosts. Whereas total growth in the intermediate host is the difference between egg and cyst size, growth in the definitive host is hard to quantify, because the starting size of the clone depends on how many scolexes from the cyst are eaten and establish infection. We excluded stages where growth could not be determined for an “individual.”
HOST BODY MASS, TROPHIC LEVEL, AND ENDOTHERMY
Host masses and trophic levels were obtained from over 130 sources, some of the most important being Pantheria (Jones et al. 2009), FishBase (Froese and Pauly 2012), EltonTraits (Wilman et al. 2014), EOL (Life 2019), and a food web compilation (Brose et al. 2019). We converted dry and ash-free dry masses to wet mass by assuming body water contents of 70% and 90%, respectively (Ricciardi and Bourget 1998; Block 2003). In many taxa, body lengths are more commonly reported than masses, so we also collected lengths to estimate mass (see ‘Imputation’ below).
We determined host trophic levels from food webs, quantitative diets, or taxonomy. We assumed that basal resources like detritus and primary producers were at trophic level 1, so obligate detritivores and herbivores were at trophic level 2. In a compilation of food webs (Hechinger et al. 2011; Mouritsen et al. 2011; Thieltges et al. 2011; Zander et al. 2011; Preston et al. 2012; Brose et al. 2019), we estimated the short-weighted trophic level for every consumer (except parasites), which acknowledges that omnivores usually acquire more of their energy from lower trophic levels (Williams and Martinez 2004). Some quantitative diet datasets included trophic level estimates (Froese and Pauly 2012), but for those that did not (Wilman et al. 2014; Oliveira et al. 2017; Meiri 2018; Glaudas et al. 2019), we assumed consumers fed at trophic levels 2, 3, 3.5, and 4 when eating plants/detritus, invertebrates, terrestrial vertebrates, and fish, respectively. For example, if a species consumed 50% plant matter (level = 2) and 50% invertebrates (level = 3), then its trophic level was 2.5. When multiple trophic level estimates were available, such as when a species was in several food webs, we took the average. Finally, some trophic levels were assigned taxonomically (Table A1), as taxa often have characteristic diets(e.g. grasshoppers are primarily herbivores).
Parasites often infect multiple host species at a given life stage, so for each stage we calculated average host mass and trophic level. We considered a life stage to infect endotherms if it predominantly infects mammals or birds.
IMPUTATION OF HOST AND PARASITE TRAITS
There were 3426 host species in the life-cycle database (Benesh et al. 2017). We obtained body mass and trophic level estimates for 60% and 73% of them, and most parasite stages had a mass (85%) or trophic level estimate (83%) for at least one of their known host species. There were 1963 parasite stages from 967 species, and initial size, final size, and development time were available for 70%, 76%, and 41% of stages, respectively, with 27% having all three. Overall, just 20% of the parasite stages were complete for all host and parasite traits. To make full use of the data and limit potential biases, we imputed missing host and parasite traits (Nakagawa and Freckleton 2008).
We fitted Bayesian multivariate mixed models and then randomly sampled the posterior distribution of predicted values to generate 100 imputed datasets (Van Buuren 2018). Multivariate models include trait covariance and are thus useful for imputation. For example, longer worms are thicker (i.e. positive covariance between length and width), so a broad width is likely to be imputed for a long worm. We fitted separate models to impute host traits (body length, mass, and trophic level) and parasite traits (body length, width, development time, and temperature). Host and parasite traits were not used to impute each other because some parasite stages, such as eggs, lack associated host traits. All traits except trophic level and temperature were ln-transformed to fit assumptions of multivariate normality. All collected animal body masses (n = 71,443) and trophic levels (n = 98,975), not just those for hosts in the life-cycle database, were used for imputation. Details (e.g., predictor variables, model structure, etc.) are in Supporting Information A.
Taxonomy was included in imputation models and it was the most important predictor. Host taxonomy alone explained 99% of the variation in both host mass and trophic level, whereas the combination of taxonomy, parasite shape, and life stage accounted for 98% of the variation in parasite size and 87% of the variation in developmental time. The imputation models predicted observed data well (Fig. A2) and yielded plausible imputed values for various taxa (Fig. A3, A4).
However, the parasite model predicted unreasonably long developmental times for paratenic hosts. No obvious parasite development occurs in paratenic hosts, so developmental times are rarely reported. Imputed developmental times in paratenic hosts were unrealistically long (e.g., weeks instead of days) because they were driven by observed developmental times in obligate hosts. Helminths probably undergo some minimal development in paratenic hosts, as infecting a paratenic host can boost establishment success in the next host (Stigge and Bolek 2015; Benesh 2016). Any cryptic development probably takes less than a week, because longer development would probably be noticeable (95% of developmental times from obligate intermediate hosts were over a week). Thus, we randomly imputed developmental times in paratenic hosts to be from 1 to 7 days.
Results were comparable with and without imputation, although imputation affected inferences about parasite development. Analyses with imputation are presumably less biased, so we present those results in the main text, while the unimputed results are in Supporting Information B.
STATISTICAL MODELS AND HYPOTHESIS TESTING
We tested hypotheses with mixed models (MCMCglmm package in R, Hadfield 2010). To account for the effect of shared ancestry, we acquired parasite taxonomies from the Open Tree Taxonomy (Rees and Cranston 2017) and included taxonomic levels in the mixed models as nested random effects (Hadfield and Nakagawa 2010). Explained variance was estimated according to Nakagawa and Schielzeth (2013). For all analyses, we assessed how traits varied across parasite taxonomic levels, and we checked whether trends were consistent in the three helminth groups (acanthocephalans, cestodes, and nematodes, supplement E).
HOST TRAITS: THE KINDS OF HOSTS EXPLOITED IN LONG VS SHORT LIFE CYCLES
First, we explored how three host traits vary across parasite life cycles: host body mass, trophic level, and endothermy. For each, we started with a “base” model that included parasite taxonomy, and then we added host number (first host, second host, etc.), LCL (one-host cycle, two-host cycle, etc.), and their interaction.
Additionally, we tested whether LCL increases with definitive host trophic level. We documented this relationship in nematodes (Benesh et al. 2014), but we tested it again because our trophic level estimates, derived from food webs and diet data, are less subjective than those used previously. Moreover, we aimed to verify the pattern in acanthocephalans and cestodes. We fitted a taxonomic mixed model (Poisson errors) with LCL and definitive host trophic level as response and predictor variables, respectively.
HOST MASS RATIOS: ARE PARASITES WITH SHORT LIFE CYCLES TRANSMITTED FROM TINY TO GIANT HOSTS?
Bigger predators eat bigger prey. Brose et al. (2019) reported the correlation (major axis regression) between predator and prey mass for ∼88,000 trophic interactions from diverse ecosystems. We assumed this relationship approximates normal predator-prey mass ratios, and we examined how parasitized trophic links deviated from it. We calculated the difference between next host (predator) mass and that expected from the current host (prey) mass (i.e., the residuals). A positive residual, for example, suggests a parasite's next host is large compared to other predators that eat prey with the current host's size. Parasites infect first hosts via propagules (eggs or free larvae), so at this stage we took propagule volume as the prey mass. We analyzed these host mass residuals with taxonomic mixed models.
PARASITE GROWTH: IN WHICH HOSTS DO PARASITES GROW FAST AND LARGE?
We next assessed how host traits impacted helminth growth. We included all parasite stages (i.e. intermediate and definitive hosts) and examined three traits that together determine growth rate: initial size at infection, final size achieved, and developmental time. These traits were ln-transformed and analyzed with trivariate mixed models (Gaussian errors, identity link) including parasite taxonomy as random effects. We added host traits (mass, trophic level, and endothermy) and all their second-order interactions as predictors. Then, we added parasite stage to the model (i.e., first host in one-host cycle, first host in two-host cycle, etc.) to test whether some stages grow more (or less) than expected given the hosts they infect.
Trivariate models included trait covariance. For example, parasites that grew more at a given stage developed longer, i.e. there was positive covariance between developmental time and final size. By accounting for this, trivariate models yield more realistic combinations of the three traits determining parasite growth rate. We therefore examined variation in relative growth rate ( = (ln end size – ln start size) / development time) by sampling the model's posterior distribution at relevant predictor values (e.g. large vs small hosts, endotherms vs ectotherms, particular stages, etc.).
PARASITE SIZE AND AGE AT MATURITY: LONG LIFE CYCLE, BIG AND OLD ADULTS?
Finally, we compared three species-level parasite traits across LCLs: adult size, age at maturity, and lifetime growth rate. We fitted another trivariate taxonomic mixed model with propagule size, adult size, and cumulative development time as response variables and LCL as a predictor. We again used the model's posterior distribution to calculate growth rate, this time over the full life cycle, as (ln adult size – ln propagule size) / cumulative development time.
Results
HOST TRAITS: SMALLER FIRST HOSTS AND SLIGHTLY LARGER FINAL HOSTS IN LONGER LIFE CYCLES
As expected, host mass, trophic level, and endothermy all increased with life cycle progression (Fig. 1). However, the increase was neither linear nor identical in short versus long cycles (Table 1). For example, average host mass increased more between first and second hosts than between second and third hosts (∼20,000 vs 30-fold; Fig. 1A). Definitive host mass increased weakly with LCL (∼2-, 5-, and 5-fold from one- to two- to three- to four-host life cycles), and first host mass decreased strongly with LCL (∼9000-, 18-, and 10-fold). Overall, helminths with longer cycles infected smaller first hosts and required more transmission steps to reach marginally larger definitive hosts (Fig. 1A).
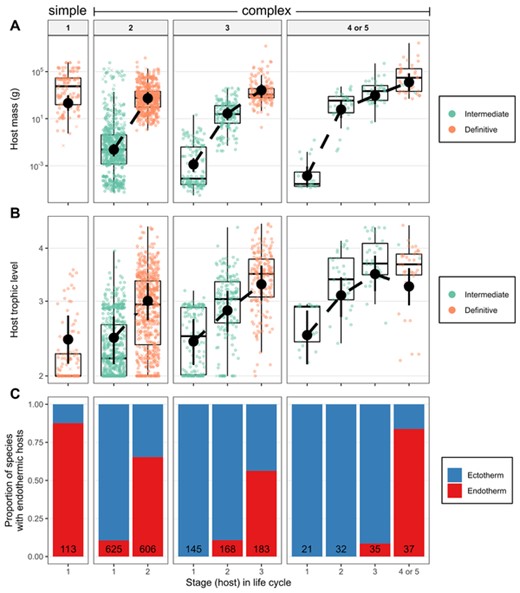
(A) Host mass, (B) trophic level, and (C) endothermy across parasite life cycles. Parasites are paneled by life-cycle length, and colors differentiate larval and adult stages in (A) and (B). Missing data were imputed; X's represent the average from 100 imputations of the y-axis variable. Circles are observed data. Black point ranges are means and 95% credible intervals estimated from mixed models accounting for parasite taxonomy and missing data. The number of species are in the bars in (C).
Mixed models examining how four host characteristics vary across 1963 life stages of 967 species of complex life cycle parasites. Host mass, trophic level, and residual predator mass were analyzed with standard mixed models (Gaussian errors, identity link) while endothermy was assessed with a generalized linear mixed model (binomial errors, logit link). Marginal R2 (R2m) represents the variation explained by fixed effects, while conditional R2 (R2c) represents that explained by random and fixed effects combined. The difference between R2c and R2m is the variation explained by parasite taxonomy. For both R2 metrics, 95% credible intervals are given
| Body mass | Trophic level | Endothermy | Residual next host mass | ||||||||||
|---|---|---|---|---|---|---|---|---|---|---|---|---|---|
| Term | df | DIC | R2m | R2c | DIC | R2m | R2c | DIC | R2m† | R2c† | DIC | R2m | R2c |
| +Taxonomy random effects | - | 9441 | - | 0.18 [0.11-0.43] | 2961 | - | 0.45 [0.34-0.85] | 2524 | - | 0.41 [0.10-0.88] | 11566 | - | 0.43 [0.33-0.87] |
| +Host in cycle (continuous) | 1 | 7354 | 0.46 [0.10-0.53* | 0.82 [0.78-0.96] | 2171 | 0.26 [0.12-0.31]* | 0.58 [0.52-0.81] | 2308 | 0.08 [0.01-0.14]* | 0.53 [0.25-0.93] | 11566 | 0 [0-0] | 0.44 [0.33-0.83] |
| +Host in cycle (factor) | 2 | 6810 | 0.48 [0.14-0.56] | 0.86 [0.83-0.96] | 2079 | 0.27 [0.09-0.32]* | 0.59 [0.54-0.86] | - | - | - | 11566 | 0 [0-0.01]* | 0.44 [0.34-0.89] |
| +Life cycle length (LCL, factor) | 3 | 6535 | 0.66 [0.55-0.70]* | 0.82 [0.80-0.85] | 2062 | 0.27 [0.12-0.33] | 0.60 [0.55-0.83] | 1669 | 0.39 [0.10-0.55]* | 0.74 [0.62-0.93] | 11330 | 0.29 [0.24-0.33]* | 0.35 [0.31-0.40] |
| +Host x LCL | 3 | 6525 | 0.67 [0.53-0.70]* | 0.82 [0.80-0.85] | 2063 | 0.27 [0.11-0.33] | 0.61 [0.55-0.84] | 1647 | 0.44 [0.12-0.61]* | 0.76 [0.66-0.93] | 11328 | 0.29 [0.25-0.33] | 0.36 [0.32-0.41] |
One or more of the added fixed effect parameters in the model were significant (95% credible interval did not overlap zero)
R2 values were calculated from simpler models that avoided complete separation. Complete separation occurred if, for example, all members of a parasite taxon infected endotherms as definitive host. This inflates parameter estimates, because essentially all the residual variation can be explained by taxonomy. The model therefore treated transmission step and life cycle length as continuous variables and only included parasite class and phylum as random effects (lower taxonomic levels exhibited compete separation).
By contrast, first host trophic level (∼2.4 [CI = 2.1 – 2.7]) and the rate of trophic ascent (0.43 [CI = 0.40 – 0.46] trophic levels per life stage) were similar in long vs short life cycles (Fig. 1B), with LCL explaining <1% of the variation in host trophic level (Table 1). Given the steady increase in trophic level, apart from definitive hosts in four-host cycles, parasites with longer LCL tended to reproduce in higher trophic level hosts (Fig. 1B). This was observed in all three helminth groups (Fig. C1), suggesting the trophic vacuum is a general constraint on parasite life cycles (Supporting Information C).
Endotherms were primarily definitive hosts, so helminths with longer LCL typically have more transmission steps before infecting an endotherm (Fig. 1C; Table 1).
HOST MASS RATIOS: LARGER RATIOS IN SHORTER LIFE CYCLES
Parasites infected next hosts that were ∼327-fold [CI = 10–14,800] larger on average than the usual predator eating prey the size of their current host (Fig. 2A). However, host mass ratios decreased with LCL and neared typical predator-prey ratios in longer life cycles (Fig 2B); for one-, two-, three-, and four-host cycles, next host mass was 5 million-, 382-, 25-, and 8-fold larger than expected from the mass of the current host (or propagule). Host number explained <1% of the variation (Table 1), indicating that host mass ratios were relatively consistent from one parasite stage to the next for a given LCL (Fig. 2B).
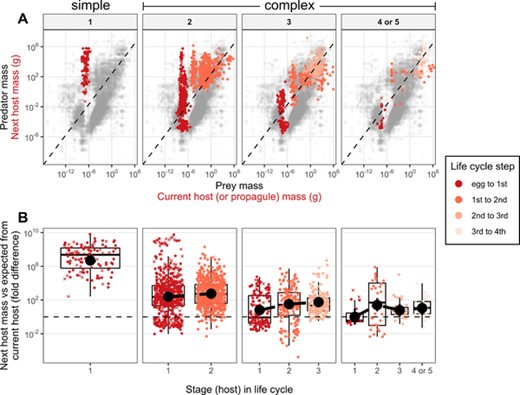
(A) Predator vs prey mass. Gray points are predator and prey masses (n = 87,624) from Brose et al. (2019). The dashed line is the major axis regression and represents typical predator-prey mass ratios. Trophic links exploited by parasites are overlaid as colored points with current host (or propagule) mass as prey and next host mass as predator. (B) The difference between observed and expected next host mass (i.e., the residuals from (A)) plotted by life cycle stage. Black point ranges are means and 95% credible intervals estimated from mixed models accounting for parasite taxonomy and missing data. Missing masses were imputed; X's represent the average from 100 imputations of the y-axis variable. Circles are observed data. Panels separate parasites by life-cycle length.
PARASITE GROWTH: LARGER AND FASTER IN BIG ENDOTHERMIC HOSTS
Host trait main effects (mass, trophic level, and endothermy) explained 58, 43, and 5% of the variation in the final size, initial size, and developmental time of parasite stages (Table 2). Interactions among host traits were significant but explained little additional variation (<3%, Table 2).
Trivariate models (Gaussian errors, identity link) examined how three stage-level parasite traits (starting size, final size, and developmental time) varied with three host traits (host mass, trophic level, and endothermy) or with parasite life stage (i.e. first host in one-host cycle, first host in two-host cycle, etc.). Parasite developmental time was assessed in either days or degree days. The analysis included 1963 parasite stages from 967 species. Columns as in Table 1
| Initial size | Final size | Devo time (DT), days | DT, degree days | |||||||
|---|---|---|---|---|---|---|---|---|---|---|
| Term | df | DIC | R2m | R2c | R2m | R2c | R2m | R2c | R2m | R2c |
| Base model | ||||||||||
| +Taxonomy random effects | - | 26354 | - | 0.14 [0.08-0.29] | - | 0.15 [0.11-0.27] | - | 0.38 [0.28-0.66] | - | 0.36 [0.26-0.65] |
| Host traits | ||||||||||
| +Host traits | 3 | 23289 | 0.42 [0.34-0.47]* | 0.63 [0.58-0.70] | 0.57 [0.38-0.64]* | 0.80 [0.77-0.87] | 0.03 [0.01-0.05]* | 0.41 [0.30-0.66] | 0.16 [0.09-0.21]* | 0.49 [0.41-0.70] |
| +Host traits (interactions) | 3 | 23189 | 0.43 [0.36-0.48]* | 0.63 [0.59-0.70] | 0.58 [0.40-0.64]* | 0.80 [0.78-0.86] | 0.05 [0.03-0.08]* | 0.44 [0.34-0.66] | 0.18 [0.10-0.23]* | 0.51 [0.43-0.71] |
| Life cycle characteristics | ||||||||||
| +Parasite stage only | 9 | 21160 | 0.54 [0.44-0.59]* | 0.73 [0.70-0.77] | 0.55 [0.38-0.60]* | 0.81 [0.79-0.87] | 0.17 [0.09-0.22]* | 0.58 [0.48-0.79] | 0.27 [0.15-0.32]* | 0.65 [0.59-81] |
| Combined | ||||||||||
| +Host traits and parasite stage | 9 | 20434 | 0.59 [0.51-0.63]* | 0.78 [0.76-0.81] | 0.60 [0.40-0.67]* | 0.85 [0.83-0.90] | 0.21 [0.11-0.26]* | 0.60 [0.52-0.78] | 0.31 [0.17-0.38]* | 0.66 [0.60-0.81] |
One or more of the added fixed effect parameters in the model were significant (95% credible interval did not overlap zero)
Initial helminth size increased 18% [CI = 15–20%] (Fig. 3A) with a doubling of host mass, whereas final size increased 35% [CI = 33–37%] (Fig. 3C), indicating parasites grew more in larger hosts. For example, the model estimated parasites to grow ∼79 fold in a 1 mg host versus ∼1350 fold in a 10 kg host. Moreover, helminths grew more in endotherms than in comparably sized ectotherms (e.g., ∼3000-fold vs. 400-fold growth in a 10 g endotherm vs. ectotherm). Endotherms and ectotherms were disproportionally definitive or intermediate hosts, respectively (Fig. 1C), but parasites still tended to grow more in endotherms when only considering definitive hosts (e.g., ∼6000-fold vs 200-fold growth in an average [730g] definitive host). Although parasites infected higher trophic level hosts as larger larvae (Fig. 3B), they did not achieve larger final sizes in top predators (Fig. 3D).
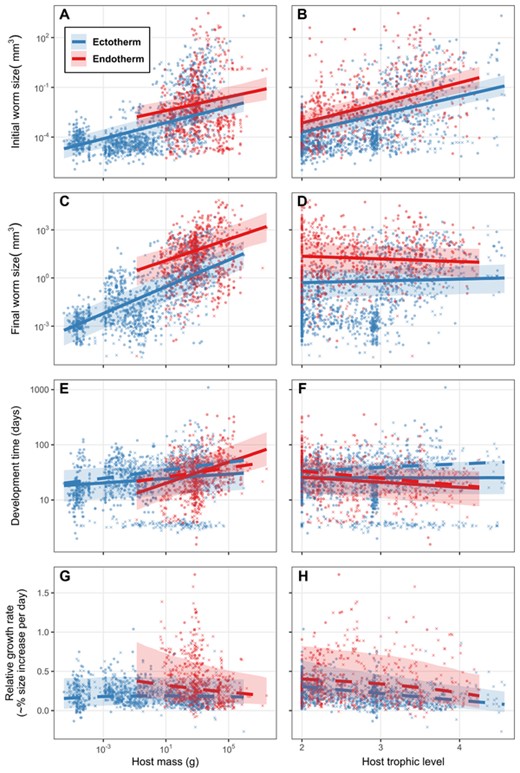
(A, B) Initial parasite size, (C, D) final size, (E, F) developmental time, and (G, H) relative growth rate as a function of three host traits: body mass, trophic level, and endothermy. Missing data were imputed; X's represent the average from 100 imputations of the y-axis variable. Circles are observed data. Lines are the relationships and credible intervals estimated from mixed models accounting for parasite taxonomy and missing data. Dashed lines are the model trends after excluding stages that develop less than one week.
Parasites spent more time developing in larger hosts, though this trend was only consistent among endo and ectotherms after excluding stages with developmental times less than a week (Fig. 3E). Developmental time was slightly shorter in high trophic level endotherms (Fig. 3F), presumably because parasites entered these hosts as larger larvae (Fig. 3B). Helminth growth rates did not increase with host mass or trophic level; if anything, they decreased (Fig. 3G, H). Growth rates were higher in endotherms but not significantly so (33% [CI = 15–73%] versus 19% [CI = 8–42%] per day for a 10 g host). This difference disappeared when growth rate was calculated in degree days (Fig. D3g, h), because parasites spend more “thermal time” in endotherms (∼56% more days at room temperature in a 10 g host; Fig. D3e). Notably, host traits had a clearer effect on parasite developmental time in degree days than in days, explaining 18% vs 5% of the variation (Table 2).
Parasite life stage explained an additional 2, 16, and 16% of the variation in final size, initial size, and developmental time beyond that accounted for by host traits (Table 2), suggesting some stages grew differently than expected, given host size, trophic level, and endothermy. We therefore compared stage means predicted by just host traits or just stages (Fig. 4). Helminths with one-host cycles entered their large and mostly endothermic hosts as relatively smaller larvae than predicted by host traits (Fig. 4A). Helminths with four-host cycles entered their second hosts relatively small, grew substantially, and then entered the definitive hosts as comparatively large larvae (Fig. 4A). The penultimate larval stages in long life cycles spent less time developing than expected (i.e., second and third intermediate hosts in 3-host and 4-host cycles, respectively, which are often paratenic hosts) (Fig. 4C). Growth rates were consistent with host expectations (Fig. 4D). Among stages, mean relative growth rates ranged from 11% per day [CI 3–25%] in the last host of four-host cycles up to 32% per day [CI 9–76%] in the first host of four-host cycles, but credible intervals were wide, making differences among stages unclear.
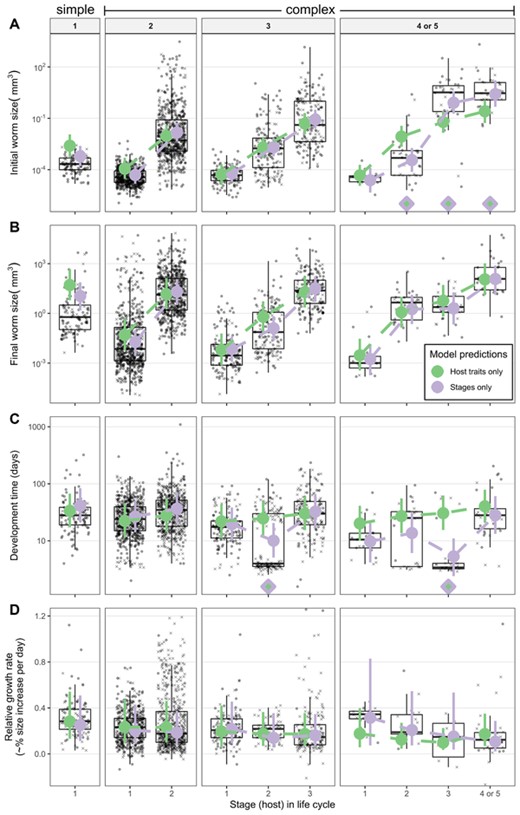
Parasite (A) initial size, (B) final size, (C) developmental time, and (D) relative growth rate by life stage. Parasites are paneled by life-cycle length. Missing values were imputed; X's represent the average from 100 imputations of the y-axis variable. Circles are observed data. Colored points are means and 95% credible intervals estimated with two mixed models, one used just host traits (mass, trophic level, and endothermy) and the other just parasite life stage. Filled diamonds indicate stages where the model means significantly differ.
PARASITE SIZE AND AGE AT MATURITY: LONGER DEVELOPMENT AND LARGER SIZE IN LONGER LIFE CYCLES
Age at sexual maturity (excluding waiting for transmission) increased 18% [CI = 7–30%] with each additional host in the life cycle (Fig. 5A). However, this trend was only clear for nematodes (Fig. E6), and it was weaker when expressed in degree days (Fig. D5a, 12% [CI = 1–24%]), because parasites with one-host cycles usually spend their entire parasitic lives in endotherms (i.e. more thermal time), while many species with complex life cycles only infect ectotherms (i.e., less thermal time). Adult helminth size increased with LCL (72% [CI = 31–123%] per additional host; Fig. 5B). Although not statistically significant, lifetime growth rate tended to slow with LCL (Fig. 5C; 23% [11-51%] vs. 17% [CI = 7–38%] per day in 1- vs. 4-host cycles). Longer LCLs were associated with larger, older adults (Fig. 5A, B) and growth rates declined with size and age (Fig. 5D). An asymptotic curve fit the overall relationship between size and age better than a line (the residual standard error was 35% lower for the curve). Medians for stages fell close to the overall curve (Fig. 5D), especially when growth was a function of thermal time (i.e., when time was in degree days, the squared error for stage medians was 32% lower; Fig. D5d). Thus, we conclude that LCL affects growth duration but not speed (see also Fig. 4D).
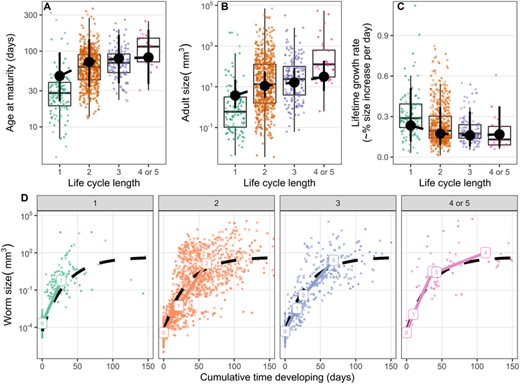
(A) Age at maturity (i.e., the cumulative development time across all hosts), (B) reproductive size, and (C) average lifetime growth rate for parasites with different life-cycle lengths. Point ranges are means and 95% credible intervals estimated from mixed models accounting for parasite taxonomy and the variability due to missing data. (d) Helminth size over time, paneled by life-cycle length. Median values for each parasite life stage are plotted. The dashed line represents an asymptotic curve fit to the full dataset. It was defined as size = A - (A - P) * exp(-B * age), where P is ln-transformed propagule size (-9.9), A is ln-transformed asymptotic size (3.8), and B is the rate constant (0.03). In all panels, X's represent the average of 100 imputations; circles represent observed data.
PARASITE TAXONOMY IMPACTS THE KINDS OF HOSTS EXPLOITED AND HOW PARASITES GROW
For both host traits (Table 1) and parasite growth (Table 2), taxonomic random effects were significant, indicating parasite taxa differ in the hosts they infect as well as how they grow, even after controlling for life stage, host mass, endothermy, and so on. Taxonomic differences were commonly among families, rather than genera or classes (Fig. E1, E2), and for parasite growth, they were larger within stages than across them (Fig. E2), suggesting that parasite taxa grow more (or less) than expected at certain life stages but not across their whole life cycle (Table E1 lists high- and low-growth stages).
Most, but not all, of our main findings were consistent across helminth groups (Table 3, supplement E). Trends in cestodes and nematodes were similar, although age at maturity increased with LCL only in nematodes (Fig. E6). Age and size at maturity did not increase with LCL in acanthocephalans (Fig. E6). Acanthocephalans with three-host cycles also infected relatively large first hosts (Fig. E3), grew substantially in them, and thus grew less in the subsequent, larger hosts (Fig. E4). Although these differences suggest acanthocephalan life cycles are somewhat unique, it is also harder to detect LCL correlations in acanthocephalans, because they are less diverse (97 species versus 378 cestode and 492 nematode species in our data) with less variation in LCL (just two- and three-host cycles, with nearly all three-host cycles including a paratenic second host).
Summary of main findings and their consistency across the three helminth groups
| Result | Acanthocephala | Cestoda | Nematoda |
|---|---|---|---|
| Host traits | |||
| Smaller first hosts in longer life cycles | No | Yes | Yes |
| Larger definitive hosts in longer life cycles | Yes | Yes | Yes |
| Higher trophic level hosts in longer life cycles (trophic vacuum) | Yes | Yes | Yes |
| Endotherms more common as definitive hosts | Yes | Yes | Yes |
| Larger host mass ratios in shorter cycles | Yes | Yes | Yes |
| Parasite growth, stages | |||
| Grow larger in big endotherms | Yes | Yes | Yes |
| Final size increases with host mass faster than initial size (more growth in bigger hosts) | No | Yes | Yes |
| More and faster growth in endotherms | Yes | Yes | Yes |
| Parasite life stage explains variation not explained by host traits | Yes | Yes | Yes |
| Parasite growth, lifetime | |||
| Growth slows with size/age | Yes | Yes | Yes |
| Size at maturity increases with life cycle length | No | Yes | Yes |
| Age at maturity increases with life cycle length | No | No | Yes |
| Growth rates do not vary with life cycle length | Yes | Yes | Yes |
Discussion
Life cycles with more successive hosts seem risky because of the extra transmission steps, but they also have benefits. Parasites with longer LCL infected smaller first hosts, which probably facilitates propagule transmission, and larger definitive hosts, which favors bigger reproductive sizes. This supports the presumed benefits of both proposed mechanisms of life-cycle extension: higher transmission through downward incorporation of low-level hosts and more growth through upward incorporation of high-level hosts.
Helminths with longer LCL did not enter food chains at lower trophic levels – first hosts were usually herbivores regardless of LCL – but they did begin in smaller hosts. The first hosts in three- and four-host life cycles were >100,000 times smaller than the first (and only) host in one-host cycles, and they are probably >100,000 times as abundant according to empirical scaling relationships (Cohen et al. 2003; Hatton et al. 2019). Smaller animals with higher abundance are more likely to encounter parasite propagules, and they are probably more likely to eat them too. Propagules were the size of normal food for the small first hosts in four-host cycles, whereas the large first hosts in one-host cycles probably only consume them by accident while grazing (Chubb et al. 2020). Starting a cycle in a smaller, more abundant host may increase propagule transmission but also necessitate several transmission steps before reaching a large host for reproduction.
The change in host trophic level from one life stage to the next was consistent across different LCLs. Consequently, parasites with longer LCL reached higher trophic level hosts, a trend previously shown in nematodes (Benesh et al. 2014) and here extended to cestodes and acanthocephalans. The lack of transmission across non-adjacent trophic levels in diverse helminths (i.e. a trophic vacuum) suggests this is a general constraint that favors adding and/or retaining intermediate hosts in life cycles. An exception to the increase in host trophic level with life-cycle progression was the relatively low mean trophic level of definitive hosts in four-host cycles. Several of these hosts are noted omnivores (e.g., humans, pigs, and racoons), which highlights how diverse host diets provide parasites various transmission routes (Chen et al. 2008; Thompson et al. 2013; Park 2019).
In long cycles, the next host was an average-sized predator of the current host (or propagule), whereas in short cycles, the next host was relatively large. In large hosts, selection is unlikely to favor delaying reproduction until an even larger host is reached, as there are fewer potential predators able to consume large hosts (Williams and Martinez 2000; Lafferty and Kuris 2002), and those next hosts may not be much bigger, given that host mass ratios decreased with life-cycle progression. By contrast, when parasites are transmitted to relatively small predators, suppressing reproduction until they are eaten by even larger predators may be worth the risk. Host-mass ratios in longer life cycles better matched common predator-prey mass ratios, but this need not maximize parasite transmission. For example, parasites may be more likely to encounter the smaller predators of their intermediate hosts if they are more abundant than larger predators. On the other hand, a large predator subsisting on small prey must eat more to satisfy its energy needs, a factor tending to increase transmission rates along links with large mass ratios. But even if having a relatively large predator as next host does not increase transmission, it has a separate benefit: growth.
Parasites grew more in larger hosts, particularly endotherms, but not in higher trophic level predators. Thus, host diet does not affect parasites’ size ceiling (see also Arneberg et al. 1998), but host mass and body temperature do. In various parasite taxa, body size correlates with host size (cestodes: Trouvé et al. 2003; Randhawa and Poulin 2009; Benesh et al. 2013, acanthocephalans: Poulin et al. 2003b, nematodes: Morand et al. 1996; Arneberg et al. 1998, ticks: Poulin 1998), although this is not universal (e.g., monogeneans, some lice; Poulin 1996; Johnson et al. 2005). Most studies have focused on adult stages (rarely larvae: Hechinger et al. 2009; Benesh et al. 2011), but we examined how host size affected parasite growth across the whole life cycle. Larger hosts provide parasites with more energy for growth (George-Nascimento et al. 2004; Poulin and George-Nascimento 2007; Hechinger 2013), but growth did not simply scale with energy availability. Helminth final size increased less with host mass (ln-ln regression slope was 0.43) than expected from host metabolism (slopes are typically between 0.75 and 1; Hatton et al. 2019). Thus, in larger hosts, helminths are larger overall, but smaller relative to host mass. Life history theory suggests that the size achieved should decrease when parasites have higher mortality rates and/or lower growth rates (Parker et al. 2009). Relative growth rates were surprisingly consistent with host mass, but parasite mortality in larger hosts might be increased by heightened competition (Arneberg 2002; George-Nascimento et al. 2004), lower establishment rates (Poulin 2010; Froelick et al. 2021), or better host immune responses (Brace et al. 2017). Even in similar hosts, some parasite taxa grew larger (or smaller) than others (e.g. families with extreme growth are in Table E1), and exploring whether these parasites have lower (or higher) mortality rates is worth future investigation. LCL per se did not affect parasite growth, because parasites with longer LCL grew on average to the size expected from hosts traits, even though they began some life stages as relatively larger (or smaller) larvae. This suggests that (i) the effect of LCL on final, adult parasite size is due to the increase in host size with LCL, and (ii) infecting hosts with different physiologies and immune systems does not clearly come at the cost of reduced growth (Benesh et al. 2021).
Helminth growth rates were ∼70% faster in endotherms than in ectotherms, although the confidence interval around this difference was wide. The difference disappeared when we expressed growth rates in degree days, suggesting that rapid growth in endotherms is due to elevated temperature. Warmer temperatures accelerate growth but need not favor larger body sizes (Arendt 2011), as warmer environments can be associated with both larger (Dallas et al. 2019) and smaller helminths (Poulin 1996; Randhawa and Poulin 2009). Adult acanthocephalans are larger in endotherms (Poulin et al. 2003b), as are nematodes and cestodes (this study), but adult trematodes are not (Poulin and Latham 2003). While this discrepancy is worth further investigation, endothermy seems mainly beneficial for parasite growth. Higher body temperatures accelerate growth while elevated metabolism provides the energy to support larger parasite sizes. When parasites can grow rapidly to a large size, there is little reason to suppress reproduction (Parker et al. 2003), which likely explains why endotherms overwhelmingly act as definitive hosts.
Parasites with longer LCL reproduced at larger sizes. But they did not clearly grow faster. If anything, they grew slower on average, because growth decelerated at larger sizes, which is typical as big animals re-allocate energy from growth to maintenance and reproduction (West et al. 2001). Rather, parasites with long LCL grew larger by maturing at slightly later ages, at least in nematodes. Total developmental time with long LCL was curbed by developing little in penultimate, often paratenic stages. Even with little-to-no growth in paratenic hosts, parasites with longer LCL still entered their definitive hosts as larger larvae, which likely increases establishment success (Rosen and Dick 1983; Steinauer and Nickol 2003; Benesh et al. 2012; Froelick et al. 2021). Thus, helminths with long LCL may mitigate the risk of multiple transmission steps by having larger larvae with higher establishment and the risk of prolonged development by forgoing growth in paratenic hosts.
In summary, helminths with longer LCL infected conspicuously smaller first hosts, slightly larger definitive hosts, and were transmitted along trophic links with smaller predator-prey mass ratios. They grew larger, but not faster, and had slightly later ages at maturity. These results support the proposed benefits of both downward and upward routes of complex life-cycle evolution: small hosts at the beginning of a life cycle facilitate transmission while big hosts at the end of a life cycle enable growth. Although the best hosts for transmission are usually not the best hosts for growth, this varies with habitat and host ecology. Many animals can consume helminth propagules (first host mass ranged over 10 orders of magnitude), but few are large enough (e.g. grazing terrestrial megafauna) to favor helminth reproduction, permitting one-host cycles. More commonly, the hosts ingesting propagules are small, and when first hosts are tiny and trophic chains long (e.g., pelagic marine habitats), the longest life cycles have evolved. Variation in LCL may thus reflect a set of adaptive optima, given the varying constraints of chance (i.e., encounters with potential first hosts), ecology (i.e., predators available as next hosts), and phylogeny (e.g., only nematodes have direct cycles). Nonetheless, cycles with more than three successive hosts are rare, perhaps due to the cumulative hazard of several transmission steps. Thus, complex life cycles in helminths, particularly two- and three-host cycles, may be pervasive because they combine small hosts for transmission with larger, often endothermic hosts for reproduction, without too many transmission steps in between.
AUTHOR CONTRIBUTIONS
D.P.B. collected the data, performed all analyses, and drafted the manuscript. All authors conceived the study and contributed to writing and editing the manuscript.
ACKNOWLEDGMENTS
D.P.B. was funded by the Deutsche Forschungsgemeinschaft (DFG, German Research Foundation) – project number BE 5336/3-1.
DATA ARCHIVING
Life-cycle data were published here: https://esajournals.onlinelibrary.wiley.com/doi/full/10.1002/ecy.1680. Stage-level data are archived in the Dryad Digital Repository: https://doi.org/10.5061/dryad.gtht76hmm. Code to reproduce our analyses can be found here: https://github.com/dbenesh82/benefits_of_life_cycle_complexity
CONFLICT OF INTEREST
The authors declare no conflict of interest.
LITERATURE CITED
Associate Editor: S. Foitzik
Handling Editor: T. Chapman
