


Abstract
Subclinical thyroid disorders have been associated with atherosclerosis and increased cardiovascular risk. As triglyceride-rich lipoprotein particles (TRLPs) have recently emerged as a casual factor for atherogenesis, the aim of this study was to evaluate the relationship between subclinical hypo- and hyperthyroidism and TRLP subfractions.
We selected 5066 participants from the ELSA-Brasil cohort with available data of thyroid function and lipid profile measured by nuclear magnetic resonance (NMR) spectroscopy. Individuals were divided into 3 groups by baseline thyroid function (subclinical hypothyroidism, euthyroidism, and subclinical hyperthyroidism). Triglyceride-rich lipoprotein particle subfractions were analyzed through NMR spectroscopy. To examine the association between TRLP subfractions and thyroid function, we conducted univariate and multivariate linear regression models adjusted for demographic characteristics, body mass index, diabetes, smoking status, and alcohol use.
Of 3304 individuals, 54% were women, with a mean age of 50.6 ± 8.7 years, 51% white, and 53% with at least a college education. Of these individuals, 92% were euthyroid, whereas 6.8% had subclinical hypothyroidism and 1.2% had subclinical hyperthyroidism. The univariate linear regression showed that very small TRLPs (P = 0.026) and very large TRLPs (P = 0.008) were statistically increased in subclinical hypothyroidism when compared with euthyroidism. In subclinical hyperthyroidism, there was a reduction in total TRLPs (P = 0.003), seemingly driven by reduced very small TRLPs (P = 0.067).
The findings were confirmed when adjusted for demographic characteristics, as well as comorbidities. This study suggests that subclinical hypothyroidism is associated with very small and very large TRLPs, which are related to an unfavorable atherogenic profile. Subclinical hyperthyroidism is associated to lower very small TRLPs.
Subclinical thyroid disorders are associated with atherosclerosis and increased cardiovascular risk (1). Subclinical hypothyroidism is associated with higher levels of total cholesterol and low-density lipoprotein cholesterol (LDL-c) (2–4), as well as high levels of triglycerides (5, 6) and low levels of high-density lipoprotein cholesterol (HDL-c) (7–10). Epidemiological studies also suggest that overt and subclinical hypothyroidism may increase cardiovascular risk by inducing higher LDL-c levels (11–14). Fewer studies have evaluated the impact of subclinical hyperthyroidism on serum lipids and lipoprotein profiles, as the prevalence of this disorder is much lower, though some studies suggest it is associated with beneficial changes, including lower levels of LDL-c and triglycerides and higher levels of HDL-c (15–17).
The mechanistic basis by which changes in LDL-c increases the risk for atherogenesis in thyroid dysfunction are still under debate, though elevations in small and dense LDL-c are regarded as a principal culprit in the setting of hypothyroidism (9, 10, 18–20). Triglycerides and triglyceride-rich lipoproteins (TRLPs) are emerging as crucial contributors to atherogenesis (21–25), though there is no consistent data about the influence of thyroid function on TRLP levels.
A recent study has observed higher levels of large VLDL-c in hypothyroidism using nuclear magnetic resonance (NMR) spectroscopy (5). However, to date, no studies have analyzed the association between all TRLP subfractions (comprised of very low-density lipoprotein [VLDL], VLDL remnants, and intermediate-density lipoprotein [IDL]) and thyroid function. Therefore, the aim of this study was to evaluate triglyceride-rich lipoproteins subfractions by NMR spectroscopy in subclinical hypo- and hyperthyroidism.
Methods
ELSA-Brasil study
The Brazilian Longitudinal Study of Adult Health (ELSA-Brasil) is a prospective cohort study following 15 105 civil servants from 6 cities in Brazil (Salvador, Belo Horizonte, Vitória, Rio de Janeiro, São Paulo, and Porto Alegre), as has been previously described (26–28). The main objective of the study is to investigate the incidence of cardiovascular diseases and diabetes, as well as their associated risk factors (27, 29). All participants in this study provided written informed consent and each enrolling site obtained approval from the Institutional Review Boards (CAAE 0016.1.198.000-06) according to the Declaration of Helsinki. We selected 5066 participants from the Investigation Center of São Paulo with available data of thyroid function and lipid profile measured by NMR spectroscopy. Participants with overt thyroid disease, using statins or medications that could interfere with thyroid function, and those with previous severe cardiovascular event were excluded from the analysis as described in Fig. 1.
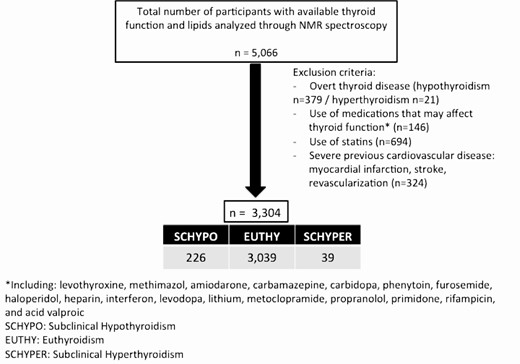
Participant enrollment.
Thyroid function definition
Thyroid-stimulating hormone (TSH) and free thyroxine (FT4) were measured using a third‐generation immunoenzymatic assay (Siemens, Deerfield, Illinois) in serum obtained from centrifuged venous blood samples after overnight fasting. Free thyroxine levels were measured in participants exhibiting altered TSH levels. In this study, reference range levels were 0.55 to 4.78 mcUI/mL for TSH and 0.89 to 1.76 ng/dL for FT4, similar to other ELSA‐Brasil studies (30–32). The intra-assay and interassay coefficients of variation were 3.32% and 9.65% for TSH and 1.40% and 6.40% for FT4, respectively. Biochemical data about the performed tests can be seen in Table 1 of the supplemental material (33).
Participants’ demographic and clinical data analyzed by thyroid function
| Subclinical Hypothyroidism | Euthyroidism | Subclinical Hyperthyroidism | P-value | |
|---|---|---|---|---|
| Participants, n (%) | 226 (6.8) | 3039 (92) | 39 (1.2) | |
| Women (%) | 57.1 | 51.4 | 64.1 | <0.001 |
| Age (years) | 52.7 ± 9.1 | 50.2 ± 8.6 | 52.9 ± 9.3 | <0.001 |
| Race (%) | <0.001 | |||
| White | 60.0 | 50.8 | 39.2 | |
| Brown | 26.3 | 29.1 | 29.0 | |
| Black | 9.7 | 16.6 | 27.3 | |
| Other | 4.0 | 3.5 | 4.5 | |
| Educational level | <0.001 | |||
| Less than high school | 14.4 | 12 | 15 | |
| High School | 33.5 | 34.7 | 36.1 | |
| College or higher | 52.1 | 53.3 | 48.9 | |
| Diabetes (%) | 18.1 | 16.7 | 23.1 | 0.819 |
| Hypertension (%) | 29.2 | 25.5 | 33.3 | 0.262 |
| Alcohol use (%) | 0.401 | |||
| Never | 13.7 | 11.85 | 15.4 | |
| Former | 18.6 | 19.3 | 33.3 | |
| Current | 67.7 | 68.9 | 51.3 | |
| Smoking (%) | <0.001 | |||
| Never | 57 | 58 | 48.9 | |
| Former | 34.5 | 28.4 | 31.7 | |
| Current | 8.5 | 13.6 | 19.4 | |
| BMI (kg/m2) | 27.6 ± 5.5 | 27.0 ± 4.8 | 26.9 ± 5.0 | 0.082 |
| Waist circumference (cm) | 89.6 ± 12.9 | 89.3 ± 12.4 | 88.4 ± 12.5 | 0.940 |
| SBP (mmHg) | 121.6 ± 17.9 | 119.0 ± 16.1 | 119.5 ± 17.8 | 0.032 |
| DBP (mmHg) | 75.6 ± 11.2 | 75.0 ± 10.8 | 72.9 ± 8.9 | 0.053 |
| Total cholesterol (mg/dL) | 219.6 ± 40.8 | 215.1 ± 41.8 | 208.3 ± 36.6 | 0.086 |
| HDL-c (mg/dL) | 57.5 ± 14.6 | 56.3 ± 14.7 | 56.7 ± 11.1 | 0.016 |
| LDL-c (mg/dL) | 133.7 ± 33.2 | 132.5 ± 34 | 129.6 ± 30 | 0.363 |
| Triglycerides (mg/dL) | 146.1 ± 100.4 | 133.3 ± 94.8 | 110.1 ± 58.8 | 0.035 |
| Fasting Plasma glucose (mg/dL) | 112.8 ± 36.2 | 109.6 ± 27.2 | 114.9 ± 30.5 | 0.085 |
| HbA1c (%) | 5.4 ± 1.1 | 5.4 ± 0.9 | 5.7 ± 0.9 | 0.120 |
| TSH (mUI/L) | 5.91 ± 2.90 | 1.72 ± 0.83 | 0.23 ± 0.13 | 0.005 |
| FT4 (ng/dL)a | 1.09 ± 0.17 | 1.11 ± 0.17 | 1.32 ± 0.27 | <0.001 |
| Total TRLP (nmol/L) | 158.41 ± 75.85 | 149.17 ± 74.03 | 120.49 ± 71.80 | 0.005 |
| Very small TRLP (nmol/L) | 87.18 ± 69.28 | 77.76 ± 62.29 | 56.43 ± 62.65 | 0.009 |
| Small TRLP (nmol/L) | 44.73 ± 33.11 | 46.56 ± 36.52 | 45.94 ± 30.20 | 0.868 |
| Medium TRLP (nmol/L) | 21.65 ± 19.03 | 20.59 ± 17.64 | 14.94 ± 14.05 | 0.244 |
| Large TRLP (nmol/L) | 4.57 ± 6.68 | 4.02 ± 6.09 | 2.97 ± 4.08 | 0.118 |
| Very Large TRLP (nmol/L) | 0.29 ± 0.94 | 0.24 ± 1,25 | 0.18 ± 0.29 | 0.055 |
| TRLP mean size (nm) | 47.20 ± 9.87 | 46.33 ± 9.10 | 46.30 ± 10.08 | 0.440 |
Abbreviations: BMI, body mass index; DBP, diastolic blood pressure; FT4, free thyroxine; SBP, systolic blood pressure; TRLP, triglyceride-rich lipoprotein; TSH, thyroid-stimulating hormone; HbA1c, Glycated hemoglobin; LDL-c, low-density lipoprotein cholesterol; HDL-c, high-density lipoprotein cholesterol.
aFT4 (Free Thyroxine) was measured only when TSH levels were out of the reference range.
ELSA‐Brasil participants were classified into 5 categories of thyroid function according to TSH and FT4 levels and information related to the use of medication to treat thyroid disorders: overt hypothyroidism (high TSH and low FT4 levels or use of levothyroxine to treat hypothyroidism), subclinical hypothyroidism (high TSH levels, normal FT4 levels, and no use of drugs to treat thyroid diseases), euthyroidism (normal TSH and no use of thyroid drugs), subclinical hyperthyroidism (low serum TSH, normal FT4 levels, and no use of drugs to treat thyroid diseases), and overt hyperthyroidism (low serum TSH and high FT4 levels or use of medication to treat hyperthyroidism). Accordingly, the definition of subclinical thyroid disease included only participants who did not use any drugs to treat thyroid disorders. Participants with overt thyroid disorders were excluded from the analyses.
Lipoprotein measurements
Blood was collected from participants after 8 to12 hours nocturnal fasting. The samples were centrifuged at the sites and stored in tubes at -80°C. Conventional lipid concentrations (total cholesterol, HDL-c, and triglycerides) were determined by a nonprecipitated colorimetric method using ADVIA 1200 Siemens equipment. Low-density lipoprotein cholesterol was calculated using the Friedewald equation (34), except for cases with elevated triglyceride levels (more than 400 mg/dL), when an enzymatic colorimetric assay was used (ADVIA 1200, Siemens, Munich, Germany). Detailed data about the performed tests can be found at Table S1 of the supplemental material (33).
Triglyceride-rich lipoprotein subfractions were measured by new NMR spectroscopy (NMR LipoProfile 4 Test Spectra; LabCorp, Raleigh, North Carolina). This technique quantifies the size as well as the concentration (number) of lipoprotein particles expressed as an average particle size (in nanometers) or as lipoprotein particle concentration (in particle nmol/L). Nuclear magnetic resonance spectroscopy can quantify the concentration of lipoprotein subclass particles because of 2 phenomena: lipoprotein subclasses of different sizes in plasma simultaneously emit distinctive NMR signals whose individual amplitudes can be accurately and reproducibly measured; and also the measured subclass signal amplitudes are directly proportional to the number of subclass particles emitting the signal, irrespective of variation in particle lipid composition (36). Thus, this method relies on the spectroscopic distinctness of particles’ size, and not protein composition or metabolic origin (37). Total TRLPs comprise particles measuring 24 to 240 nm in diameter. The mean particle size for TRLPs (TRLZ) rests between 30 and 100 nm. Intermediate-density lipoprotein cholesterol is now named very small TRLP (VS-TRLP), comprising particles with an estimated diameter from 24 to 29 nm. Similarly, other NMR fractions are defined as small TRLP (S-TRLP), from 30 to 36 nm; medium TRLP (M-TRLP), from 37 to 49 nm large TRLP (L-TRLP), from 50 to 89 nm; and very large TRLP (VL-TRLP), from 90 to 240 nm within the TRLP particles (38).
Other variables
Age is presented as a continuous variable. Sex is described as a percentage female. Race was self-reported and categorized as white, brown, black, and other (including Asian and Indigenous). Educational level was stratified as less than high school, high school, and college or higher. Anthropometric measures were obtained with standard techniques with the participant wearing light clothes. Body mass index (BMI) was calculated as weight divided by height squared (kg/m2). Hypertension was defined as the use of antihypertensive drugs, systolic blood pressure ≥ 140 mm Hg, or diastolic blood pressure ≥ 90 mm Hg. The diagnosis of diabetes was based on a previous medical diagnosis of diabetes self-reported by the participant, or the use of oral antidiabetic agents or insulin therapy, fasting plasma glucose ≥ 126 mg/dL, 2-hour postprandial 75 g glucose test ≥ 200 mg/dL, or glycosylated hemoglobin ≥ 6.5% (exams which were evaluated in all participants) (39). Smoking status was defined as never, former (withdraw for more than 2 years), or current. Participants are considered smokers if they smoked more than 100 cigarettes (or 5 packs) in their life before entering the study or if they answered yes to the question “Do you currently smoke cigarettes?” independently of the number of cigarettes smoked. Alcohol use was defined as never, former, or current. Former alcohol users were those who stopped using alcohol for more than 2 years. We classified participants in the excessive drinking category if their intake was more than 210 g per week for men and more than 140 g per week for women according to World Health Organization (WHO) criteria (40).
Statistical analysis
Continuous variables were presented as descriptive statistics, with mean and standard deviation for normal distribution and, for non-normal distributions, with median (quartiles). The data distribution’s normality was verified through the Kolmorogov-Smirnov test. We showed categorical variables in absolute and relative frequency. Thyroid-stimulating hormone, triglycerides, and TRLP subfractions were log-transformed for use in regression models. Comparison of quantitative variables across groups was performed using analysis of variance for variables with normal distribution and the Kruskal-Wallis test and Spearman correlation for those with non-normal distributions. Categorical variables were analyzed by chi-square test and Fisher’s exact test. To examine the association between TRLP subfractions and thyroid function, we conducted univariate and multivariate linear regression models. For these analyses, we standardized total TRLP, VS-TRLP, S-TRLP, M-TRLP, L-TRLP, VL-TRLP, and mean size of TRLP (TRLPZ). Three multiple linear regression models were adjusted as follows: crude model = univariate; Model 1 = race, gender, and educational level; Model 2 = model 2 + BMI, diabetes, hypertension, smoking status, and alcohol use. Statistical significance was defined as P < 0.05. Analyses were performed with Stata version 13.1 (StataCorp LLC, College Station, Texas).
Results
We evaluated 3304 individuals, 54% were women, with a mean age of 50.6 ± 8.7 years; 51% were white and 53% had at least a college education. Of these individuals, 3039 (92%) were euthyroid, 226 (6.8%) had subclinical hypothyroidism, and 39 (1.2%) had subclinical hyperthyroidism. Total cholesterol and LDL-c did not vary between the groups (P = 0.086 and P = 0.363 for linear trend, respectively). High-density lipoprotein cholesterol levels were higher in subclinical hypothyroidism (P = 0.016) as were triglycerides levels (P = 0.035). The demographic and clinical profiles of the groups are shown in Table 1.
The univariate linear regression (Table 2) showed that VS-TRLP (P = 0.026) and VL-TRLP (P = 0.008) are statistically increased in subclinical hypothyroidism when compared with euthyroidism. In subclinical hyperthyroidism, there is a reduction of all TRLP (P = 0.003), probably due to a nonstatistically significant trend to reduced VS-TRLP (P = 0.067).
Triglyceride-rich lipoprotein subfractions variation in subclinical hyper- and hypothyroidism compared with euthyroidism according to thyroid function
| Euthyroidism | Subclinical Hyperthyroidism Beta 95% CI | Subclinical Hypothyroidism Beta 95% CI | |
|---|---|---|---|
| Crude Model | |||
| Very small TRLP (nmol/L) | Reference | -0.28 (-0.59–0.02) P = 0.067 | 0.14 (0.02–0.27) P = 0.026 |
| Small TRLP (nmol/L) | Reference | -0.02 (-0.31–0.26) P = 0.878 | -0.02 (-0.15–0.11) P = 0.732 |
| Medium TRLP (nmol/L) | Reference | -0.21 (-0.51–0.08) P = 0.147 | 0.03 (-0.10–0.16) P = 0.653 |
| Large TRLP (nmol/L) | Reference | -0.36 (-0.87–0.15) P = 0.165 | 0.16 (-0.06–0.38) P = 0.164 |
| Very large TRLP (nmol/L) | Reference | 0.16 (-0.18–0.50) P = 0.348 | 0.21 (0.05–0.37) P = 0.008 |
| Total TRLP (nmol/L) | Reference | -0.23 (-0.40 to -0.08) P = 0.003 | 0.05 (-0.02–0.12) P = 0.130 |
| Model 1 | |||
| Very small TRLP (nmol/L) | Reference | -0.35 (-0.66 to -0.04) P = 0.026 | 0.16 (0.03–0.28) P = 0.016 |
| Small TRLP (nmol/L) | Reference | 0.02 (-0.27–0.31) P = 0.891 | -0.01 (-0.13–0.12) P = 0.922 |
| Medium TRLP (nmol/L) | Reference | -0.18 (-0.47–0.18) P = 0.240 | 0.05 (-0.08–0.17) P = 0.465 |
| Large TRLP (nmol/L) | Reference | -0.35 (-0.87–0.17) P = 0.191 | 0.16 (-0.06–0.38) P = 0.162 |
| Very large TRLP (nmol/L) | Reference | 0.23 (-0.11–0.57) P = 0.182 | 0.21 (90.05–0.36) P = 0.009 |
| Total TRLP (nmol/L) | Reference | -0.24 (-0.40 to -0.08) P = 0.003 | 0.06 (-0.00–0.13) P = 0.062 |
| Model 2 | |||
| Very small TRLP (nmol/L) | Reference | -0.35 (-0.66 to -0.05) P = 0.024 | 0.14 (0.01–0.27) P = 0.030 |
| Small TRLP (nmol/L) | Reference | 0.01 (-0.28–0.30) P = 0.936 | -0.004 (-0.13–0.13) P = 0.953 |
| Medium TRLP (nmol/L) | Reference | -0.21 (-0.50–0.08) P = 0.162 | 0.05 (-0.07–0.17) P = 0.411 |
| Large TRLP (nmol/L) | Reference | -0.34 (-0.83–0.15) P = 0.174 | 0.13 (-0.08–0.34) P = 0.211 |
| Very large TRLP (nmol/L) | Reference | 0.19 (-0.14–0.51) P = 0.255 | 0.20 (0.06–0.35) P = 0.007 |
| Total TRLP (nmol/L) | Reference | -0.25 (-0.41 to -0.09) P = 0.002 | 0.06 (-0.00–0.13) P = 0.059 |
Abbreviation: TRLP: triglyceride-rich lipoprotein.
Model 1: linear regression adjusted by race, gender and educational level; Model 2: linear regression adjusted by race, gender, educational level, BMI, diabetes, hypertension, smoking status, and alcohol use.
When adjusted for demographic characteristics (gender, age, race, and educational level), the differences remain statistically significant in individuals with subclinical hypothyroidism, with a nonsignificant increase in total TRLP (P = 0.062). Reductions in total TRLP and VS-TRLP are statistically significant in the group with subclinical hyperthyroidism (Table 2).
Even after more comprehensive adjustment for BMI, presence of diabetes, hypertension, smoking, and current alcohol use, VS-TRLP and VL-TRLP remain significantly higher in subclinical hypothyroidism compared to euthyroidism, with a tendency to higher total TRLP, and VS-TRLP and total TRLP are reduced in subclinical hyperthyroidism (Table 2).
The differences in VS-TRLP and VL-TRLP across the thyroid function spectrum are shown in Figs. 2 and 3, respectively.
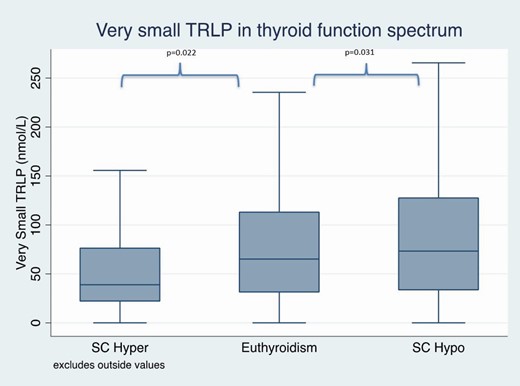
Very small triglyceride-rich lipoproteins in subclinical thyroid function spectrum after adjustments for demographic data, comorbidities, and lifestyle factors.
Abbreviations: SC hyper, cubclinical hyperthyroidism; SC hypo, subclinical hypothyroidism.
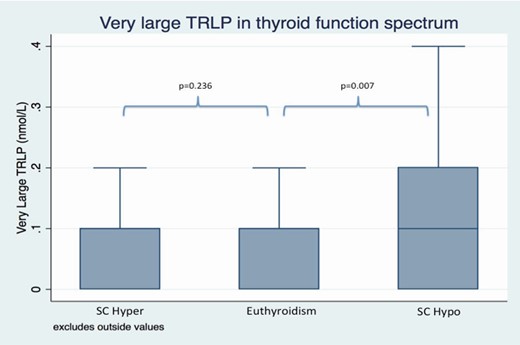
Very large triglyceride-rich lipoproteins in subclinical thyroid function spectrum after adjustments for demographic data, comorbidities, and lifestyle factors.
Abbreviations: SC hyper, cubclinical hyperthyroidism; SC hypo, subclinical hypothyroidism.
Of the individuals with hypertension, 66% were using antihypertensive medications. Of those with diabetes, 29.8% were using antidiabetic medications. As these medications may interfere in lipid levels, they were further excluded from Model 2 analysis, and the significance of total and very small TRLP remains the same in subclinical hyperthyroid patients. In subclinical hypothyroid patients, very small TRLPs keep a similar coefficient (0.09 [-0.03 to 0.24]), although the significance is lost (P = 0.223). These data are expressed in Table S2 from Supplemental Material (33).
In all 3 models, the mean particle size did not vary significantly from subclinical hypo- to subclinical hyperthyroidism.
We have also made a Spearman correlation between normal levels of TSH/FT4 and TRLP, and there wasn’t significant correlation between these variables (rho = -0.0235 and P = 0.1626). When we analyzed the individuals with hypothyroidism (high TSH and low FT4) and TRLP, we saw an expected correlation (rho = 0.0421 and P = 0.0122).
Discussion
In the present study, we have demonstrated that subclinical hypothyroidism is positively associated with very small and very large TRLP, while subclinical hyperthyroidism is negatively associated with very small TRLP.
Since the 1930s, an association between hypothyroidism and hypercholesterolemia has been investigated (41). Traditionally, LDL-c has been associated with atherosclerosis in hypothyroidism considering the role of thyroid hormones on lipid synthesis (2, 41–44). Recently, triglycerides and TRLP have been identified as risk factors for atherosclerosis, heightened vascular inflammatory tone, and endothelial dysfunction (21, 23–25). Considering TRLP, Fabbrini et al have demonstrated that the hepatic secretion of VLDL-triglycerides (VLDL-TG), measured by an enzymatic spectrophotometric kit, increases progressively from subclinical hyperthyroidism to subclinical hypothyroidism in women (15). A more recent study by Harada et al has measured VLDL particles also by NMR spectroscopy and has divided VLDL into small, medium, and large particles. It showed that subclinical hypothyroidism in women is associated with an increasing number of VLDL particles, and the size of these particles increases when comparing euthyroidism with overt hypothyroidism (12). Our study confirms these findings of very large subfractions of TRLP (which comprises VLDL) are augmented in subclinical hypothyroidism in comparison with euthyroidism and subclinical hyperthyroidism.
Still in the setting of elevated large VLDL particles, the phenotype of atherogenic dyslipidemia comprises activation of cholesterol ester transfer protein and catalyzation of the exchange of triglycerides out of VLDL for cholesterol ester from LDL and HDL particles. The enrichment of LDL and HDL particles with triglycerides renders them better substrates for lipolysis by hepatic lipase, which in turn leads to HDL catabolism and the production of a large number of small, dense LDL particles. These events occur in the setting of elevated large VLDL particles (45–47). As thyroid hormones are involved in the regulation of cholesterol ester transfer protein and lipoprotein lipases, previous studies have suggested that increased levels of large VLDL particles in thyroid dysfunction probably play a pathogenic role in atherogenesis (2, 5, 45). Our study agrees with these prior findings, as we found that very large TRLP are in fact correlated with lower thyroid function (subclinical hypothyroidism).
However, we also show that very small TRLP subfractions are increased in the subclinical hypothyroidism group and it seems that it was a continuum from subclinical hyperthyroidism to euthyroidism and subclinical hypothyroidism, following a pattern detected for other lipid particles. The inverse association between very small TRLP and thyroid function suggests that this lipid profile may play a role in increased cardiovascular risk linked to subclinical hypothyroidism. In fact, very small TRLP are most certainly associated with atherosclerosis because they encompass small VLDL and IDL, both of which correlate with cardiovascular events. Together they comprise the total “remnants fraction” (48). It has been demonstrated by Stender et al that the smaller the lipoprotein diameter, the larger is the influx into the aortic intima (49). Additionally, in vivo IDL and small VLDL particles have been shown to enter the arterial wall of humans (50).
This study must be read within the context of its design. First, as a cross-sectional analysis, we cannot establish causality, but only uncover associations between the findings. Also, the statistical difference between TRLP particles in different thyroid status found in this study may not be clinically relevant and only longitudinal studies in the future will be able to address this limitation. Although ELSA-Brasil includes a sample with higher education and net family income compared with the general Brazilian population, the social and ethnic diversity of the cohort is similar to the heterogeneous populations of mostly low/middle income levels living in large cities in Brazil. This suggests that our external validity may extend to urban centers of similar characteristics both within and outside of Brazil. More than that, there are several similarities in the prevalence of behavioral risk factors and chronic conditions selected for having been assessed with similar procedures in ELSA-Brasil and in VIGITEL, an annually performed telephone-based behavioral risk factor survey producing representative data for adults living in Brazil’s 27 state capitals and the Federal District (51).
In conclusion, this study demonstrates that subclinical hypothyroidism is associated with increased very small and very large triglyceride-rich lipoproteins, which are related to an unfavorable atherogenic profile and may contribute to the increased risk of cardiovascular disease in subclinical hypothyroidism. Subclinical hyperthyroidism is associated with lower very small TRLPs, indicating a more favorable atherogenic profile.
Acknowledgments
Financial Support: The ELSA-Brasil baseline study was supported by the Brazilian Ministry of Health (Science and Technology Department) and the Brazilian Ministry of Science and Technology (Financiadora de Estudos e Projetos and CNPq National Research Council) (grants 01 06 0010.00 RS, 01 06 0212.00 BA, 01 06 0300.00 ES, 01 06 0278.00 MG, 01 06 0115.00 SP, 01 06 0071.00 RJ).
Author Contributions: C.C.P.S.J., M.S.B., and I.M.B. wrote the manuscript and performed the statistical analysis. A.C.G., R.D.S., P.P.T., M.J.B., S.J., and P.A.L. reviewed the manuscript.
Additional Information
Disclosure Summary: C.C.P.S.J., A.C.G., M.J.B., S.J., P.P.T., P.A.L., and IMB: none. M.S.B. reports honoraria for consultancy in advisory boards from Sanofi. R.D.S. reports honoraria for consultancy, lectures, and/or participation in advisory boards from Amgen, AstraZeneca, Merck, Alcea, Sanofi/Regeneron, Biolab, Esperion, Kowa, and Novo-Nordisk.
Data Availability
All data are available upon request. The supplemental material is available at Dryad repository (https://doi.org/10.5061/dryad.gqnk98skp).
