


Abstract
Exposure to a ram during spring stimulates luteinizing hormone (LH) secretion and can induce ovulation in sexually quiescent ewes (“ram effect”). Kisspeptin (Kiss) present in the arcuate nucleus (ARC) and the preoptic area (POA) is a potent stimulators of LH secretion. Our aim was to investigate whether Kiss neurons mediate the increase in LH secretion during the ram effect. With double immunofluorescent detection, we identified Kiss neurons (Kiss IR) activated (Fos IR) by exposure to a ram for 2 hours (M2) or 12 hours (M12) or to ewes for 2 hours (C). The density of cells Kiss + Fos IR and the proportion of Kiss IR cells that were also Fos IR cells were higher in M2 and M12 than in C in ARC (P < 0.002) and POA (P < 0.02). In ARC, these parameters were also higher in M12 than in M2 (P < 0.02 and P < 0.05). Kiss antagonist (P234 10−6M) administered by retrodialysis in POA for 3 hours at the time of introduction of the ram reduced the amplitude of the male-induced increase in LH concentration compared with solvent (P < 0.02). In ARC, P234 had a more limited effect (P < 0.038 1 hour after P234) but pulse frequency increased less than after solvent (P = 0.07). In contrast, Kiss antagonist (P271 10−4M) infused in ARC but not POA 6 to 18 hours after introduction of the ram prevented the LH surge in the ewe (0/6 vs 4/5 and 4/6 in C). These results suggest that both populations of Kiss neurons are involved in the ram-induced pulsatile LH secretion and in the LH surge.
Reproduction in mammals is controlled by the interplay of the hypothalamus (H), the pituitary (P) and the gonads (G), often called the HPG axis. Each of these secretes hormones: The hypothalamus secretes gonadotropin-releasing hormone (GnRH), the pituitary releases luteinizing hormone (LH) and follicle-stimulating hormone, and the gonads secrete steroid hormones and peptides for that control the activity of the HPG axis and the secretions of these organs.
In the last 15 years, kisspeptin (Kiss) has been shown to be a powerful secretagogue for GnRH and to play a major role in mediating multiple inputs, including steroid feedback action on GnRH secretion [see review from Pinilla et al. (1)]. In all species studied, Kiss neurons have been identified in two main areas of the brain: the preoptic area (POA) and the arcuate nucleus (ARC) (2). In the ARC, Kiss colocalizes with neurokinin B and dynorphin A in cells called KNDy neurons (3). In all species, these KNDy neurons mediate the negative feedback action of steroids and are considered to be important for the regulation of pulsatile secretion of LH, whereas Kiss neurons in the POA are involved in the preovulatory surge of LH (4–6). However, in sheep the situation seems more complex, and some KNDy neurons have also been implicated in the onset of the LH surge (7).
Reproduction is also under the influence of a variety of environmental factors, such as photoperiod and sociosexual interactions. Sheep, like several other ungulates, are seasonal breeders that ovulate spontaneously in autumn. In spring, exposing sexually quiescent females to a sexually active male induces an immediate increase in pulsatile secretion of LH that eventually leads to a preovulatory surge of LH and ovulation (8), a phenomenon called the “ram effect.” The pathways through which sociosexual interactions modulate secretion of GnRH are starting to be understood (9). Studies using the protein Fos as a marker of neuronal activation showed that in adult, sexually experienced ewes, the stimulation of LH secretion by exposure to a ram or its odor is accompanied by an increase in the proportion of GnRH neurons activated in POA, as well as an activation of other hypothalamic structures (such as the ventromedial nucleus), the main and accessory olfactory systems, several limbic and cortical structures, and noradrenergic neurons (10, 11). More recently, several studies suggested that Kiss neurons could be involved in the transmission of the stimulatory effect of the sexual partner. In mice, exposure to urine of intact males activated 38.4% of Kiss neurons in the rostral periventricular nucleus of the third ventricle, whereas female urine had no effect (12). In ovariectomized goats, Murata et al. (13) showed that buck odor increased multiunit activity along with the stimulation of pulsatile secretion of LH; this increase in multiunit activity occurred in the area where KNDy neurons are located (14). In a preliminary study we showed that both populations of Kiss neurons were activated in anoestrus ewes exposed to sexually active males (15). However, in another study by De Bond et al. (16), activation was observed only in the KNDy neurons; the reason for the difference in results is not clear. De Bond et al. (16) also showed that a Kiss antagonist administered in the lateral ventricle of the brain prevented the male-induced stimulation of LH release. So, although the implication of Kiss in male-induced modulation of LH secretion seems very likely, the precise mechanisms and neuroanatomic pathways via which sociosexual interactions modulate GnRH and LH secretion are still unclear.
Our aim in these experiments was to understand the roles of the two populations of Kiss neurons during the ram effect. In the first experiment, we wanted to confirm our results showing that both populations of Kiss neurons were activated during the ram effect by using a double immunofluorescent detection of Kiss (Kiss IR) and Fos (Fos IR). In the second experiment, we used Kiss antagonists administered locally in the ARC or the POA by retrodialysis to modulate the male-induced pulsatile LH secretion or the male-induced LH surge.
Materials and Methods
Common to the two studies
Experiments were carried out in accordance with French and European regulations on care and welfare of animals in research and with authorization of the French Ministry of Agriculture and with local ethical approval (authorization no. 006259) and the approval of the local ethics committee (permit no. 2012-01-2, comité d'éthique en expérimentation animale Val de Loire, no. 19).
Experiments were performed during anoestrus (experiment 1, immunohistochemical study: April; experiment 2, pharmacological study: April to July) at the Centre INRA Val de Loire in Nouzilly, France, under natural photoperiod. We used adult Ile de France ewes, age 3 to 8 years, that had been isolated from all contact with males for at least 2 months. They were housed indoors and were fed daily with a constant diet of straw and lucerne pellets and had free access to water. They were always handled by staff that had no contact with the rams or their odors. Anestrus was confirmed by the persistent presence of progesterone concentrations <0.7 ng/mL on plasma collected weekly. If plasma progesterone concentration was >0.7 ng/mL or trace of ovulation was detected on the day of the experiment, the ewe was excluded from the protocol.
Ten sexually experienced adult, Ile de France rams selected for their high level of sexual activity provided the male stimulus. They were housed in a closed building situated 800 meters from the building where the females were housed and brought to the females only on the days of the experiments. Rams were introduced with a ratio of one ram per pen with one or two ewes and were rotated between pens every 30 to 60 minutes depending on the level of their sexual activity to make sure that all the ewes were highly stimulated. Adult Ile de France ewes unfamiliar to the experimental ewes were used as stimuli in the immunohistochemical study.
Progesterone assay
The concentrations of progesterone were measured using an enzyme-linked immunosorbent assay (17). The sensitivity of the assay was 0.2 ng/mL and the intra-assay and interassay coefficients of variation were 6.8% and 8.1% for a reference standard at 1.5 ng/mL and 6.6% and 10.3% for a reference standard at 2.5 ng/mL. Ewes were considered to have ovulated when progesterone concentration rose to >0.7 ng/mL.
LH assays
The concentrations of LH in jugular venous plasma were determined by using a radioimmunoassay (18). The assay sensitivity was 0.16 ng/mL standard 1051-CY-LH (equivalent to 0.31 ng/mL National Institutes of Health LH-S1). The intraassay and interassay coefficients of variation were 4.4% and 10.3%, respectively, for a reference standard at 0.3 ng/mL.
LH pulses were identified as a rapid increase in concentration exceeding three times the standard deviation of the reference of the assay (18). The onset of the LH surge was defined as the time at which concentration of LH rose >3 standard deviations above the baseline before introduction of the male and preceding an increase of LH concentration of at least 4 hours with at least one value >10 ng/mL (19).
Immunohistochemical study
Experimental protocol
Two weeks preceding the day of the experiment, 30 anestrus ewes were moved to the experimental building and were habituated to handling. The day before the experiment, the jugular vein was catheterized. The ewes were then divided into three groups and exposed the next day to unfamiliar ewes for 2 hours (group C, n = 7), to males for 2 hours (group M2, n = 10) or to males for 12 hours (group M12, n = 13). The ratio was always one animal introduced for two experimental ewes. The experiment was organized in such a way that all slaughtering took place took between 10:00 hours and 16:00 hours; the mean time was similar in all the groups.
Blood samples were collected every half hour from 2 hours before introduction of the stimulus (T − 2 hours) to time of slaughtering (T + 2 hours) in the groups C and M2 and every 2 hours from T − 2 hours to T + 4 hours and at T + 8 hours and T + 12 hours in the group M12 to measure LH and verify the endocrine response to the stimulation. Samples were centrifuged and plasma were stored at −20°C until they were assayed.
Tissue fixation
Ewes were slaughtered in a registered slaughterhouse by a sodium pentobarbital intravenous injection (Laboratoire Vetoquinol SA 70204, Lure, France; 15 mL per ewe) administered by a certified butcher. The brain was fixed by perfusion through both carotids with 1 L of 1% sodium nitrite in 0.9% saline, followed by 3 L of fixative containing 4% paraformaldehyde in 0.1 M phosphate buffer, pH 7.4. After dissection, brains were postfixed for 6 hours and then soaked in 100 mL of 20% sucrose in phosphate buffer at 4°C. Frontal sections (25 µm) were cut in a sliding freezing microtome. Sections were stored in cryoprotectant at −20°C until further processing.
Kiss and c-Fos immunolabeling
Sections were washed (3 × 5 minutes; room temperature) in 0.01 M phosphate-buffered saline (PBS; pH, 7.4). Double immunolabeling was performed in the POA and throughout the ARC by using a polyclonal rabbit antibody directed against mouse kisspeptin-10 (1:20,000; Ac 564, RRID: AB_2622231) and a monoclonal mouse anti-cFos antibody (1:5000; Santa Cruz 271243, RRID:AB_10610067). The sections were incubated with the primary antibodies diluted in PBS 0.3% Triton X-100 containing 5% normal goat serum for 48 hours at 4°C in a humid atmosphere. For visualization, sections were washed in PBS and incubated for 60 minutes at room temperature (RT) in fluorescein isothiocyanate–linked goat anti-rabbit IgG (1:500; Jackson ImmunoResearch Laboratories, Baltimore, MD), then in biotinylated goat anti-mouse IgG (1:500; Jackson ImmunoResearch Laboratories) for 60 minutes at RT, followed by Texas Red–linked streptavidin (1:300; Vector Laboratories, Burlingame, CA) for 60 minutes at RT. The sections were thoroughly washed in PBS, mounted on slides pretreated with silane- (Sigma-Aldrich, St. Louis, MO; reference: A3648), left to dry for approximately 15 minutes, and coverslipped by using Fluoromount (Sigma-Aldrich) as a mounting medium. The specificity of the rabbit anti-Kiss antibody for the detection of Kiss neurons in the ewe has been published previously (20). The specificity of the c-Fos antibody was checked by preadsorbing the antibody with a saturating concentration of the immunogen protein, which resulted in no c-Fos labeling on the sections after immunocytochemistry. When primary antibodies were omitted or replaced by normal serum from the same species, and when secondary antibodies raised against inappropriate species were used, there was also a complete loss of immunostaining.
Quantification of immunolabeling
Kiss and c-Fos neurons were observed with an Olympus BX51 fluorescence microscope (Olympus Optical Co., Hamburg, Germany) equipped with a U-MNIBA2 filter allowing detection of fluorescein isothiocyanate–labeled neurons (excitation wavelength, 470 to 490 nm), and with a U-MWIG2 filter (excitation wavelength, 520 to 550 nm) for visualization of Texas Red–stained cells. Switching from one filter to the other allowed double-immunoreactive neurons to be visualized. These were also discernible on the merged image obtained from pictures taken under each filter illumination using a digital camera (Spot version 4.0 Insight FireWire; Diagnostic Instruments, Burroughs, MI) driven by the Spot Advanced software (Diagnostic Instruments).
Kiss and c-Fos were observed on three to five sections of the POA taken 500 µm apart and on four to eight sections (taken every 500 µm) of the ARC for each ewe in our three experimental conditions (group C, n = 5; group M2, n = 7; group M12, n = 12). Sets of microphotographs (20× magnifications) were taken in randomly selected fields of the ARC and POA. One set consisted of three photographs of the same field taken with the U-MNIBA2 filter (Kiss neurons), with the U-MWIG2 filter (c-Fos neurons), and of the merge image.
For each area of each animal, microphotographs were taken (6 to10 in the POA and 8-15 in the ARC), and labeled cells were then counted by an examiner who was unaware of the experimental treatment.
Statistical analysis
Statistical tests were carried out by using Statistica, version 10 (StatSoft Inc., Tulsa, OK). Because the size of the POA and ARC varied among ewes and each randomly selected microscopic field size was 263 × 351 µm, analyses were performed on the total surface observed for each ewe. They were expressed as total number of Kiss-IR and c-Fos-IR neurons cells/mm2. For each group, overall median density and interquartile values were calculated and compared by using a nonparametric Kruskal–Wallis test followed when appropriate by a Mann–Whitney U test because data were not normally distributed. Percentages of Kiss neurons expressing c-Fos and of c-Fos cells expressing Kiss were calculated for each group in each area and compared by using a χ2 test. Mean LH concentrations were compared by using analysis of variance (ANOVA).
Pharmacological study
Brain surgery
Ewes were fitted bilaterally with a guide cannula aimed at 5 mm above the target—the POA or the ARC—using a technique that combines a stereotaxic method with lateral and frontal radiography (21). The stereotaxic coordinates were determined by using Richard’s atlas (22) and our own data (21). Surgery was carried out under general anesthesia induced by an injection of thiopental (1 g Nesdonal; Specia Rhone Poulenc, Paris, France) and atropine sulfate (20 mg; Lavoisier, Paris, France) and maintained by closed-circuit halothane (Bélamont, Neuilly, France). Full aseptic precautions were taken throughout. Just before the surgery, each ewe was given 5 mg morphine (Aguettant, Lyon, France) as an analgesic. After surgery, ewes were injected once with 0.2 mL/kg Finadyne (Vetoquinol, Lure, France) and received 5 mL of dexamethasone (Diurizone; Vetoquinol) daily for 3 days and 1 mL/kg Clamoxyl (Pfizer, Paris, France) for 5 days . Females were allowed a minimum of 2 weeks to recover before sampling, and during this period they were habituated to handling.
Infusion of antagonist
Two antagonists were used in the studies. P234 [acetyl-(D-Ala)-Asn-Trp-Asn-Gly-Phe-Gly-(D-Trp)-Arg-Phe-NH2] and P271 [Arg-Arg-Met-Lys-Trp-Lys-Lys-Tyr-(D-Ala)-Asn-Trp-Asn-Gly-Phe-Gly-(D-Trp)-Arg-Phe-NH2]). They were custom synthesized by EZBiolabs (Carmel, IN) by solid-phase synthesis and purified to >95% on high-performance liquid chromatography. The structures were confirmed by mass spectrometry. The two peptides were used because we were uncertain whether P234 would be efficacious at crossing the blood–brain barrier and P271 is the same structure with a penetrating sequence at the amino terminus to convey passage across the blood–brain barrier. These peptides were shown to antagonize Kiss at the GPR54 receptor in vitro and in vivo in mice, rats, monkeys, and sheep (23–25). The antagonist was also active in antagonizing kisspeptin in human placenta (26). Both P234 and P271 required for the experiments were weighed out the day before, dissolved in 10% ultrapure water (P234) or acetonitrile (P271) as recommended by the manufacturer.
On the day of the experiment, the stock solution was diluted with Ringer solution (pH, 6.5) to the final concentration. The day before the experiment, females were implanted with a catheter in the jugular vein to allow blood sampling and were fitted with belts that held the pumps for the dialysis the next day. On the day of the experiment, microdialysis probes with 5-mm membrane length (Mab 6; Microbiotech, Stockholm, Sweden) were lowered into the previously implanted guide tubes at least 1 hour before the beginning of antagonist infusion, and Ringer solution (pH, 6.5) was pumped through the probes at 2 µL/min by using a battery-driven syringe pump (MS16A, Graseby Medical, Watford, United Kingdom) taped to the animal’s back. Microdialysates collected every 15 minutes into 500 µL Eppendorf tubes allowed us to verify that the flow rate was correct. Ten minutes before the infusion with the Kiss antagonist (P234 or P271 depending on the experiment) was due to start all, the syringes were changed and the liquid pumped so that administration of the antagonist commenced at the correct time for all the ewes. The antagonists were infused for 3 or 12 hours.
Experimental protocol
Pilot study.
A pilot study was done to select treatments that would allow us to observe an inhibitory effect of the Kiss antagonist on the male-induced secretion of LH without blocking LH basal secretion totally. To achieve this, anoestrus Ile de France ewes implanted with guides as described previously (ARC, n = 7; POA, n = 6) were exposed in random order to treatments P1, P2, and P3, illustrated in Fig. 1(a). P1 refers to antagonist alone: Ewes were infused with Kiss antagonist P234 or P271 (10−4M, 10−6M, and 10−8M) for 3 hours. P2 refers to antagonist + male: Ewes were submitted to the same treatments and rams were introduced for 4 hours starting 1 hour after the beginning of the antagonist infusion. P3 refers to solvent + male: Ewes were infused with Ringer solution and exposed to rams as previously.
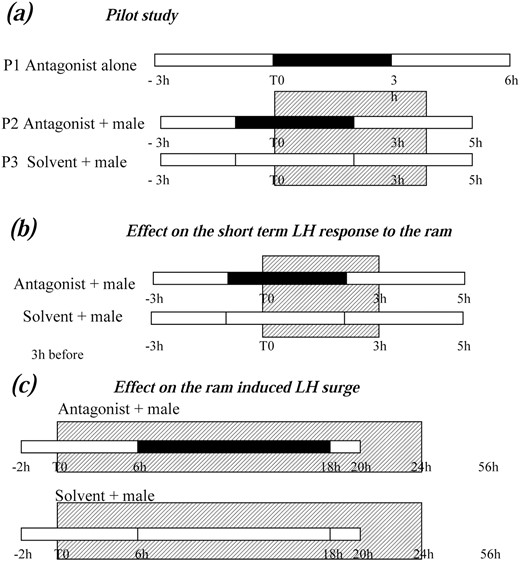
Schematic representation of the protocols used in the pharmacological study. In all the experiments empty bars indicate the period of solvent infusion, black bars the period of antagonist infusion, and the hatched box the period of presence of the ram. (a) Pilot study: the antagonists P234 and P271 (10−8 to 10−4 M) were administered for 3 hours starting 1 hour before ram introduction. The ram was present for 4 hours and blood samples were collected every 15 minutes during the whole study. (b) Effect on the short-term LH response to the ram: the antagonist P234 (10−6 M) was administered for 3 hours starting 1 hour before ram introduction. The ram was present for 3 hours and blood samples were collected every 15 minutes during the whole study. (c) Effect on the ram-induced LH surge: antagonist P271 (10−4 M) was administered for 12 hours starting 6 hours after ram introduction. Blood samples were taken hourly until 24 hours after introduction of the ram (24 hours) and every 4 hours for the next 32 hours (until 56 hours). The ram was present the whole study.
Blood samples were collected every 15 minutes. Samples were centrifuged and plasma was stored at −20°C until assayed.
Effect of kisspeptin antagonist on short-term LH response to ram (short-term experiment).
The protocol is illustrated in Fig. 1(b). P234 10−6 M was administered for 3 hours through microdialysis probes lowered 1 to 1.5 hours after the beginning of the blood sampling in the guide cannula, as described earlier. Ewes were exposed to the male for 3 hours starting 1 hour after the beginning of the infusion of the antagonist. The ewes were their own control, so they all went through a control cycle with solvent solution (Ringer solution) and the antagonist cycle in random order (POA, n = 10; ARC, n = 11).
On the day of the experiment, blood samples were collected every 15 minutes starting 2 hours before the beginning of the infusion and ending 2 hours after male withdrawal.
Effect of kisspeptin antagonist on male-induced LH surge (surge experiment).
The protocol is illustrated in Fig. 1(c). P271 10−4 M was administered 6 to 18 hours after introduction of males to ewes implanted in the POA or ARC. A group of ewes implanted in the ARC or POA and infused with solvent and one ewe that was not implanted served as a control in this experiment.
Blood samples were collected every hour for 26 hours starting 2 hours before introduction of the male and then every 4 hours until 56 hours after introduction of the male.
Postmortem histologic assessment
At the end of the experiment, females were euthanized by overdose of anesthetic and their brains removed for subsequent histologic assessment. Free-floating frontal sections (40 µm thick) were cut on a freezing microtome and stained with cresyl violet to facilitate histologic identification of probe location.
Statistical analysis
Statistical tests were carried out by using Statistica, version 10 (StatSoft Inc.). In the pilot study, several ewes became cyclic spontaneously or a few days after a dialysis session, so not all ewes could go through all the treatments. The protocol could not be fully matched, and this compromised statistical analysis. In P1, the effects of P234 and P271 alone were analyzed as one set of data combining the different concentrations before, during, and after treatment using a general linear model (GLM) ANOVA with repeated samples as if the data came from different animals. Because the GLM analysis showed a trend toward significance (P < 0.06), the data were further analyzed by using the least significant difference (LSD) post hoc tests.
No statistical analysis was done on the data from P2 and P3 (pilot study), and effects were only compared qualitatively by using mean LH concentration and pulse frequency before, during, and after introduction of the male.
In the short-term experiment, the ewes were their own controls. The data were discarded from three ewes that could not go through the two sessions because they were ill or cyclic and one ewe in which the probes were not in the correct position. In each group (POA, n = 7; ARC, n = 10), the effect of the antagonist on the short-term LH response to introduction of the male was analyzed by using the mean pulse frequency during the period before, during, and after introduction of the male, during the antagonist and solvent dialysis sessions. These data were compared using a GLM ANOVA with two factors (treatment and time) and repeated values followed by LSD Fisher post hoc test. When possible (n > 6), nonparametric Wilcoxon tests were used to confirm the results of the LSD test. Because many ewes did not have pulsatile LH before introduction of the male, this analysis could not be done on the LH pulse amplitude. This parameter was compared during the presence of the male in antagonist and Ringer sessions by using ANOVA for repeated samples.
To take into account individual differences in LH concentration before introduction of the male, LH data were also expressed and analyzed as percentage changes relative to the mean LH concentration during the hour before introduction of the male. They were compared by using a GLM ANOVA with two factors (treatment and time) and repeated values followed by an LSD Fisher post hoc test.
In the surge experiment, to be sure that we were analyzing the effect of the antagonist on the ability to present an LH surge and not differences in short-term LH response, only ewes that showed a short-term LH response to the ram (POA, n = 5; ARC, n = 6; C, n = 6) were used. A ewe was considered as having had a short-term response if the LH concentration in one sample collected within the 4 hours after introduction of the male was higher than the mean concentration before introduction of the male plus 3 standard deviations of the reference of the assay. The time this occurred was considered as the latency, and the amplitude of the response was evaluated as the difference between the highest value within the 4 hours after introduction of the male and the mean LH level of this ewe before introduction of the male. Latencies and amplitude of the short-term response among the three groups were compared by using the Kruskal–Wallis test. The proportions of ewes showing an LH surge were compared by χ2 tests.
Differences were considered statistically significant at P < 0.05 and as a trend at P > 0.05 but at P < 0.10.
Results
Immunohistochemical study
Six ewes (two in group C, three in group M2, and one in group M12) could not be used because the measure of progesterone and the observation of the ovary at euthanasia showed that they had recently ovulated.
The mean LH concentration during the 2 hours before stimulation did not differ among groups (0.41 ± 0.03 ng/mL in group C, n = 5; 0.41 ± 0.05 ng/mL in group M2, n = 7; and 0.58 ± 0.16 ng/mL in group M12, n = 12). In ewes exposed to a ram, mean LH concentration significantly increased during the 2 hours after introduction of the ram (group M2: 2.84 ± 0.39, P < 0.0009; M12: 2.66 ± 0.45, P < 0.0012) and LH levels stayed high during the following hours in the M12 group (2.5 ± 0.58, P < 0.009 compared with before). In contrast, females exposed to a group of females did not change (0.37 ± 0.05 ng/mL).
Neurons containing Kiss (Kiss IR) were characterized by a green cytoplasm and those containing Fos (Fos IR) by a round red nucleus. Neurons containing both Kiss IR and Fos IR were visualized as orange cells on the merge image and could be detected both in the ARC and the POA (Fig. 2).

Examples of double-labeled neurons (arrows) at the level of (a–c) ARC and (d–f) POA of a ewe in contact with a ram for 12 hours. Bar scale = 40 µm. Magnification (×2) of cells indicated by arrows are shown in insets a', b', c', d', e', and f'.
The density of Kiss IR cells and Fos IR cells did not differ between groups. This contrasted with the density of cells that had both labels (Kiss + Fos IR), which did differ, both in ARC (P < 0.001) and POA (P < 0.004). In both areas, density was higher in group M2 and group M12 than in group C (P < 0.002) (Table 1). In ARC, the density of Kiss + Fos IR cells in group M12 was higher than in group M2 (P > 0.02), but this difference was not seen in the POA.
Density and Proportion of Kiss IR and Fos IR Cells in Ewes Exposed to Sexually Active Rams for 2 Hours or 12 Hours or Ewes Exposed to Unfamiliar Ewes for 2 Hours
| Group | Kiss IR (cells/mm2) | Fos IR (cells/mm2) | Kiss + Fos IR (cells/mm2) | Kiss IR That Were Also Fos IR (%) | Fos IR That Were Also Kiss IR (%) |
|---|---|---|---|---|---|
| ARC | |||||
| C (n = 5) | 159 ± 1 | 764 ± 182 | 3.0 ± 8.0a | 1.86 ± 2.45a | 0.39 ± 0.82a |
| M2 (n = 7) | 217 ± 57 | 796 ± 213 | 62 ± 16b | 26.3 ± 10.5b | 7.09 ± 2.87b |
| M12 (n = 12) | 238 ± 105 | 691 ± 195 | 94 ± 32b,c | 38.4 ± 20.4b | 13.2 ± 6.0b,c |
| POA | |||||
| C (n = 5) | 69 ± 51 | 239 ± 166 | 14.9 ± 6.3a | 21.7 ± 5.9a | 4.94 ± 8.08d |
| M2 (n = 7) | 66 ± 36 | 366 ± 181 | 47 ± 27b | 71.4 ± 13.5b | 17.3 ± 13.6e |
| M12 (n = 12) | 79 ± 65 | 283 ± 78 | 54 ± 49b | 66.6 ± 15.8b | 21.7 ± 17.7e |
The density of cells and percentage of cells that had both labels (Kiss + Fos IR) were higher in groups M2 and M12 than in group C in both the ARC and the POA. In ARC, the density of Kiss + Fos IR cells and the percentage of Fos IR cells also Kiss IR in group M12 were higher than in group M2 tests. P < 0.002 in all cases. Values are expressed as median ± interquartile. Values with a different superscript are significantly different (Kruskal–Wallis test followed by Mann–Whitney U test).
M2 and M12 differ from C at P < 0.002.
M2 differs from M12 at P < 0.02 (density) and P < 0.05 (percentage).
M2 and M12 differ from C at P < 0.02.
The proportion of Kiss IR cells that were also Fos IR was higher in groups exposed to the ram than in group C in both the ARC and POA (Kruskal–Wallis and paired tests, P < 0.002 in all cases) (Table 1). The same result was observed for the proportion of Fos IR cells that were also Kiss IR both in the ARC (Kruskal–Wallis and paired tests P < 0.002 in all cases) (Table 1) and in the POA (Kruskal–Wallis P < 0.01, paired tests P < 0.02) (Table 1). In the ARC but not the POA, the proportion of both Fos IR and Kiss IR with the two labels was higher in M12 than in M2 (both P < 0.05). These differences were also observed when we analyzed the data for the caudal part of the ARC (P < 0.02 and P < 0.05, respectively).
Pharmacological study
Pilot study
The two antagonists given alone did not significantly affect the mean concentration of LH or the pulse frequency during or after the 3-hour treatment in ewes not exposed to a ram (P1; Table 2). However, there was a tendency for an effect of P271 when infused in the POA on both mean concentration of LH and pulse frequency (P < 0.06). A post hoc test showed that the LH concentration after P271 treatment was lower than before (P < 0.02) and that the LH pulse frequency during the treatment was lower than before (P < 0.03). No dose effect could be detected, as illustrated by changes in mean LH concentration [Fig. 3(a)–3(d)], suggesting that all doses were effectively receptor saturating. On the contrary, the ram-exposed treatment P2 with either antagonist compared with P3 (ram-exposed without antagonist) prevented or at least reduced the short LH response to introduction of the ram in anestrus ewes both when administered near the ARC and in the POA, as illustrated for P234 on Fig. 3(e). Several ewes became cyclic spontaneously or within a few days of the 4-hour exposure to the ram.
Effect of Kiss Antagonist P234 and P271 (10−4 M, 10−6 M, 10−8 M) Administered for 3 Hours on LH Concentration per Period and LH Pulse Frequency of Ewes Left Alone
| Group | LH Concentration (ng/mL) | LH Pulse Frequency (pulse /h) | ||||
|---|---|---|---|---|---|---|
| Before | During | After | Before | During | After | |
| ARC | ||||||
| P234 (n = 9) | 0.68 ± 0.10 | 0.85 ± 0.15 | 0.81 ± 0.16 | 0.30 ± 0.10 | 0.30 ± 0.10 | 0.30 ± 0.09 |
| P271 (n = 10) | 0.60 ± 0.12 | 0.57 ± 0.09 | 0.55 ± 0.09 | 0.37 ± 0.10 | 0.33 ± 0.12 | 0.27 ± 0.07 |
| POA | ||||||
| P234 (n = 11) | 0.70 ± 0.13 | 0.68 ± 0.15 | 0.82 ± 0.14 | 0.27 ± 0.09 | 0.21 ± 0.08 | 0.30 ± 0.08 |
| P271 (n = 12) | 0.74 ± 0.13 | 0.67 ± 0.16 | 0.49 ± 0.07a | 0.36 ± 0.10 | 0.14 ± 0.09a | 0.19 ± 0.08 |
Values are expressed as mean ± standard error of the mean. Data presented are a combination of the different treatments. The values in parentheses in first column indicate the number of data points per group.
P < 0.06 compared with before.
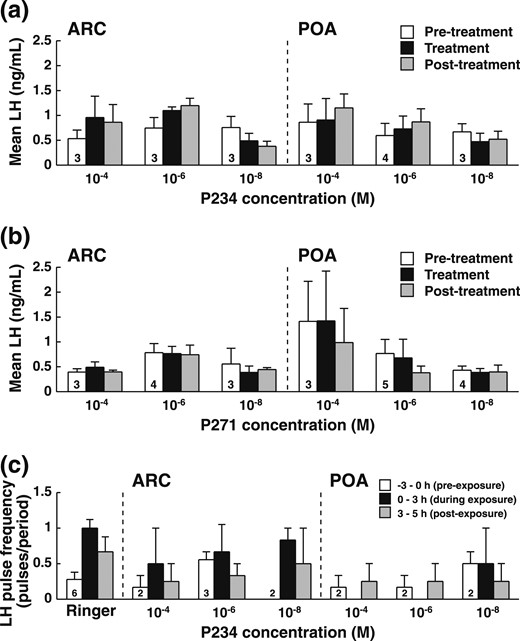
Effects of different concentrations of Kiss antagonist (P234 or P271) administered for 3 hours by retrodialysis in the ARC or the POA to isolated ewes during the pilot study. (a–d) Mean LH concentration per period ± standard error of the mean (SEM) before (open bars), during (gray bars), and after (black bars) administration of P234 or P271 to isolated ewes. (e) Mean number of LH pulse per period ± SEM before (open bars), 0 to 3 hours after (gray bars), and 3 to 5 hours after (black bars) rams were introduced in ewes treated with P234 (3 hours, starting 1 hour before male introduction). Thirteen ewes (7 ARC, 6 POA) were used in this study. The number of animals involved in each treatment is indicated in the open bar.
Consequently, the treatments selected for the experiments were P234 10−6M for 3 hours with rams present for only 3 hours in the study of the short-term LH response to the ram and P 271 10−4M administered 6 to 18 hours after introduction of the male for the study of the male-induced LH surge.
Short-term experiment
Placement of probes.
All probes were correctly placed as shown on Fig. 4, except for one ewe (not shown); this ewe was excluded from the analysis.
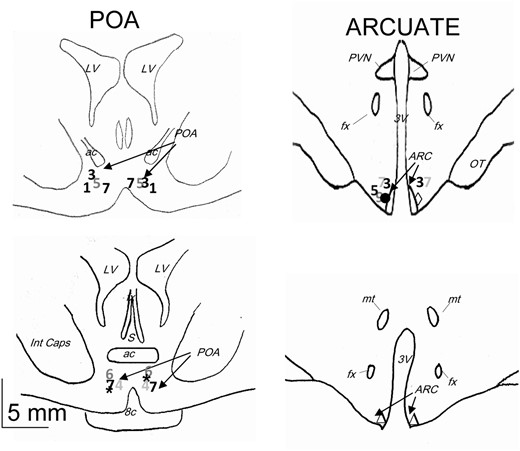
Schematic representation of the localization of the tip of dialysis probes used in the short-term experiment. Numbers and symbols correspond to the different ewes: *ewe 2; ●, ewes 1 and 6, left side; ◊, ewes 1, 5, 6, and 9, right side; ∆, ewes 2, 4, 8, and 10. 3V, third ventricle; ac, anterior commissure; fx, fornix; Int caps, internal capsule; LV, lateral ventricle; mt, mammilothalamic tract; oc, optic chiasma; ot, optic tract; PVN, paraventricular nucleus.
LH response.
Introduction of the male was followed by an increase in LH concentration within 15 to 30 minutes in all the ewes (except one ewe implanted in the ARC Ringer session) as illustrated by Fig. 5(a) and 5(b).
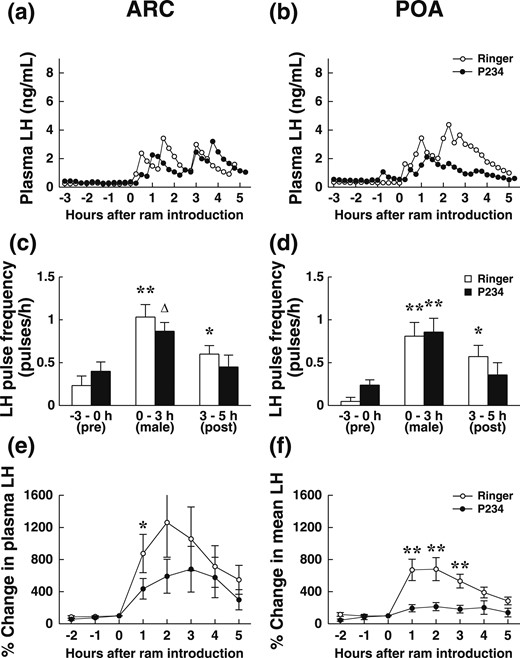
Effect of the Kiss antagonist P234 on the short-term LH response of anestrus ewes exposed for 3 hours to sexually active rams (short-term experiment). Ewes were their own controls, and P234 or solvent was administered by retrodialysis (in random order) for 3 hours starting 1 hour before the male was introduced to ewes implanted in the ARC (a, c, e; n = 10 ) or POA (b, d, f; n = 7). (a and b) Changes in LH secretion in two representative ewes. ○, Ringer solution session; ●, antagonist session. (c and d) Mean pulse frequency per hour ± standard error of the mean (SEM) before ram introduction (−3 hours to T0), during ram presence (T0 to +3 hours), after ram withdrawal (+3 hours to 5 hours). Open bars, values during the Ringer solution session; black bars, values during the antagonist session. (e and f) Percentage change in mean LH concentration (±SEM) compared with the mean concentration during the hour before introduction of the male. ○, Ringer solution session; ●, antagonist session. The rams were introduced just after the sample T0 was collected. *P < 0.05, **P < 0.02, ∆P = 0.067 compared with before (Wilcoxon test).
The frequency of pulses of LH varied with time when ewes were infused with solvent and antagonist in the ARC and POA (GML analysis P < 0.001 in ARC and P < 0.0006 in POA). No effect of treatment (P = 0.40 in ARC and P = 0.94 in POA) and no significant interaction between time and treatment (P = 0.129 in ARC and P = 0.108 in POA< 0.04 in ARC) were detected. When the ram was present, LH pulse frequency was higher than before introduction (LSD P < 0.001 after Ringer solution or antagonist in both ARC and POA; Wilcoxon tests P < 0.02 after Ringer solution in ARC and POA and after P234 in POA, P = 0.067 after P234 in ARC) [Fig. 5(c) and 5(d)]. In the ARC, pulse frequency tended to increase less when ewes were infused with P234 than with solvent (P < 0.067). LH pulse frequency remained high after the ram was withdrawn when ewes were infused with Ringer (LSD P < 0.008 in ARC and P < 0.001 in POA; Wilcoxon test P < 0.05) [Fig. 5(c)and5(d)] but not when they received P234 (LSD P = 0.69 in ARC and P = 0.30 in POA).
The mean amplitude of LH pulses after introduction of the ram was lower when ewes were infused with P234 than with Ringer solution in POA (1.49 ± 0.33 ng/mL vs 2.33 ± 0.43 ng/mL, respectively; ANOVA P < 0.035; Wilcoxon P < 0.043). Ewes implanted in the ARC did not differ (P234: 2.41 ± 0.75 ng/mL vs control session: 2.10 ± 0.72 ng/mL; P = 0.37).
The percentage change in LH concentration did not change over time before introduction of the ram (always P > 0.1) but varied with time after introduction of the ram (P < 0.0001 in ARC and P < 0.003 in POA). In the POA, there was an effect of treatment (P < 0.01) and an interaction between treatment and time (P < 0.01). Treatments differed 1 to 4 hours after introduction of the ram (LSD P < 0.002; Wilcoxon P < 0.02). In the ARC, treatment had no significant effect and no interaction between time and treatment, but the percentage change in concentrations of LH were lower 1 hour after P234 than after solvent (LSD P < 0.043; Wilcoxon P < 0.038).
LH surge experiment
Placement of probes.
All probes were correctly placed, as shown in Fig. 6.
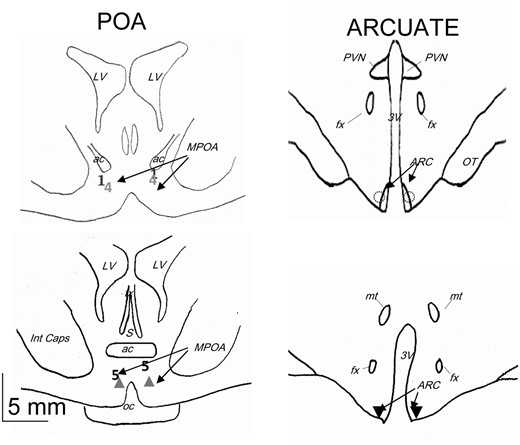
Schematic representation of the localization of the tip of dialysis probes used in the LH surge experiment. Numbers and symbols correspond to the different ewes: ▲, ewes 2 and 3; ◌, ewes 6, 7, and 8; ▼, ewes 9, 10, and 11. 3V, third ventricle; ac, anterior commissure; fx, fornix; Int caps, internal capsule; LV, lateral ventricle; MPOA, medial preoptic area; mt, mammilothalamic tract; oc, optic chiasma; ot, optic tract; PVN, paraventricular nucleus; S, septum.
LH response.
There was no difference in the latency or amplitude of the increase in LH during the 4 hours after introduction of the ram, as shown in Table 3.
Effect of Kiss Antagonist P271 (10−4 M) on LH Response of Anoestrus Ewes Exposed to Sexually Active Rams
| Group | Before Antagonist | After Antagonist | |||
|---|---|---|---|---|---|
| Latency Short-Term LH Response (h) | Amplitude Short-Term Response (ng/mL) | Ewes With LH Surge (%) | Surge Latency (h) | Maximum LH (ng/mL) | |
| Solvent (n = 7) | 1 ± 0 | 1.20 ± 0.34 | 71.4a | 34.60 ± 5.18 | 16.32 ± 1.55 |
| ARC (n = 6) | 1 ± 0 | 1.08 ± 0.24 | 0a | ||
| POA (n = 5) | 1.4 ± 0.24 | 1.06 ± 0.29 | 80a | 31.25 ± 4.55 | 23.30 ± 5.33 |
The antagonist was administered by retrodialysis in the ARC or POA from 6 hours to18 hours after introduction of the male and compared with control ewes that did not receive the antagonist. Before administration of the antagonist, the latency and amplitude of the response did not differ between groups (Mann–Whitney U test). After treatment, the proportion of ewes having an LH surge was lower in the group infused in the ARC than in the others. Values expressed with a plus/minus sign are the mean ± standard error of the mean.
P < 0.016 compared with POA; P < 0.012 compared with χ2 tests.
The proportion of ewes showing a surge of LH differed between groups (P < 0.01) and was lower in the group that received P271 in the ARC (0/6) than the group that received the antagonist in the POA (4/5; P < 0.016) or control ewes (5/7; P < 0.012). One ewe in the ARC group presented an increase in LH concentration, but the maximum LH concentration was only 9.8 ng/mL in the last sample collected 56 hours after introduction of the male. The latency of the LH surge and the maximum LH concentration did not differ between ewes infused with P271 in the POA and control ewes (34.6 ± 5.2 hours in solvent and 31.2 ± 4.6 hours in POA).
Discussion
Exposure of anestrus ewes to a sexually active ram induces an immediate increase in LH pulsatile secretion followed by an increase in estradiol secretion that will eventually induce a preovulatory LH surge (27). The aim of this study was to identify the role of Kiss neurons in these two steps of the ram-induced stimulation of LH secretion in Ile de France adult ewes. In this breed, an LH surge was found in >90% ewes, with a mean latency of 16.7 ± 1.3 hours (laboratory data from 2012 to 2015; n = 76). Male-induced stimulation of LH secretion was accompanied by activation of neurons containing Kiss from both ARC and POA populations, and the LH response to the ram was altered differently by local administration of Kiss antagonists depending on time and site. Administration of P234 into the POA and to a lesser extent into the ARC at the time of introduction of the male reduced the short-term LH response, whereas the administration of P271 6 to 18 hours later blocked the male-induced LH surge when infused into the ARC but not the POA.
In ewes analyzed after 2-hour exposure to a ram, during the short-term LH response, the density and the proportion of Kiss IR neurons that were also Fos IR (Kiss + Fos IR) were higher in both the ARC and POA than those in ewes exposed to unfamiliar ewes that were not showing changes in LH.
In the POA, the proportion of Kiss + Fos IR cells was very high (70%), indicating a massive recruitment of this cell population as soon as the ewes perceived the ram. Such activation was not observed in previous studies in sheep (16) for reasons that are not clear. However, a similar activation of Kiss cells was observed in the POA of mice when exposed to male urine but not to female urine (12). These activations suggest that POA Kiss neurons play a role in the immediate stimulation of LH secretion in response to the sexual partner. This hypothesis is supported by the strong inhibitory effect we observed when the Kiss antagonist P234 was administered locally in the POA at the time of introduction of the male.
The stimulation of LH secretion probably occurs at least partly as a result of POA Kiss neuron activation of GnRH neurons in the POA. Receptors for Kiss are present on GnRH cells in the POA in all species studied (2), and GnRH neurons in POA receive fibers from POA Kiss neurons (28–30). Furthermore, exposure to a ram in the same conditions as those used in the current study or to its odor induced an increase in the proportion of GnRH neurons activated in the POA and organum vasculosum of the lamina terminalis (10, 16) that is reduced by the administration of a Kiss antagonist in the lateral ventricle (16). POA Kiss neurons contain estradiol receptor α (2, 20),) and in anestrus ewes some estradiol receptor αcontaining cells in the POA are activated by negative feedback action of estradiol (E2) (2). Thus, this activation could involve the same cells as those activated by the ram and be part of the network responsible for suppressing the effect of the E2 negative feedback and starting the transition to the LH surge (31).
The fact that the antagonist P234 in the POA affected the amplitude of the LH response to the ram but not the LH pulse frequency suggests that the POA Kiss action is not through a network controlling and/or generating LH pulses but through a network modulating the intensity of the ewe’s response to the ram. Male-induced pulsatility of LH could be a partially different phenomenon from spontaneous or steroid controlled pulsatility. This could explain why Li et al. (32) studying ovariectomized E2-treated rats found that P234 had no effect on LH pulsatility when administered in the POA but decreased it when given in the ARC. Although nearly all ewes, anestrus or cyclic, respond to exposure to a sexually active ram by immediately increasing their secretion of LH (17, 25, 31, 33), the degree and amplitude of this stimulation and the consequences on ovarian function vary (11, 17, 25). POA Kiss neurons modulating the intensity of the LH response could play a role in this variability.
During the short-term LH response, the density and proportion of Kiss + Fos IR increased in ARC in ewes. These results are supported by those of De Bond et al. (16) after 3-hour exposure to rams, and, interestingly, the increase in the proportion Kiss + Fos IR in both studies was ninefold. This suggests that the Kiss neurons from the ARC, the KNDy neurons (34), are also involved in the early endocrine response of ewes to the ram. These results are consistent with the increase in multiunit electrophysiologic activity observed in ovariectomized goats in response to buck odor in the area where KNDy neurons are located and in parallel with an increase in LH pulsatile secretion (13) and with the inhibitory effect of a neurokinin B receptor antagonist (35).
When P234 was infused into the ARC at the same time as the ram was introduced, the increase in the frequency of LH pulses tended to be reduced, as was the duration of this increase when compared with ewes receiving vehicle. The percentage change in LH concentration compared with before introduction of the ram was reduced after P234 compared with vehicle, although less than after the POA infusion. Overall, the effects of the antagonist that we observed were in the same direction but smaller than those of De Bond et al. (16), who observed an inhibition of male-induced LH pulses in Suffolk ewes. There are several explanations for the difference in magnitude of the effect. De Bond et al. (16) used a much higher dose of Kiss antagonist than we did, used only antagonist P271 (which is designed to be membrane permeant), and administered it in the lateral ventricle of the brain. Thus, the Kiss antagonist in their study probably penetrated to more areas than did the antagonists in the current studies.
In our experiment, we were as selective as possible by using P234, reducing the amount of antagonist so that it did not totally block the ability of the nervous system to generate LH pulses. We were successful in this, and, indeed, we observed no major effects of the Kiss antagonist on the baseline LH secretion, confirming the observations made by Roseweir et al. (23) in different species and using different protocols. As proposed by these authors, these results may indicate a “genuine physiological role of Kiss preferentially involved in the generation of specific stimulation of the HPG axis” and the key role of kisspeptin as a relay between environmental factors and the HPG axis. However, as suggested by our results in the pilot study, the identification of the neural network specifically driven by social cues, nutritional cues, or steroids if they are different could be very challenging. We also administered it locally through retrodialysis to have information on the site of action of Kiss with minimum tissue damage. In a previous experiment, we had shown that the area of diffusion around this type of dialysis probe was 1 to 2 mm (36). It is therefore highly probable that P234 in our study did not reach all the KNDy neurons of each ewe because they are spread over 3 mm. In all ewes, some Kiss receptors would still be active and sufficient to allow a male-induced LH secretion. For example, it is probable that the antagonist did not reach all the KNDy neurons in the caudal ARC in ewes implanted in the rostral ARC. However, all ewes responded in the same way. This suggested that the KNDy neurons involved in the response to the ram are not concentrated in a specific part of the ARC but are widespread throughout the ARC area.
Our results also suggested that the POA and ARC populations of Kiss neurons interact to regulate the male induced-pulsatile LH secretion. Anatomic data showing that KNDy neurons are highly interconnected and also make connections with the POA (2) support this hypothesis. These interconnections would allow a permanent adaptation of the activational state of the network controlling LH secretion to sociosexual interactions.
In ewes exposed to rams for 12 hours, and as a consequence on the verge of an LH surge, the density and the proportion of Kiss-Fos IR cells in the POA and ARC were higher than in control animals. Furthermore, in the ARC but not the POA, the density of Kiss + Fos IR cells and the proportion of Fos IR cells that were also Kiss IR (Fos + Kiss IR) were higher in ewes exposed to rams for 12 hours than in those exposed to rams for only 2 hours. Fos protein can only be detected transiently 30 to 45 minutes after stimulation with a maximum concentration of the protein 1.5 to 2 hours later (37). Thus, the increase in the proportion of Fos + Kiss IR cells we observed in the ARC is probably a consequence of a progressive recruitment of Kiss ARC neurons, whereas E2 concentrations were increasing to trigger the preovulatory LH surge. The fact that as many as 67% of the Kiss POA neurons were activated in ewes exposed to rams for 12 hours showed that most Kiss POA cells were still a target for male cues. This suggests that both populations of Kiss neurons are involved in the male-induced LH surge and are coherent with the results observed in intact cyclic ewes by Fergani et al. (38) or in ovariectomized estradiol treated ewes (7, 39). However, it is intriguing that in all these studies, significant activation of Kiss neurons was detected only during the LH surge but not before. This is contrary to what we observed in our study or what was observed after mating in an induced ovulatory, the musk shrew (40). The link between Fos activation before the surge and the stimulation by sexually active rams was described in a study comparing fos messenger RNA in steroid-treated estrus ewes exposed or not exposed to a ram (41). These observations suggested a specific role of Kiss neurons in mediating the effect of sociosexual interactions, possibly via a network at least partly different from the network involved in the E2-induced LH surge. The Kiss neurons activated by the sexual partner could be responsible for the advance of the LH surge induced by repeated exposure of ovariectomized, E2-treated ewes to a ram (42) and for the LH surge seen in 10% of Ile de France or Merino ewes within 4 hours of introduction of the male without a previous increase in E2 (11).
The observation that the Kiss antagonist P271 administered 6 to 18 hours after introduction of the ram inhibited the male-induced LH surge when given in the ARC, but not when given in the POA, showed that although the two populations of Kiss neurons play a role in the LH surge and that the initiation of positive feedback depends mainly on the ARC KNDy neurons and not on the Kiss POA neurons. These results agree with data showing that, in sheep, the primary site of action of E2 in inducing the LH surge is the mediobasal hypothalamus and particularly the ventrolateral part of the ventromedial nucleus (VMN), not the POA (43, 44). They also agree with the reduced Fos activation observed by De Bond et al. (16) in VMN when P271 was administered in the lateral ventricle while the ewes were exposed to a ram. The identity of the neurons stimulated by KNDy neurons is not known. Proopiomelanocortin (POMC) neurons could be a target because, in rats, 63% of these cells have Kiss 1 receptors (45). POMC neurons project to the VMN (46) and POA (47) and are considered to inhibit the LH surge (29, 48, 49). One of the KNDy actions could be to decrease the inhibitory effect of POMC neurons. This connection could also explain why the response to the ram effect is always higher when ewes are in good body condition (50).
How Kiss neurons are activated by male cues is not understood. As with other male mammals, rams alter ewes' LH secretion via their odor, but other cues are also important; the ewes need to be sexually experienced to respond to the male odor (51, 52). Studies using Fos have shown that exposure to male cues is followed by activation of the main and accessory olfactory system, as well as amygdalin and cortical structures (10). Most of these structures are directly or indirectly connected to the POA (53–55), and Kiss neurons have been described in some of them (2). The amygdala could be a key structure. In the rodent it contains Kiss neurons (56, 57) and local administration of Kiss induces an increase in LH (58). In sheep, inactivation of the cortical amygdala prevents the ewe from responding to male odor (36), and retrograde tracing in goat showed that a few KNDy neurons receive apposition of fibers from the medial amygdala (35).
Noradrenaline is another potential link between male cues and LH stimulation by Kiss in the POA. In the rat, fibers containing dopamine β-hydroxylase have been identified in close apposition to Kiss neurons in the POA (59) and administration of an α1 antagonist blocked the circadian rise in Kiss1 messenger RNA in the POA (60). These anatomic data are not available in sheep, but when ewes are exposed to rams, noradrenergic neurons from A1 and locus coeruleus are activated (11), noradrenergic extracellular concentration is increased in the posterior POA in ewes showing an increase in LH in response to the ram (61), and the response to the male can be modulated by manipulation of the noradrenergic system (11). The locus coeruleus is known to have widespread connections that innervate the whole brain and modulate sensory processing, arousal, and attention, which, in turn, facilitate the treatment of relevant or salient information (62). This pathway could allow information from the sexual partner to be considered as salient and therefore more efficient in inducing the endocrine response. This would explain why the endocrine response to the ram effect is high when the male is sexually active (63), is novel and unfamiliar (64) and when ewes are sexually experienced and “know” that the ram is a potential sexual partner.
Conclusion
Kiss is a major integrator of many internal and external factors which influence reproduction. In this study we showed that both POA and ARC populations of Kiss neurons are involved in the different steps of the endocrine response of anoestrus ewes to sexually active rams. We propose the following scenario:
First, brain regions that are activated by the odor and/or the behavior of a sexually active ram activate directly or more probably indirectly most Kiss neurons in POA and this activation is facilitated by the activation of the noradrenergic systems. Male cues also activate some KNDy neurons that interact with other KNDy neurons involved in the generation and control of LH pulsatility.
Second, both POA Kiss and KNDy neurons interact to stimulate GnRH neurons and induce an increase in LH pulsatile secretion. This, in turn, stimulates synthesis and secretion of estradiol by the ovary.
Third, this increase in concentration of estradiol activates more KNDy neurons, possibly via POMC neurons, and together with the concomitant activation of neurons in the VMN, possibly somatostatin, and the continuous activation of POA Kiss, facilitates the “activation” phase of the LH surge in the model proposed by Goodman and Inskeep (31) for the cyclic ewe. The surge then develops in the same way as it does in cyclic ewes with involvement of both POA and ARC Kiss neuronal populations.
Abbreviations:
- ANOVA
analysis of variance
- ARC
arcuate nucleus
- C
ewes exposed to ewes for 2 hours
- E2
estradiol
- Fos IR
double immunofluorescent detection of Fos
- GLM
genera linear model
- GnRH
gonadotropin-releasing hormone
- HPG
hypothalamic-pituitary-gonadal
- Kiss
kisspeptin
- Kiss IR
double immunofluorescent detection of kisspeptin
- LH
luteinizing hormone
- LSD
least significant difference
- M2
ewes exposed to a ram for 2 hours
- M12
ewes exposed to a ram for 12 hours
- PBS
phosphate-buffered saline
- POA
preoptic area
- POMC
proopiomelanocortin
- RT
room temperature
- VMN
ventromedial nucleus.
Acknowledgments
We thank the staff from INRA experimental station in Nouzilly (UEPAO) and Institut National de Recherche Agronomique (INRA) platform Chirurgie et Imagerie pour la Recherche et l’Enseignement for the care of the animals and for their help with the experiments. We also thank Caroline Decourt, Solène Guibout, Anais Rénier, and Vincent Robert, who participated in various aspects of these experiments, and David Lindsay and Rex Scaramuzzi, for their comments and for English-language editing.
Financial Support: The work was supported by a grant from the Région Centre (DURAREP 2 no. 2011 00064290) and the National Research Foundation South Africa (R.M.).
Disclosure Summary: The authors have nothing to disclose.
References
