


Abstract
Type 2 diabetes, which features β-cell failure, is caused by the decrease of β-cell mass and insulin secretory function. Current treatments fail to halt the decrease of functional β-cell mass. Strategies to prevent β-cell apoptosis and dysfunction are highly desirable. Recently, our group and others have reported that blockade of N-methyl-d-aspartate receptors (NMDARs) in the islets has been proposed to prevent the progress of type 2 diabetes through improving β-cell function. It suggests that a sustained activation of the NMDARs may exhibit deleterious effect on β-cells. However, the exact functional impact and mechanism of the sustained NMDAR stimulation on islet β-cells remains unclear. Here, we identify a sustained activation of pancreatic NMDARs as a novel factor of apoptotic β-cell death and function. The sustained treatment with NMDA results in an increase of intracellular [Ca2+] and reactive oxygen species, subsequently induces mitochondrial membrane potential depolarization and a decrease of oxidative phosphorylation expression, and then impairs the mitochondrial function of β-cells. NMDA specifically induces the mitochondrial-dependent pathway of apoptosis in β-cells through upregulation of the proapoptotic Bim and Bax, and downregulation of antiapoptotic Bcl-2. Furthermore, a sustained stimulation of NMDARs impairs β-cell insulin secretion through decrease of pancreatic duodenal homeobox-1 (Pdx-1) and adenosine triphosphate synthesis. The activation of nuclear factor–κB partly contributes to the reduction of Pdx-1 expression induced by overstimulation of NMDARs. In conclusion, we show that the sustained stimulation of NMDARs is a novel mediator of apoptotic signaling and β-cell dysfunction, providing a mechanistic insight into the pathological role of NMDARs activation in diabetes.
Diabetes mellitus is a chronic and progressive metabolic disorder, which affects a large proportion of the world’s population and is increasing in prevalence at an alarming rate (1). The pathological mechanism of diabetes mellitus involves both insulin resistance and decreased insulin secretion from β-cells (2). Approximately 90% of diabetes mellitus cases are of the type 2 variety, which features β-cell failure, caused by reduced β-cell mass and insulin secretory function per β-cell (3), as well as chronic insulin resistance (4). Numerous factors contribute to β-cell failure in type 2 diabetes (5). Oxidative stress in pancreatic islet cells, in particular, is known to play an important role in mediating this dysfunction (6).
Patients with diabetes often require ongoing therapy throughout their lifetime. However, most common antidiabetic drugs, such as sulfonylureas, cannot halt the progression of islet dysfunction and may cause life-threatening hypoglycemia (7, 8). Recently, our group and others have found that a sustained exposure to memantine or dextromethorphan, antagonists of the glutamatergic N-methyl-d-aspartate receptors (NMDARs), improves islet function and enhances blood glucose control in an animal model of type 2 diabetes mellitus without causing hypoglycemia (9, 10), suggesting that NMDARs may be a better drug target for the treatment of diabetes.
NMDARs, glutamate receptors (GluRs), are expressed in the central nervous system (CNS) and in peripheral nonneuronal tissues and cells, including in the kidney, lung, urogenital tract, and pancreatic β-cells (11–13). In the CNS, the excessive activation of the NMDARs causes excitatory neurotoxicity (14, 15), which leads to oxidative damage and mitochondrial dysfunction (16) via increased production of reactive oxygen species (ROS) (17) and hyperpolarization of mitochondrial membrane potential (MMP), collectively contributing to neuronal apoptosis (18, 19). Pancreatic islet β-cells share many cell biology features with neurons (20), suggesting that NMDARs activation might have similar effects on these two cell types. Indeed, a brief exposure to NMDA elicits a rise in [Ca2+]i in single β-cells in vitro (21) and causes a transient increase of insulin secretion (22). In contrast, we previously demonstrated that a sustained NMDA treatment reduces the insulin secretion and cell viability of RINm5f β-cells (10). NMDARs are heteromeric complexes comprising an NMDAR1 subunit combined with one or more NMDAR2 subunits (23). The NMDAR1 subunit is essential to the formation of functioning NMDARs (24). Interestingly, these deleterious effects of sustained NMDAR stimulation in β-cells were eliminated by knocking out NMDAR1 (10). However, the mechanism underlying β-cell dysfunction induced by the sustained activation of NMDARs remains unclear.
Pancreatic duodenal homeobox-1 (Pdx-1) is a key transcription factor in survival and function of β-cells (25, 26). A reduction in pancreatic Pdx-1 expression impairs glucose-stimulated insulin secretion (GSIS) in β-cells (27). A decrease of Pdx-1 expression also leads to the development of type 2 diabetes at adulthood in rats with intrauterine growth restriction (28).
Because overstimulation of NMDARs leads to cell death in CNS, we hypothesized that the sustained activation of pancreatic NMDARs is an initiating trigger of apoptotic and dysfunction signaling in β-cells. This will provide a strong scientific basis for blockade of NMDARs as a target of diabetes.
Materials and Methods
Cell culture
β-cell lines MIN6 (mice) and RINm5f (rats) were cultured in Dulbecco’s modified Eagle medium (HyClone, Logan, UT) or RPMI 1640 (HyClone) supplemented with 10% fetal bovine serum (Gibco, Carlsbad, CA), 2 mM l-glutamine, 100 U/mL penicillin, 100 μg/mL streptomycin, and 50 μM β-mercaptoethanol at 37°C with 5% CO2. They were passaged and harvested by trypsin (Gibco). The culture medium was replaced every other day.
Confocal microscope fluorescent images for intracellular [Ca2+]
Fluorescence intensity of intracellular [Ca2+] induced by fluo-3 acetoxymethyl (AM) in MIN6 cells was detected using a confocal microscope (UltraVIEW VoX; Perkin Elmer). Briefly, MIN6 cells were seeded onto glass coverslips. Cells were treated with or without NMDA (5 mM) for 48 hours. Cells were washed with phosphate-buffered saline and incubated in Hanks balanced salt solution with 5 μM fluo-3 AM (Sigma-Aldrich, St. Louis, MO) for 40 minutes at 37°C. Fluo-3 AM solution was removed, and cells were washed with Hanks balanced salt solution.
Determination of ROS and mitochondrial ROS
Cellular ROS was determined by the 2,7-dichlorofluorescin diacetate (DCFH-DA) fluorometric assay (Sigma-Aldrich), which emits green fluorescence upon oxidation by ROS. The mitochondrial ROS (mtROS) was measured using MitoSOX Red mitochondrial superoxide indicator (Thermo Fisher Scientific, Waltham, MA), which fluoresces red in response to oxidation by mtROS production. Cells were loaded with 10 μM DCFH-DA and 5 μM MitoSOX Red for 20 minutes at 37°C. Fluorescence was monitored using a fluorescence microscope (Nikon, Tokyo, Japan). The level of ROS or mtROS in MIN6 cells was normalized to total protein as determined by the bicinchoninic acid (BCA) assay (Beyotime, Jiangsu, China).
Assessment of MMP
The JC-1 Kit (BD Biosciences, Franklin Lakes, NJ) was used to qualitatively determine alternations in MMP. MIN6 cells were seeded onto glass coverslips in plates. Cells were treated with NMDA (5 mM) for 48 hours, then were washed with phosphate-buffered saline and incubated with JC-1. JC-1 fluoresces green as a monome and demonstrates potential dependent accumulation in the mitochondria causing J-aggregate formation within polarized mitochondria and red fluorescence. A decrease in J-aggregates produces a red (≈590 nm) to green (≈529 nm) fluorescence emission shift and indicates mitochondrial depolarization (29). Cells were then visualized using a confocal microscope (UltraVIEW VoX; Perkin Elmer).
Western blot
Cultured MIN6 cells were homogenized with radioimmunoprecipitation assay buffer (Sigma-Aldrich.). The homogenates were centrifuged and the protein concentrations were measured by the BCA assay (Beyotime). Nuclear Extraction Kit (Sigma-Aldrich) was used to prepare the nuclear protein. Equal amounts of total protein (40 μg) were separated by 15% sodium dodecyl sulfate-polyacrylamide gel electrophoresis and transferred to a polyvinylidene difluoride membrane. The membranes were blocked with 5% nonfat milk and incubated with primary antibodies (Table 1) at 4°C overnight. The membranes were incubated with a horseradish peroxidase-conjugated secondary antibody (1:1000; Cell Signaling Technology, Shanghai, China) at room temperature for 2 hours. Blots were visualized using a chemiluminescence kit (Millipore, Billerica, MA). The densities of bands were quantified using the Quantity One analysis software (Bio-Rad, Hercules, CA).
Antibody Table
| Peptide/Protein Target | RRID | Name of Antibody | Manufacturer, Catalog No. | Species Raised in; Monoclonal or Polyclonal | Dilution Used |
|---|---|---|---|---|---|
| Bim | AB_2065161 | Anti-Bim | Abcam, ab7888 | Rabbit; polyclonal | 1:1000 |
| Bax | AB_329921 | Anti-Bax | Cell Signaling Technology, 2772 | Rabbit; monoclonal | 1:1000 |
| Bcl-2 | AB_1903907 | Anti-Bcl-2 | Cell Signaling Technology, 3498 | Rabbit; monoclonal | 1:1000 |
| Cleaved caspase-3 | AB_873720 | Anti-cleaved caspase-3 | Abcam, ab52293 | Rabbit; polyclonal | 1:500 |
| OXPHOS | AB_2629281 | Anti-OXPHOS | Abcam, ab110413 | Mouse; monoclonal | 1:500 |
| Pdx-1 | AB_777179 | Anti-Pdx-1 | Abcam, ab47267 | Rabbit; polyclonal | 1:3000 |
| β-actin | AB_476744 | Anti-β-actin | Sigma-Aldrich, A5441 | Mouse; monoclonal | 1:7500 |
| p65 | AB_443394 | Anti-p65 | Abcam, ab16502 | Rabbit; polyclonal | 1:1000 |
| Histone H3 | AB_302613 | Anti-Histone H3 | Abcam, ab1791 | Rabbit; polyclonal | 1:1000 |
Abbreviation: RRID, Research Resource Identifier.
Measurement of intracellular levels of adenosine triphosphate
To measure intracellular levels of adenosine triphosphate (ATP), MIN6 cells were treated with or without NMDA (1, 5, and 10 mM) for 48 hours, incubated in Krebs-Ringer bicarbonate (KRB) buffer (2.6 mM CaCl2·2H2O, 1.2 mM MgSO4·7H2O, 1.2 mM KH2PO4, 4.9 mM KCl, 98.5 mM NaCl, and 25.9 mM NaHCO3 supplemented with 20 mM HEPES and 0.1% bovine serum albumin, all from Sigma-Aldrich) for 1 hour, and stimulated with glucose (16.7 mM) for 30 minutes. Cellular ATP levels were measured using a firefly luciferase-based ATP assay kit (Beyotime). The emitted light, which was linearly related to the ATP concentration, was measured using a multimode plate reader (Thermo Fisher Scientific). The intracellular level of ATP was normalized to total protein determined by the BCA assay.
ATP/adenosine 5′-diphosphate ratio
MIN6 cells were seeded in 96-well plates then treated with or without NMDA (1, 5, and 10 mM) for 48 hours. After incubation in 1 mL KRB buffer for 1 hour at 37°C, the cells were stimulated with KRB buffer containing 16.7 mM glucose for 30 minutes. Then, ATP and adenosine 5′-diphosphate (ADP) levels were measured using a BioVision ATP/ADP Ratio Assay Kit (Sigma-Aldrich) according to the manufacturer’s protocol.
Cell apoptosis
MIN6 cells were collected and assessed for apoptosis using an Annexin V-fluorescein isothiocyanate (FITC)/propidium iodide staining kit (Roche). Briefly, 500 μL of binding buffer, 5 μL of Annexin V-FITC, and 5 μL of propidium iodide were added to each sample. Samples were mixed gently and incubated at room temperature for 15 minutes in the dark. Cells were immediately analyzed on a GUAVA flow cytometer (MoFlo XDP; Beckman Coulter).
Quantitative real-time polymerase chain reaction
The total RNA from MIN6 cells was extracted using TRIzol reagent (Invitrogen, Waltham, MA) and reverse transcribed by RevertAid reverse transcription (Thermo Fisher Scientific). The cDNA was stored at −20°C. Real-time polymerase chain reaction (PCR) was performed using the SYBR green master mix (Bio-Rad). The fluorescence spectra were monitored by the CFX-96 real-time PCR detection system (Bio-Rad). We used the expression of β-actin as the references. The primers for the targeted genes are detailed in Table 2.
Sequence of Specific Primers Used in This Study
| Gene | Forward Primer Sequence | Reverse Primer Sequence | Length (bp) |
|---|---|---|---|
| Bcl-2 | aaaccctccatcctgtccag | ccctttcctagacccagcaa | 133 |
| Bax | gtccacgtcagcaatcatcc | gagacacctgagctgacctt | 132 |
| Pdx-1 | acacagctctacaaggaccc | acttccctgctccagtgatc | 153 |
| Slc2a2 | tgctgctggataaattcgcc | aattgcagacccagttgctg | 180 |
| Gck | gaaagtacatgggcgagctg | aaacgggtctcaaaagcacc | 118 |
| Insulin | gttcacatgtgcaggaatgg | ctgtgctttggatgggtttt | 170 |
| β-actin | ttccagccttccttcttg | ggagccagcagtaatc | 182 |
Lentivirus-mediated CRISPR/Cas9 knockdown of NMDAR1 expression
The CRISPR-Cas9 GluN1 single-guide RNA (sgRNA) was purchased from Gene Chen (Shanghai, China). GluN1 sgRNA sequences were CAAGATCGTCAACATCGGCG. RINm5f cells were infected with concentrated lentivirus. The supernatant was replaced with complete culture medium after 24 hours.
Ethics statement
The Ethics Committee of the Center for Scientific Research with Animal Models at Central South University (Changsha, China) approved the experiments, which were performed in accordance with the guidelines of the National Institutes of Health. Rats were anesthetized with pentobarbital sodium (40 mg/kg, intraperitoneal injection), and necessary efforts were taken to minimize suffering before performing operations.
Rat islet isolation
Primary islets were isolated from male 8-week-old Sprague Dawley rats (200 to 250 g). The bile duct near the ampulla of Vater was ligated, and the common bile duct was cannulated and injected with 10 to 15 mL of Hanks buffer containing collagenase V (1 mg/mL; Sigma-Aldrich). The pancreas was dissected, removed from the surrounding tissues, and incubated in a stationary bath at 37°C for 15 minutes. The digested tissue was washed with cold Hanks buffer, and the islets purified using cold Histopaque 1077 and Hanks buffer (Sigma-Aldrich) with centrifugation at 3000g for 20 minutes (3). Islets were collected and incubated at 37°C.
GSIS assay
Insulin secretion from MIN6 cells and primary rat islets was determined via GSIS assays, in which the cells or islets were treated with or without NMDA (1, 5, and 10 mM; Sigma-Aldrich) for 48 hours or treated with or without NMDA (0.5 and 1 mM) for 6 days then incubated for 1 hour in KRB buffer at 37°C with 5% CO2. Cells or islets were next incubated for 1 hour in KRB buffer with 2.8 mM (basal) or 16.7 mM glucose (stimulated) (3). The insulin concentration in the supernatants was determined using ultrasensitive mouse or rat insulin enzyme-linked immunosorbent assay kits (Alpco, Salem, NH) according to the manufacturer’s instructions. Secreted insulin was normalized to insulin content.
Analysis of nuclear factor–κB p65 nuclear translocation by immunofluorescence staining
For immunofluorescence staining of nuclear factor–κB (NF-κB) p65 nuclear translocation in MIN6 cells, cells were grown on coverslips and treated with/without NMDA (5 mM) or/and Pyrrolidine dithiocarbamate (PDTC) (50 μM, Sigma-Aldrich) for 48 hours. Then, cells were fixed in 4% paraformaldehyde. A FITC-conjugated antibody against nuclear factor-κB (NF-κB) p65 (Beyotime) was used to analyze the activation of NF-κB by confocal microscope (UltraVIEW VoX; Perkin Elmer).
Statistical analysis
Data are expressed as the mean ± standard error of the mean. Statistical analysis was performed with SPSS 17.0. Statistical comparisons among the groups were assessed by analysis of variance. When F ratios were significant (P < 0.05), Tukey-Kramer post hoc test was performed (between group comparison). Statistical comparisons among two groups were assessed by t test. Differences were considered significant with P value < 0.05.
Results
NMDA increases [Ca2+]i and ROS production in MIN6 cells
The entry of Ca2+ into neurons through excessive activation of NMDARs contributes to Ca2+ overload (16). Previously, we have found that a brief exposure (8 seconds) of β-cells to NMDA caused a transient rise of intracellular [Ca2+] (10). Here, we found that the intracellular [Ca2+] in MIN6 β-cells was increased after 5 mM NMDA treatment of 48 hours [Fig. 1(a) and 1(b)]. These data suggest that the sustained NMDA treatment causes an increase in intracellular [Ca2+] in MIN6 β-cells.
![NMDA increases [Ca2+]i and ROS production in MIN6 cells. (a and b) Intracellular [Ca2+] of MIN6 cells exposed to NMDA (5 mM) for 48 hours (Bar = 36 μm; *P < 0.05 vs control). (c and d) Representative images of the levels of ROS (green) and mtROS (red) in MIN6 cells after NMDA (5 mM) treatment with or without MK801 (50 μM)/NAC (0.5 mM) for 48 hours. Cells were stained for DCF-DA and MitoSOX to measure levels of ROS and mtROS, respectively (Bar = 400 μm; n = 4; F = 48.955; *P < 0.05 vs control ROS; #P < 0.05 vs NMDA ROS; $P < 0.05 vs control mtROS; &P < 0.05 vs NMDA mtROS). (e) The levels of ROS in MIN6 cells after NMDA (5 mM) treatment of 60 minutes.](https://oup.silverchair-cdn.com/oup/backfile/Content_public/Journal/endo/158/11/10.1210_en.2017-00366/1/m_en.2017-00366f1.jpeg?Expires=1748133023&Signature=TXKqQ-4hU4rKil4BwdZshtsyO0DV8kj8A0oAYOOGXqSo2qH8uiMN7m5n0jHD-9a22CZb0wH2ViTtqONq0UdFYDXKfFIN2kJaIk5HfQ7v8-sqAZk5VDPj4cC~qr52ibYLtxMm4HSqHqwY1ai8f9WeSr6OwkEX9R~AyauHR2Rz4lzoApPwWm4YSGnKLieop6m-AAobz1IL4LS-t3iaMtj-EG~FjYWfRyZmIn3zFZ5uQ8NAknZOQQbFxfWkMSU6vjT-HsfI-LeYjSDhHUQ4rpYPnFlAV7ET~httLsEgyVmmP1wkRyEkSZB7P0xGOQs~OsgqgiEN30YUWqIPyBoFpn~-QA__&Key-Pair-Id=APKAIE5G5CRDK6RD3PGA)
NMDA increases [Ca2+]i and ROS production in MIN6 cells. (a and b) Intracellular [Ca2+] of MIN6 cells exposed to NMDA (5 mM) for 48 hours (Bar = 36 μm; *P < 0.05 vs control). (c and d) Representative images of the levels of ROS (green) and mtROS (red) in MIN6 cells after NMDA (5 mM) treatment with or without MK801 (50 μM)/NAC (0.5 mM) for 48 hours. Cells were stained for DCF-DA and MitoSOX to measure levels of ROS and mtROS, respectively (Bar = 400 μm; n = 4; F = 48.955; *P < 0.05 vs control ROS; #P < 0.05 vs NMDA ROS; $P < 0.05 vs control mtROS; &P < 0.05 vs NMDA mtROS). (e) The levels of ROS in MIN6 cells after NMDA (5 mM) treatment of 60 minutes.
The massive entry of Ca2+ induced by NMDA causes oxidative stress in the CNS (30). β-cells are highly sensitive to oxidative stress, which leads to apoptotic damage, due in part to their low expression of antioxidant enzymes (31). Thus, we detected the levels of intracellular ROS in MIN6 β-cells. As shown in Fig. 1(c) and 1(d), MIN6 cells exposed to NMDA (5 mM) for 48 hours exhibited an increase in the intensity of DCF fluorescence, which indicates increased levels of ROS. The effects of NMDA on intracellular ROS were reduced by pretreatment with MK801 (50 μM), a NMDAR blocker, or N-acetyl-l-cysteine (NAC; 0.5 mM), a ROS scavenger.
Because levels of mtROS rise with increased cellular dysfunction and cause the apoptosis of β-cells (32, 33), we also examined mtROS production in MIN6 cells using the mitochondrial superoxide indicator MitoSOX. The levels of mtROS in MIN6 cells were increased after treatment with NMDA (5 mM) for 48 hours. Moreover, pretreatment with NAC or MK801 reduced the increase in mtROS induced by NMDA [Fig. 1(c) and 1(d)]. However, we did not observe the levels of ROS were increased after incubation with NMDA at 5 mM for 60 minutes [Fig. 1(e)]. Taken together, these results suggest that the sustained treatment with NMDA results in increases of intracellular [Ca2+] and oxidative stress.
NMDA impairs mitochondrial bioenergetic function
Mitochondria dysfunction, induced by oxidative damage, has been involved in the pathogenesis of diabetes (34). To assess whether mitochondrial function is impaired following the sustained NMDA treatment, we first evaluated the MMP in MIN6 cells using JC-1 staining. MMP depolarization is a characteristic feature in early stage apoptosis (35). Upon JC-1 staining, polarized mitochondria are marked by JC-1 aggregate formation and orange–red fluorescence, whereas depolarized mitochondria are marked by JC-1 monomer formation and green fluorescence. Thus, mitochondrial depolarization is signified by a decrease in the red fluorescence and an increase in green fluorescence (29). A lower level of red fluorescence was detected in the cells pretreated with NMDA (5 mM, 48 hours) compared with that in the control cells. Moreover, NMDA-treated cells exhibited increased levels of green fluorescence compared with that in the untreated cells, indicating the depolarization of MMP [Fig. 2(a)].
![NMDA impairs mitochondrial bioenergetic function. (a) Representative images depicting the MMP in MIN6 cells treated with NMDA (5 mM) for 48 hours. Cells were stained for JC-1 to measure the change in MMP and observed under the confocal microscope [Bar = 58 μm; *P < 0.05 vs the control (red); #P < 0.05 vs the control (green)]. Bar graphs showing (b) intracellular ATP content and (c) intracellular ATP/ADP ratio of MIN6 β-cells stimulated with 16.7 mM glucose for 30 minutes after preincubation with different concentration of NMDA (1, 5, and 10 mM) for 48 hours (n = 4; *P < 0.05 vs the 0 mM NMDA group; **P < 0.01 vs the 0 mM NMDA group). Bar graphs showing (d) intracellular ATP content and (e) intracellular ATP/ADP ratio of MIN6 β-cells stimulated with 16.7 mM glucose for 30 minutes after preincubation with NMDA (5 mM) alone or in combination with NAC (0.5 mM) for 48 hours [n = 4; (d) F = 20.907; (e) F = 7.300; *P < 0.05 vs the control group; #P < 0.05 vs the NMDA group]. (f) Western blot showing expression of OXPHOS complex proteins in control MIN6 cells, and cells treated with NMDA for 48 hours. Bar graphs quantifying OXPHOS protein expression in MIN6 cells exposed to NMDA (1 and 5 mM) for 48 hours (n = 4; *P < 0.05 vs the control group).](https://oup.silverchair-cdn.com/oup/backfile/Content_public/Journal/endo/158/11/10.1210_en.2017-00366/1/m_en.2017-00366f2.jpeg?Expires=1748133023&Signature=cBz-RwsDh5qHc4S4zo~2QSNW4wEk3skhhbHNN8w1Z~CoRWWbcsB-96U278KouREGOj~JVIyNfoKtlK1PFVW48kIgu3YA6rhKUigNRnKRjdheROrucGLXrLSf~gPL5g8An95pYPhlElufdYEBY7N-LYQX5CZgCYVw5aSw3z~x-doHpQe2ELZyatdh5aESOQZ2smXlLVOR1JdxyCkVPL8Zs0og3xpv4DpWPKsKL6OgPOLg8Zw8-~SecSj6iB1dAi8c7xwxgWc95ff05t1mEBE-MgT3EdRETPW1ilYsA5OOsFNlSXK5tstOpkbMVZ2PMJK2FTuilHGKrpOdkBEEcnX8dw__&Key-Pair-Id=APKAIE5G5CRDK6RD3PGA)
NMDA impairs mitochondrial bioenergetic function. (a) Representative images depicting the MMP in MIN6 cells treated with NMDA (5 mM) for 48 hours. Cells were stained for JC-1 to measure the change in MMP and observed under the confocal microscope [Bar = 58 μm; *P < 0.05 vs the control (red); #P < 0.05 vs the control (green)]. Bar graphs showing (b) intracellular ATP content and (c) intracellular ATP/ADP ratio of MIN6 β-cells stimulated with 16.7 mM glucose for 30 minutes after preincubation with different concentration of NMDA (1, 5, and 10 mM) for 48 hours (n = 4; *P < 0.05 vs the 0 mM NMDA group; **P < 0.01 vs the 0 mM NMDA group). Bar graphs showing (d) intracellular ATP content and (e) intracellular ATP/ADP ratio of MIN6 β-cells stimulated with 16.7 mM glucose for 30 minutes after preincubation with NMDA (5 mM) alone or in combination with NAC (0.5 mM) for 48 hours [n = 4; (d) F = 20.907; (e) F = 7.300; *P < 0.05 vs the control group; #P < 0.05 vs the NMDA group]. (f) Western blot showing expression of OXPHOS complex proteins in control MIN6 cells, and cells treated with NMDA for 48 hours. Bar graphs quantifying OXPHOS protein expression in MIN6 cells exposed to NMDA (1 and 5 mM) for 48 hours (n = 4; *P < 0.05 vs the control group).
To further evaluate mitochondrial function in pancreatic β-cells after the sustained NMDA treatment, we assessed the levels of mitochondrial ATP production and ATP/ADP ratio in MIN6 cells. We found that exposure to NMDA induced a dose-dependent decrease of ATP content and ATP/ADP ratio [Fig. 2(b) and 2(c)]. The decrease of intracellular ATP and ATP/ADP ratio induced by the sustained activation of NMDARs were significantly prevented by NAC [Fig. 2(d) and 2(e)].
One of the most important roles of mitochondria in the eukaryotic cell is the production of ATP during oxidative phosphorylation (OXPHOS) (36). Accordingly, we next examined the effect of NMDA on expression of the OXPHOS complex proteins to assess whether changes in this complex contribute to the observed alterations in levels of ATP. Treatment with 5 mM NMDA for 48 hours significantly decreased the expression of complex I and IV in MIN6 cells but did not affect the expression of complex II, III, and V [Fig. 2(f)]. These data collectively suggest that the sustained NMDA treatment impairs mitochondrial bioenergetic function.
NMDA induces MIN6 cell apoptosis via the mitochondrial apoptotic pathway
It has been reported that the blockade of NMDARs reduced the number of apoptotic cells induced by glucotoxicity or inflammatory factor (9, 10). We thus tested whether short-term or prolong activation of NMDARs was itself sufficient to induce apoptosis in rodent β-cells. We observed the apoptosis of MIN6 cells incubated for another 47 hours after pretreatment with NMDA (5 and 10 mM) for 60 minutes. We found that short-term (60 minutes) incubation with NMDA failed to induce MIN6 β-cells apoptosis [Fig. 3(a)]. Notably, MIN6 β-cells were showing a significantly increase in the number of apoptotic cells, especially late apoptotic cells, after a 6-day exposure to 1 mM NMDA [Fig. 3(b)]. Furthermore, compared with controls, exposure to NMDA (10 mM) for 48 hours significantly increased apoptosis in MIN6 cells by about threefold changes [Fig. 3(c)]. Treatment with NAC (0.5 mM) reduced the percentage of apoptotic cells induced by NMDA from ~30% to 18% [Fig. 3(c)]. These data indicate that the activation of NMDARs at a high concentration or longer activation of NMDARs at a low concentration induces apoptosis in MIN6 β-cells.
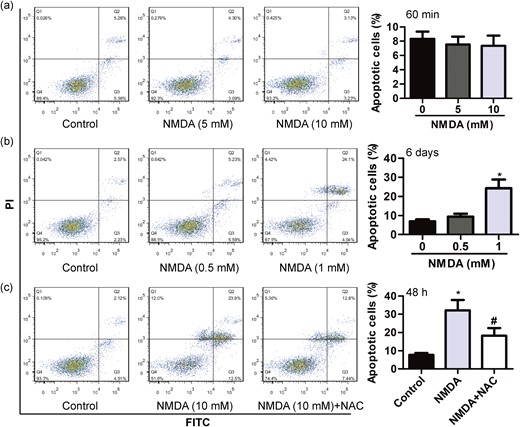
NMDA induces MIN6 cell apoptosis. (a) The apoptotic rate of MIN6 β-cells incubated for another 47 hours after pretreatment with different concentration of NMDA (5 and 10 mM) for 60 minutes (n = 4). (b) The apoptotic rate of MIN6 β-cells exposed to different concentration of NMDA (0.5 and 1 mM) for 6 days (n = 4; *P < 0.05 vs the control group). (c) The apoptotic rate of MIN6 β-cells exposed to NMDA (10 mM) for 48 hours in the absence or presence of NAC (0.5 mM) (n = 4; F = 29.310; *P < 0.05 vs the control group; #P < 0.05 vs the NMDA group).
Previous data propose a role of the mitochondrial pathway in apoptosis induced by excitotoxicity (30). We found that the treatment of NMDA (10 mM) for 48 hours downregulated the expression of antiapoptotic Bcl-2 messenger RNA (mRNA), and upregulated the expression of proapoptotic Bax mRNA [Fig. 4(a)]. Profiling expression of mitochondrial proteins in NMDA (10 mM)-treatment MIN6 cells for 48 hours showed cleavage of caspase-3, induction of proapoptotic Bim, Bax and a decline in antiapoptotic Bcl-2 levels. These effects were partly reversed by NAC (0.5 mM) pretreatment [Fig. 4(b)]. In addition, we found that the expression of Bcl-2 was decreased, and the expression of cleaved caspase-3 was increased in primary islets from rats after NMDA (5 mM) treatment of 48 hours. These effects were also abolished by NAC [Fig. 4(c)]. We next determined whether Bax is a major molecule to take over the proapoptotic action of NMDARs. Indeed, NMDA-induced increases of Bax and caspase-3 cleavage were reduced by Bax inhibitor peptide V5 [Fig. 4(d)], which was shown to promote β-cell survival. These findings emphasize that the sustained treatment with NMDA induced apoptosis via the mitochondrial-dependent pathway in MIN6 β-cell.
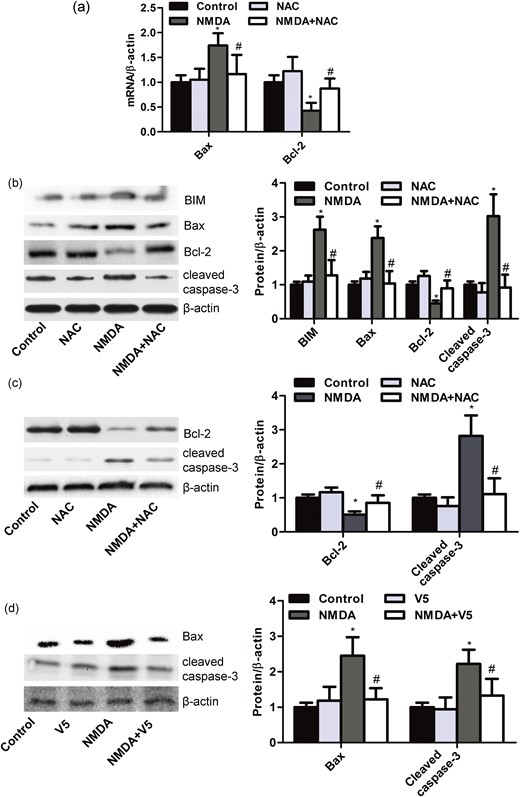
NMDA induces MIN6 cell apoptosis via the mitochondrial apoptotic pathway. (a) Bar graphs representing the expression of Bax and Bcl-2 mRNA in MIN6 β-cells treated with NMDA (10 mM) for 48 hours with or without NAC (0.5 mM) assessed by quantitative real-time PCR (n = 6; *P < 0.05 vs the control group; #P < 0.05 vs the NMDA group). (b) Western blot and bar graphs showing the protein expression of BIM, Bax, Bcl-2, and cleaved caspase-3 in MIN6 β-cells treated with NMDA (10 mM) for 48 hours with or without NAC (0.5 mM) (n = 5; *P < 0.05 vs the control group; #P < 0.05 vs the NMDA group). (c) Western blot and bar graphs showing the protein expression of Bcl-2 and cleaved caspase-3 in primary islets from rats treated with NMDA (5 mM) for 48 hours with or without NAC (0.5 mM) (n = 5; *P < 0.05 vs the control group; #P < 0.05 vs the NMDA group). (d) Western blot and bar graphs showing the protein expression of Bax and cleaved caspase-3 in MIN6 β-cells treated with NMDA (10 mM) for 48 hours with or without peptide V5 (100 μM) (n = 5; *P < 0.05 vs the control group; #P < 0.05 vs the NMDA group).
NMDA reduces insulin secretion of β-cell by reduction of Pdx-1
Previously, we noted that NMDA reduced insulin secretion from RINm5f β-cells (10). And the GSIS of RINm5f β-cells treated with NMDAR1-knockout sgRNA was unaffected after exposure to NMDA for 72 hours (10). To determine whether the effect of NMDARs’ activation on insulin secretion universally existed in pancreatic β-cells, we measured the amount of insulin secreted by MIN6 β-cells and primary islets stimulated by glucose after the treatment with NMDA or not. The incubation of NMDA for 48 hours (5 or 10 mM) significantly reduced insulin secretion stimulated by 16.7 mM but not 2.8 mM in MIN6 cells and primary islets [Fig. 5(a), 5(b), 5(d), and 5(e)]. NMDA did not exhibit adverse effect in the insulin content of MIN6 cells and primary islets [Fig. 5(c) and 5(f)]. Further, MIN6 β-cells were showing a significant decrease in insulin secretion after a longer exposure to NMDA at lower concentration (1 mM, 6 days), whereas insulin content was not affected [Fig. 5(g)–5(i)]. These data suggest that the sustained treatment with NMDA leads to a loss of GSIS in β-cells, which could not be accounted solely by the induction of apoptosis. The β-cell transcription factor Pdx-1, which plays an important role in glucose-induced insulin gene transcription in mature β-cells (26, 27), is reduced in diabetes (37). Here we found that the exposure to NMDA induced a dose-dependent decrease of Pdx-1 mRNA and protein levels in MIN6 cells [Fig. 5(j) and 5(k)]. Analysis of Pdx-1 target genes demonstrated that the sustained treatment with NMDA significantly downregulated Insulin, Slc2a2, and Gck mRNA in MIN6 cells [Fig. 5(l)]. Interestingly, the expression of Pdx-1 in RINm5f β-cells treated with GluN1-knockout sgRNA was unaffected after exposure to 10 mM NMDA for 48 hours [Fig. 5(m)]. These data indicate that the drastic reduction in insulin secretion following the sustained activation of NMDARs may be mediated by Pdx-1.
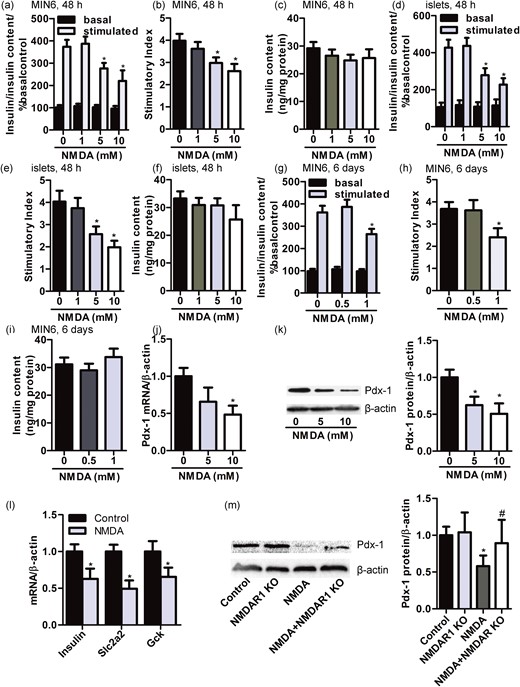
NMDA reduces insulin secretion of β-cell by reduction of Pdx-1. Bar graphs demonstrating insulin secretion during 1-hour incubation with 2.8 mM (basal) and 16.7 mM glucose (stimulated) from (a) MIN6 β-cells and (d) primary islets treated with different concentrate of NMDA (1, 5, and 10 mM) for 48 hours, normalized to insulin content and basal secretion of the 0-mM group. The insulin stimulatory index denotes the ratio of secreted insulin during 1-hour incubation with 16.7 mM to that secreted during 1-hour incubation with 2.8 mM glucose in (b) MIN6 β-cells and (e) primary islets treated with different concentrate of NMDA (1, 5, and 10 mM) for 48 hours. The insulin content of (c) MIN6 cells and (f) primary islets treated with different concentrate of NMDA (1, 5, and 10 mM) for 48 hours (n = 5; *P < 0.05 vs the 0-mM NMDA group). (g) Bar graphs demonstrating insulin secretion during 1-hour incubation with 2.8 mM (basal) and 16.7 mM glucose (stimulated) from MIN6 β-cells treated with different concentrate of NMDA (0.5 and 1 mM) for 6 days, normalized to insulin content and basal secretion of the 0-mM group. (h) The insulin stimulatory index denotes the ratio of secreted insulin during 1-hour incubation with 16.7 mM to that secreted during 1-hour incubation with 2.8 mM glucose in MIN6 β-cells treated with different concentrate of NMDA (0.5 and 1 mM) for 6 days. (i) The insulin content of MIN6 cells treated with different concentrate of NMDA (0.5 and 1 mM) for 6 days (n = 4; *P < 0.05 vs the 0-mM NMDA group). The expression of (j) Pdx-1 mRNA and (k) protein in MIN6 β-cells treated with different concentrate of NMDA (5 and 10 mM) for 48 hours (n = 4; *P < 0.05 vs the 0-mM NMDA group). (l) Bar graphs representing the mRNA expression of Pdx-1 target genes including Insulin, Slc2a2, and Gck in MIN6 β-cells treated with or without NMDA (10 mM) for 48 hours as assessed by quantitative real-time PCR (n = 5; *P < 0.05 vs the control group). (m) Western blot and bar graphs showing the protein expression of Pdx-1 in RINm5f β-cells treated with NMDA (10 mM) for 48 hours with or without NMDAR1 sgRNA (n = 4; F = 6.163; *P < 0.05 vs the control group; #P < 0.05 vs the NMDA group).
NMDA impairs β-cell function by activation of NF-κB
The β-cell-specific activation of NF-κB is a key event in the progressive loss of β-cells in diabetes (38). The inhibition of Pdx-1 gene expression induced by lipopolysaccharides (LPS) is prevented by inhibitor of NF-κB (39). Thus, we tested whether activation of NF-κB was involved in the sustained NMDA treatment in MIN6 cells. Here, we evaluated the translocation of p65 to the nucleus of MIN6 cells. Immunofluorescence experiments demonstrated an increased nuclear distribution of p65 in MIN6 cells after the NMDA (10 mM) treatment of 48 hours compared with the control group [Fig. 6(a)]. Moreover, NF-κB inhibitor PDTC (50 μM) appeared to decrease the nuclear distribution of p65 induced by NMDA in MIN6 cells [Fig. 6(a)].
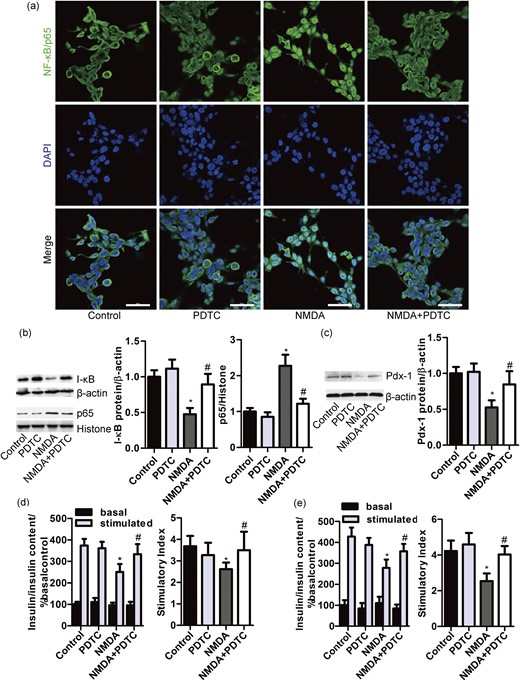
NMDA impairs β-cell function by activation of NF-κB. (a) Representative images of the nuclear localization of NF-κB/p65 in MIN6 cells exposed to NMDA (10 mM) for 48 hours alone or in combination with PDTC (50 μM) (Bar = 50 μm). Western blot and bar graph showing the protein expression of I-κB, (b) nuclear p65 and (c) Pdx-1 in MIN6 β-cells exposed to NMDA (10 mM) for 48 hours with or without PDTC (50 μM) [n = 8; (b) F = 52.279; (c) F = 26.738; *P < 0.05 vs the control group; #P < 0.05 vs the NMDA group). Bar graphs demonstrating insulin secretion during 1-hour incubation with 2.8 mM (basal) and 16.7 mM glucose (stimulated) from (d) MIN6 β-cells and (e) primary rat islets treated with NMDA (10 mM) alone or in combination with PDTC (50 μM) for 48 hours, normalized to insulin content and basal secretion of the control group [n = 5; (d) F = 12.474; (e) F = 18.631;*P < 0.05 vs the control stimulated; #P < 0.05 vs the NMDA group). The insulin stimulatory index denotes the ratio of secreted insulin during 1-hour incubation with 16.7 mM or 2.8 mM glucose (n = 5; *P < 0.05 vs the control group; #P < 0.05 vs the NMDA group).
We also found that the treatment with NMDA (10 mM) for 48 hours promoted the degradation of I-κB and increased the expression of nuclear NF-κB/p65 in MIN6 cells, which were significantly restored by PDTC [Fig. 6(b)]. These results indicate that the sustained treatment with NMDA induces an activation of NF-κB in MIN6 cells. Further, we found that the suppression of Pdx-1 expression induced by the sustained treatment with NMDA was prevented by inhibitor of NF-κB [Fig. 6(c)]. PDTC also eliminated the inhibitory effect of the sustained activation of NMDARs on insulin secretion from MIN6 cells and primary islets [Fig. 6(d) and 6(e)]. These data suggest that the sustained activation of NMDARs impairs β-cell insulin secretion through reduction of Pdx-1 partly by activation of NF-κB.
Discussion
The salient findings of this study can be summarized as follows: (1) the sustained activation of NMDARs induces intracellular Ca2+ overload, MMP depolarization, alters the expression of OXPHOS complex proteins, and ultimately leads to mitochondrial dysfunction in MIN6 β-cells; (2) the sustained NMDA treatment induces MIN6 cell apoptosis via the mitochondrial apoptotic pathway; (3) the decrease of ATP synthesis induced by the sustained activation of NMDARs may give rise to reduction of glucose stimulate insulin secretion; and (4) the sustained activation of NMDARs results in an activation of NF-κB, partly contributing to the decrease of insulin secretion through reduction of Pdx-1 expression. Our work shows that the sustained activation of NMDARs acts as an essential factor in the diverse signaling pathways leading to impaired β-cell survival and function in diabetes.
These findings from the current study are in agreement with our previous studies, which have shown that the sustained activation of NMDARs have deleterious effects on RINm5f β-cells (10). Glutamate is the primary excitatory neurotransmitter in the CNS, which acts through GluRs (40, 41). Functional GluRs have been demonstrated in nonneuronal tissues and cells as well, including in the pancreatic β-cells (20–22). Indeed, our previous study confirmed that GluRs are expressed in a rat/mouse β-cell line RINm5f and MIN6, as well as primary islets from rat (10). Interestingly, it has been reported that daily consumption of dietary glutamate (monosodium glutamate, 2 mg/kg body weight in drinking water) for 1, 6, and 9 months decreases the pancreatic β-cell mass in adult rats. In addition, islet fibrosis was significantly more frequent in monosodium glutamate–treated rats after 1 and 3 months of treatment (42). These results suggest that a long-term activation of the GluRs exhibits deleterious effect on β-cells. The NMDARs appear to be critical for the excitotoxic effects of glutamate on neurons (43). Our current studies are in agreement with these findings, as we demonstrated that a long-term treatment with exogenous NMDA also reduced insulin secretion in response to stimulation of high glucose in MIN6 β-cells and primary islets from rat. It indicates that the deleterious effect of the sustained NMDAR activation on insulin secretion universally existed in pancreatic β-cells.
The sustained activation of NMDARs may affect signal pathways of diabetes through reduction of transcription factor expression profiles, which initiate the process of β-cell failure. In this study, we show that a sustained treatment with NMDA can reduce the expression of Pdx-1 in β-cell. Targeted disruption of Pdx-1 in β-cell affects insulin expression and secretion, leading to diabetes (27). Pdx-1 target genes are decreased after the sustained treatment with NMDA. Previously, we have confirmed that preservation of Pdx-1 is one mechanism involved in the protection of blockade of NMDARs against glucotoxicity in β-cells (10). In this study, we show that Pdx-1 is restored by NMDAR1 knockdown in β-cells. Although the mechanism of reduction of Pdx-1 induced by the sustained treatment with NMDA remains unknown, we show that inhibition of Pdx-1 expression induced by the sustained treatment with NMDA is partly prevented by the NF-κB inhibitor. It indicates that the sustained activation of NMDARs results in the activation of NF-κB, partly contributing to the decrease of insulin secretion through reduction of Pdx-1.
β-cells are highly sensitive to oxidative stress. Increased levels of ROS contribute to both the dysfunction of β-cells and the loss of β-cells (44). Here we observed that the increased levels of intracellular ROS induced by NMDA treatment were mostly of mitochondrial origin. This is in line with the fact that the mitochondrial respiratory chain is the major site of ROS production within the cell (45). The increase in mitochondrial ROS levels induced by NMDA was reduced by NAC, and also by MK801, an NMDAR antagonist. Collectively, these data suggest that the sustained activation of pancreatic NMDARs increases mitochondrial ROS production, and that this increase in oxidative stress may contribute to the NMDA-induced mitochondrial dysfunction.
Mitochondrial dysfunction is a central factor to β-cell failure (34). It has been reported that prolonged activation of NMDAR induces a massive Ca2+ influx, an overload of mitochondrial Ca2+, and a decrease in the MMP, which collectively result in mitochondrial dysfunction. In turn, mitochondrial dysfunction elicits a reduction in intracellular ATP pools, aggravates free radical generation, and most likely activates the caspase cascade that ultimately contributes to neuronal death (31, 32). Similar to the neurons, the results in this study show that the sustained activation of NMDARs impaired mitochondrial function in β-cells.
Overactivation of NMDARs plays an important role in the initiation of cell death (46–48). Previous study proposed that the mitochondrial dysfunction induced by excitotoxicity contributed to apoptosis (30). In line with our data, the sustained treatment with NMDA induced apoptosis in MIN6 β-cells and primary islets. Remarkably, the blockade of NMDARs reduced the number of apoptotic cell induced by inflammatory factor or glucotoxicity in vivo and in vitro (9, 10), suggesting the patho-physiological significance of overactivation of NMDARs in β-cell. Because glucotoxicity or inflammatory are both diabetic stimuli, these data suggest that the sustained activation of NMDARs may acts as an important apoptotic factor in the development of diabetes leading to β-cell apoptosis. We show that the sustained treatment with NMDA induces the mitochondrial-dependent apoptosis pathway in β-cells through alterations in Bim, Bax, Bcl-2, subsequent caspase-3 cleavage, and cell death.
In addition, pancreatic β-cells sense elevated extracellular glucose, leading to an increase of the cellular ATP and ATP/ADP ratio. The increased of ATP promotes the closure of the ATP-sensitive potassium channels (K+ ATP channels), which is the initial triggering event for insulin secretion (49). In our study, we showed that the exposure to NMDA induced a dose-dependent decrease of ATP content and ATP/ADP ratio. It indicates that the sustained activation of NMDARs results in a decrease of insulin secretion, partly due to the reduction of ATP synthesis.
NMDARs bind glutamate with high affinity [half maximal effective concentration (EC50) = 0.51−3.3 μM] (50). However, the cultured cell in vitro may need more glutamate (higher EC50) to evoke excitatory toxicity. It has been reported that an incubation with either NMDA (0.1 to 10 mM) or glutamate (5 or 10 mM, even 25 or 80 mM) evokes excitatory neurotoxicity, which results in neuronal cell death (48, 51–53). On the other hand, cultured neurons obtained at a young age required more glutamate than that obtained from older age animals to evoke excitatory neurotoxicity in vitro. The EC50 at the younger age culture was ~20-fold (685 µM) more than older age cultures, because NMDAR1 and NMDAR2A subunit expression are lower at younger age cultures (54). The low level expression of iGluRs is an explanation for relatively high concentrations of glutamate required in oxidative glutamate toxicity (54). The levels of GluRs in peripheral nonneural tissue are notably lower than that in neurons. Previously, we found that the expression levels of GluRs in β-cell were lower than that in neurons (10). Furthermore, the addition of NMDA (1 mM) to the perfusate induced acute injury in isolated rat lungs (55). As with NMDA toxicity to central neurons, the lung injury is nitric oxide dependent. NMDA (10 mM) upregulates the expression of neuronal nitric oxide synthase in rat lung (51). Based on these reports above, we investigated the effect of NMDA (5 or 10 mM) on β-cell death and dysfunction in the normal culture medium in this study. Furthermore, our dose-response study with longer exposure showed that lower dose of NMDA is sufficient to induce MIN6 β-cell apoptosis and dysfunction (1 mM for a 6-day exposure to NMDA). It indicates that the exposure to NMDA induces a dose- and time-dependent increase of apoptosis and decrease of insulin secretion of β-cells.
In conclusion, our findings raise the possibility that the sustained activation of NMDARs is associated with β-cell failure. It also sheds light on the potential mechanisms underlying the role of NMDA in the pathogenesis of diabetes, and contributes to the growing evidence that NMDAR could be a therapeutic target in diabetes management.
Abbreviations:
- ADP
adenosine 5′-diphosphate
- AM
acetoxymethyl
- ATP
adenosine triphosphate
- BCA
bicinchoninic acid
- CNS
central nervous system
- EC50
half maximal effective concentration
- FITC
fluorescein isothiocyanate
- GluR
glutamate receptor
- GSIS
glucose-stimulated insulin secretion
- KRB
Krebs-Ringer bicarbonate
- MMP
mitochondrial membrane potential
- mRNA
messenger RNA
- mtROS
mitochondrial reactive oxygen species
- NAC
N-acetyl-l-cysteine
- NF-κB
nuclear factor–κB
- NMDAR
N-methyl-d-aspartate receptor
- OXPHOS
oxidative phosphorylation
- PCR
polymerase chain reaction
- PDTC
pyrrolidine dithiocarbamate
- Pdx-1
pancreatic duodenal homeobox-1
- ROS
reactive oxygen species
- sgRNA
single-guide RNA.
Acknowledgments
Financial Support: This work was supported by the National Natural Science Foundation of China (Grants 81170717, 81270121, 81370098, and 81570065), the Hunan Provincial Natural Science Foundation of China (Grant 2017JJ2040), the Open-End Fund for the Valuable and Precision Instrument of Central South University (Grant CSUZC201740), and Fundamental Research Funds for graduate students of Central South University (Grant 2012zzts138).
Author Contributions: X.-T.H. designed and performed most of the experiments, analyzed and interpreted the data, and wrote the manuscript. S.-J.Y., C.L., Y.-H.H., Q.-M.C., C.-X.H., L.-Z.W., and J.-P.X. assisted during the acquisition, analysis, and interpretation of data and revised the manuscript. M.J. and C.C. assisted with data acquisition and revision of the manuscript. All authors approved the final version of the manuscript. Z.-Q.L. and D.-D.F. are responsible for the integrity of the work as a whole. All authors reviewed this manuscript.
Disclosure Summary: The authors have nothing to disclose.
References
