


Abstract
Calreticulin (CRT), a molecular chaperone in the endoplasmic reticulum (ER), plays a variety of roles in cell growth, differentiation, apoptosis, immunity, and cancer biology. It has been reported that CRT is expressed in the human placenta, although its function in placental development is poorly understood. Appropriate invasion of extravillous trophoblasts (EVTs) into the maternal decidua is necessary for successful pregnancy. The objective of the present study was to investigate the expression and functional role of CRT in EVTs using the human EVT cell line HTR8/SVneo, in which CRT gene expression was knocked down. We found that CRT was highly expressed in the human placenta in the early stage of pregnancy and localized to the EVTs. CRT knockdown markedly suppressed the invasion ability of HTR8/SVneo cells. Furthermore, the adhesion to fibronectin was suppressed in the CRT-knockdown cells via the dysfunction of integrin α5β1. In the CRT-knockdown cells, terminal sialylation and fucosylation were decreased, and the core galactose-containing structure was increased in the N-glycans of integrin β1. In addition, the expression levels of several critical glycosyltransferases were changed in the CRT-knockdown cells, consistent with the changes in the N-glycans. These results showed that CRT regulates the function of integrin β1 by affecting the synthesis of N-glycans in HTR8/SVneo cells. Collectively, the results of the present study demonstrate that the ER chaperone CRT plays a regulatory role in the invasion of EVTs, suggesting the importance of CRT expression in placental development during early pregnancy.
During human placental development, trophoblasts differentiate toward two pathways. In the villous pathway, mononucleated cytotrophoblasts differentiate into syncytiotrophoblasts by fusion, resulting in the formation of the outer layer of floating villi. In the extravillous pathway, extravillous trophoblasts (EVTs) invade the decidua and myometrium. This causes remodeling of the spiral arteries into the uteroplacental artery, resulting in establishment of proper placental perfusion. Thus, the appropriate regulation of EVT invasion is strictly controlled during placental development and is essential for successful pregnancy (1, 2).
It has been reported that the expression of adhesion molecules and extracellular matrix ligands are modulated during the trophoblast differentiation in normal placental development (3). Integrins, glycoprotein heterodimers of α and β subunits, are involved in the regulation of focal adhesions and interact with extracellular matrix (ECM) substrata, such as fibronectin, collagens, and laminin (4). The binding specificity of integrins is dictated by the pairing of various α and β subunits (e.g.,α5β1 for fibronectin and α2β1 for either collagens or laminin). During the differentiation of cytotrophoblasts into the invasive EVT phenotypes, the expression of integrin α6β4 is downregulated, followed by upregulation of the expression of integrins α5β1 and α1β1. It has also been reported that integrin α5β1 is crucial for trophoblast migration during the first trimester of pregnancy (5, 6). In pregnancy disorders such as preeclampsia (PE), invasive cytotrophoblasts do not properly modulate the expression of cell surface adhesion molecules, such as integrins and matrix metalloproteinases (7, 8).
PE, a major complication of pregnancy, is characterized by hypertension and proteinuria. Severe PE results in various maternal systemic manifestations and fetal complications, including fetal growth restriction, and is an important cause of mother–child morbidity or mortality (9, 10). It has been recognized that PE mainly underlies poor placentation. Inadequate invasion of EVTs during early placental development causes deficient remodeling of the spiral arteries and inadequate uteroplacental blood flow, which can result in PE. Although the pathogenesis of PE is not fully understood, recent evidence has shown that endoplasmic reticulum (ER) stress is involved in its pathophysiology (11).
ER is a pivotal intracellular compartment that controls Ca2+ homeostasis and quality control of newly synthesized secretory or membrane proteins in eukaryote cells. In the ER, proper folding of nascent proteins is assisted by various molecular chaperones and redox-related enzymes (12). Otherwise, misfolded proteins are translocated from the ER to the cytosol for degradation by machinery known as ER-associated degradation (13). Thus, ER plays a pivotal role in the quality control of biosynthesis of a variety of integral proteins in the cell. ER stress/unfolded protein response is caused by excessive misfolded proteins retained in the ER under certain conditions such as overdrive protein synthesis, abnormal proteins with gene mutation, disturbance of Ca2+ homeostasis, nutritional starvation, oxidative stress, toxins, or chemicals (14). ER stress contributes to various human diseases related to gene mutations, neurodegeneration, metabolism, inflammation, and cancer (14). In cases of PE, hypertension, hyperlipidemia, and inflammation have been proposed as risk factors for placental dysfunction (15). These factors also have causative roles in cellular ER stress (16), suggesting that the risk factors might be, in part, involved in pathological ER stress to cause cell damage in various cell types in the placenta of PE. It has been hypothesized that ER functions play pivotal roles for normal placental development and the pathophysiology of placental dysfunction.
Calreticulin (CRT) is a Ca2+-binding molecular chaperone localized in the ER. CRT assists proper folding of newly synthesized proteins or regulates Ca2+ homeostasis in the ER. CRT is also implicated in many cellular functions, including cellular adhesion, apoptosis, immunity, and cancer progression (17). CRT is expressed in the human placenta (18), and the level of CRT is increased in maternal blood during pregnancy (19). However, the function of CRT in placental development is poorly understood.
In the present study, we investigated whether CRT plays a functional role in trophoblast invasion related to placental development by using human trophoblastic HTR8/SVneo cells in which CRT gene expression was knocked down.
Methods
Materials
The primary antibodies used in the present this study are listed in Table 1. Peroxidase-conjugated secondary antibodies against immunoglobulin G (IgG) of rabbit, mouse, and goat were from Dako (Glostrup, Denmark). Multiwell plates and dishes coated with human fibronectin and collagen IV were from Corning (Corning, NY). All other reagents used in the present study were of high grade and obtained from Sigma-Aldrich (St. Louis, MO) and Wako Pure Chemicals (Osaka, Japan).
Antibodies Used
| Peptide or Protein Target | Antigen Sequence (If Known) | Name of Antibody | Manufacturer, Catalog No. | Species Raised in; Monoclonal or Polyclonal | Dilution Used | RRID |
|---|---|---|---|---|---|---|
| CRT | EEEDVPGQAKDE | Anti-calreticulin | Stressgen, SPA-600 | Rabbit; polyclonal | WB 1:10,000, IF 1:300 | AB_10618853 |
| CRT | NA | Anti-calreticulin antibody (FMC 75) | Abcam, ab22683 | Mouse; monoclonal | IHC 1:5,000 | AB_447253 |
| CK7 | NA | Cytokeratin 7 | Dako, IS619 | Mouse; monoclonal | IHC 1:100 | |
| BiP | NA | GRP78 (C-20) | Santa Cruz, sc-1051 | Goat; polyclonal | WB 1:1,000 | AB_2119994 |
| CNX | NA | Calnexin polyclonal antibody | Stressgen, SPA-860 | Rabbit; polyclonal | WB 1:5,000, IF 1:200 | AB_10616095 |
| ERp57 | NA | Anti-ERp57 | Stressgen, SPA-585 | Rabbit; polyclonal | WB 1:2,000 | AB_10616507 |
| E-cadherin | NA | Purified mouse anti–E-cadherin | BD Biosciences, 610181 | Mouse; monoclonal | WB 1:3,000 | AB_397580 |
| GAPDH | NA | Mouse anti-GAPDH monoclonal antibody | Millipore, MAB374 | Mouse; monoclonal | WB 1:4,000 | AB_2107445 |
| PDI | DDDQKAVKDE | Anti-PDI | Stressgen, SPA-891 | Mouse; monoclonal | IF 1:300 | AB_10615355 |
| Integrin α1 | NA | Integrin α1 (R164) | Santa Cruz, sc-10728 | Rabbit; polyclonal | WB 1:1,000 | AB_2129221 |
| Integrin α5 | NA | Rabbit anti-integrin α5 polyclonal antibody | Millipore, AB1928 | Rabbit; polyclonal | WB 1:5,000, IF 1:500 | AB_2128185 |
| Integrin β1 | NA | Integrin β1 (N20) | Santa Cruz, sc-6622 | Goat; polyclonal | WB 1:1,000 | AB_2128200 |
| Integrin β1 | NA | Mouse anti-human β1 subunit of VLA integrins monoclonal antibody | Millipore, MAB2000 | Mouse; monoclonal | IF 1:200 IP 1:350 | AB_94503 |
| Akt | NA | Akt antibody | Cell Signaling, 9272 | Rabbit; polyclonal | WB 1:1,500 | AB_329827 |
| Phospho-Akt (Ser473) | NA | Phospho-Akt (Ser473) antibody | Cell Signaling, 9271 | Rabbit; polyclonal | WB 1:1,500 | AB_329825 |
| Phospho-Akt (Thr308) | NA | Phospho-Akt (Thr308) antibody | Cell Signaling, 9275 | Rabbit; polyclonal | WB 1:1,500 | AB_329828 |
| FAK | NA | FAK antibody | Cell Signaling, 5747 | Rabbit; polyclonal | WB 1:2,000 | |
| Phospho-FAK | NA | Purified mouse anti-human FAK (pY397) | BD Biosciences, 611806 | Mouse; monoclonal | WB 1:2,000 | AB_399286 |
| β4GalT-I | LPQLVGVSTPLQGGSNSAAAIGQSSGELRTGGARPPPPLGASSQPRPGGDSSPVVDSGPGPASNLTSVPVPHTTALSLPACPEESPLLVGPMLIEFNMPVDLELVAKQNPNVKM | Anti-B4GALT1 | Sigma-Aldrich, HPA010807 | Rabbit; polyclonal | WB 1:1,000 | AB_1078254 |
| ST6Gal-I | NA | Anti-ST6GAL1 | Sigma-Aldrich, SAB4502780 | Rabbit; polyclonal | WB 1:2,000 | AB_10744544 |
| ST3Gal-VI | IQPCLSKPAFASLLRFHQFHPFLCAADFRKIASLYGSDKFDLPYGMRTSAEYFRLALSKLQSCDLFDEFDNIPCKKCVVVGNGGVLKNKTLGEKIDSYDVIIRMNNG | Anti-ST3GAL6 | Sigma-Aldrich, HPA018792 | Rabbit; polyclonal | WB 1:1,000 | AB_10964349 |
| FucT-I | NA | FucT-I (97-I) | Santa Cruz Biotechnology, sc-52398 | Mouse; monoclonal | WB 1:1,000 | AB_2105215 |
Abbreviations: BiP, binding protein of immunoglobulin; CK7, cytokeratin 7; ERp57, ER protein of 57 kDa; GAPDH, glyceraldehyde 3-phosphate dehydrogenase; IF, immunofluorescence; IHC, immunohistochemistry; NA, not available; PDI, protein disulfide isomerase; Phospho, phosphorylated; RRID, Research Resource Identifier; WB, western blotting.
Human tissue collection and sample preparation
Each woman provided informed consent before she donated her placenta. Human placental tissues from the first trimester and early second trimester were collected from women undergoing elective pregnancy terminations. Full-term placental samples were obtained by elective caesarean sections before the onset of labor. After washing the placental tissues in ice-cold phosphate-buffered saline (PBS; pH 7.2), the specimens were fixed in 4% paraformaldehyde in PBS for immunohistochemistry. For immunoblot analysis, the specimens were immediately frozen in liquid nitrogen and stored at −80°C. The ethics committee of Wakayama Medical University approved the present study.
Immunohistochemistry
Placental tissue samples were fixed in 4% paraformaldehyde in PBS, embedded in paraffin, and 4-μm-thick sections prepared. The sections were incubated with the primary antibodies of the anti-CRT antibody (Abcam, Cambridge, UK) at a dilution of 1:5000, and the anti-cytokeratin 7 antibody (Dako) at a dilution of 1:100. Next, the sections were incubated with biotinylated secondary antibodies, followed by incubation with horseradish peroxidase–conjugated streptavidin. Immunoreactive signals were detected by immunostaining using 3,3′-diaminobenzidine (Roche, Basel, Switzerland). Negative staining was performed as described previously, by replacing primary antibodies with nonspecific IgGs at the same dilution.
Cell lines and culture
HTR8/SVneo, a human extravillous trophoblast cell line, was a gift from Dr. Charles H. Graham (Queens University, Kingston, ON, Canada) (20). Human choriocarcinoma cell lines, BeWo, Jar, and JEG3, were purchased from American Type Culture Collection (Manassas, VA). All cell lines were grown in RPMI 1640 medium (Wako Pure Chemicals) supplemented with 10% fetal calf serum (FCS) and the antibiotic mixture containing penicillin, streptomycin, and amphotericin B (Life Technologies, Carlsbad, CA). The cells were cultured at 37°C in an atmosphere of 5% CO2 and 95% air.
Establishment of stable CRT-knockdown transfectants
The expression vector pRS containing small hairpin RNA for CRT (CRT-shRNA) was obtained from Origene Technologies, Inc. (Rockville, MD). HTR8/SVneo cells were transfected with the pRS plasmids with or without CRT-shRNA using Lipofectamine 2000 reagent (Invitrogen Corp., Carlsbad, CA) in accordance with the manufacturer’s protocol. Stable gene transfectants were established after selection with puromycin (1.0 mg/mL). Two CRT-knockdown clones, in which CRT protein expression had been suppressed, were isolated from the gene transfectants and used in the present study. Established cell lines were used between passages 12 and 15.
Transfection with small interfering RNA
To knockdown CRT expression transiently, Silencer® Select Validated small interfering RNA (siRNA) targeting human CRT messenger RNA (mRNA; 5′-CAUCUUUCUUGAUCAACAU-3′; CRT-siRNA; Ambion, Inc., Carlsbad, CA) was transfected into HTR8/SVneo cells using Lipofectamin RNAiMAX (Invitrogen) in accordance with the manufacturer’s instructions. Silencer® Select Negative Control No. 1 siRNA (Ambion, Inc.) was used as the negative control. Subsequent experiments were performed using the cells 48 hours after transfection with either CRT-siRNA or control-siRNA.
Immunoblot analysis
A total of 500 mg of human placental tissues was homogenized with Teflon homogenizer (As One, Osaka, Japan) in 0.4 mL of radioimmunoprecipitation assay buffer (Sigma-Aldrich) containing 10% sodium dodecyl sulfate (SDS), 200 μM phenylmethylsulfonyl fluoride, and protease inhibitors (4 mM Pefabloc, 1 μM pepstatin, and 1 μM leupeptin; Roche). The homogenized samples were centrifuged at 18,000g for 10 minutes at 4°C. The cells were lysed in lysis buffer A [10 mM Tris-HCl (pH 7.5), 150 mM NaCl, 1% Nonidet P-40, and protease inhibitors]. The lysate was sonicated intermittently on ice for 15 minutes, followed by centrifugation at 10,000g for 10 minutes at 4°C. The protein extracts were separated by 7.5 or 10% SDS-polyacrylamide gel electrophoresis and transferred onto a nitrocellulose membrane (Immobilon-P; Millipore Corp.). The membrane was incubated at 4°C overnight with the primary antibody in solution. The membrane was then incubated with a peroxidase-conjugated secondary antibody. Blots were detected using Immobilon western chemiluminescent horseradish peroxidase substrate (Millipore Corp., Bedford, MA). To evaluate the phosphorylation levels of Akt and focal adhesion kinase (FAK) on attachment to fibronectin, cultured cells were detached using 0.53 mM EDTA and 0.05% trypsin, and trypsin was inactivated with 0.1% trypsin inhibitor (Invitrogen). The cells were washed twice with PBS and resuspended in RPMI 1640 medium containing 1% bovine serum albumin. Next, the cells were incubated at 37°C for 30 minutes and seeded onto plates precoated with fibronectin. After a period of incubation at 37°C, the cells were harvested and lysed in lysis buffer A. The protein phosphorylation level was examined by immunoblot analysis as stated previously using specific antibodies. The results were quantified densitometrically using CS Analyzer, version 3.00 (ATTO Corp., Tokyo, Japan). As a loading control, glyceraldehyde 3-phosphate dehydrogenase was used.
Reverse transcription polymerase chain reaction
Total RNA was obtained from HTR-8/SVneo cells using TRIzol reagent (Thermo Fisher Scientific, Waltham, MA) according to the manufacturer’s instructions. Reverse transcription polymerase chain reaction (RT-PCR) was performed using the Prime Script One Step RT-PCR kit, version 2 (Takara, Shiga, Japan). The oligonucleotide sequences of primers used in PCR amplifications are listed in Table 2. The PCR products were electrophoresed using 1.5% agarose gel or 4% acrylamide gel, and the bands were visualized using ethidium bromide staining.
Sequences of Primers Used for RT-PCR
| Variable | Forward primer (5′-3′) | Reverse primer (5′-3′) |
|---|---|---|
| CRT | GGGAATTCGCCATGCTGCTATCCGTGC | GGGAATTCCTACAGCTCGTCCTTGGCC |
| B4GALT1 | ATGAGGCTTCGGGAGCCGCTCCTG | CTAGCTCGGTGTCCCGATGTC |
| ST6GAL1 | GAAAAATGGGCCTTGGCCTG | GAGCAGGAAAACAAGCCTGC |
| FUT1 | ATGTGGCTCCGGAGCCATCGTCAG | AGGATCTCTCAAGTCCGCGTACTC |
| GAPDH | GGATTTGGTCGTATTGGGCG | CAGTAGAGGCAGGGATGATG |
Abbreviations: FUT1, α-1,2-fucosyltransferase-I; GAPDH, glyceraldehyde 3-phosphate dehydrogenase.
Cell proliferation
A total of 5×10³ cells were placed in 100 μL of medium in 96-well plates and incubated in medium containing 10% FCS. Next, the cells were fixed with 4% paraformaldehyde in PBS and stained with 0.01% crystal violet. The stained cells were lysed by adding 100 μL of lysis buffer B (10% SDS and 10 mM HCl), and the cell number was estimated photometrically with the lysates by measuring the absorbance at 595 nm using a microplate reader.
Matrigel invasion assay
Invasion of trophoblasts was examined using Boyden-chamber plates with Matrigel-coated 24-well Transwell inserts (Corning). The inserts were coated with 50 μL of 1 mg/mL Matrigel matrix (BD Biosciences, Franklin Lakes, NJ) according to the manufacturer’s instructions. Cells (4 × 10⁴) were added to the upper chamber in serum-free medium, and medium with 10% FCS was added to the lower well. After incubation at 37°C for 24 hours, noninvading cells were removed using a cotton swab. The filters were washed, fixed in 4% paraformaldehyde in PBS, and stained with 0.01% crystal violet. The number of invading cells was counted under a microscope (magnification ×200) in randomly selected fields.
Cell adhesion assay
A total of 5 × 10³ cells in 100 μL of medium containing 1% bovine serum albumin were seeded in 24-well plates coated with fibronectin or collagen IV and incubated at 37°C for 60 minutes. After washing three times with PBS containing Mg2+ and Ca2+ to remove nonattached cells, the attached cells were fixed with 4% paraformaldehyde and stained with 0.1% crystal violet. The stained cells were lysed in lysis buffer B, and the adhesion was estimated photometrically with the lysates by measuring the absorbance at 595 nm. In experiments with the inhibitory antibody for integrin β1 (Chemicon, Temecula, CA), the cells were preincubated with the anti-integrin β1 antibody or control IgG (10 µg/mL) for 30 minutes. The cells were seeded in 48-well plates with fibronectin, incubated for 30 minutes, and adhesion estimated as described previously.
Immunoprecipitation
Cell lysates containing 900 μg of proteins were incubated with the anti-integrin β1 antibody at 4°C for 2 hours. Protein G-Sepharose beads (Thermo Scientific, Rockford, IL) were added to the lysate and incubated at 4°C overnight. After washing the beads with lysis buffer A, immunoprecipitates were released from the beads by heating in SDS sample buffer (1% SDS and 10 mM dithiothreitol) at 95°C for 10 minutes. The immunoprecipitates were then subjected to immunoblot analysis.
Immunofluorescence microscopy
Cells were fixed in 4% paraformaldehyde, permeabilized with PBS containing 1% Triton X-100 (nacalai tesque, Kyoto, Japan) for 10 minutes, and incubated with specific primary antibodies. The primary antibodies were labeled with the secondary antibodies conjugated with Alexa Fluor 488 or Alexa Fluor 555 (Invitrogen) and visualized using laser scanning confocal microscopy (LSM700Zen; Carl Zeiss, Jena, Germany) and analyzed.
Peptide N-glycosidase F treatment of protein samples
Cell lysates were denatured in 1× denaturing buffer (0.5% SDS and 0.4 M dithiothreitol) at 95°C for 10 minutes. The denatured samples were then incubated in 1× reaction buffer [50 mM sodium phosphate (pH 7.5) containing 1% Nonidet P-40 and 250 U of N-glycosidase F; New England Biolabs] in a final volume of 40 μL at 37°C overnight.
Lectin blot analysis
A protein-blotted nitrocellulose membrane was prepared exactly as described for immunoblot analysis. The membrane was incubated at 4°C overnight with biotinylated lectins, such as concanavalin A (ConA), Datura stramonium agglutinin (DSA), Sambucus sieboldiana agglutinin (SSA), Maackia amurensis (MAM), or Ulex europaeus (UEA-1; J-OIL MILLS, Inc., Tokyo, Japan) (21, 22). Membranes were washed and then incubated with peroxidase-conjugated streptavidin at room temperature for 30 minutes. Blots were detected using chemiluminescence reagents.
Flow cytometric analysis
Cells were detached and washed twice with PBS. They were incubated with 10 µg/mL biotin-conjugated DSA, SSA, MAM, or UEA-1 at 4°C for 30 minutes. They were then washed twice and incubated with DyLight 488–conjugated streptavidin (Invitrogen) at a dilution of 1:100 at 4°C for 30 minutes. Again, they were washed twice with PBS and analyzed using FACSVerse™ (BD Biosciences).
Statistical analysis
Data are presented as the mean ± standard deviation. Statistical analysis was performed using Student t test or one-way analysis of variance with Bonferroni multiple comparison test. P < 0.05 was considered to indicate statistical significance.
Results
Expression of CRT in human placenta and trophoblastic cell lines
First, we examined the expression of CRT by immunoblot analysis in human placenta during the gestational period. In Fig. 1(a), CRT was strongly expressed in all gestational periods. The level was particularly high in the first trimester in gestation. To explore the localization of CRT in the placenta, immunohistochemical analysis was performed in placental tissue from the first trimester. CRT was expressed mainly in the cytoplasm of cytokeratin 7-positive EVTs invading the decidua [Fig. 1(b)].

The expression of CRT in human placenta and trophoblast cell lines. (a) The expression of CRT was examined by immunoblot analysis with the anti-CRT antibody in human placental samples from the first (1 to 12 weeks), second (13 to 28 weeks), and third (29 to 40 weeks) trimesters. As a positive control, the lysate sample of HTR8/SVneo cells (HTR8) was used. The band intensity was quantified as described in Methods. Data are shown as the mean ± standard deviation; *P < 0.05 vs the expression of CRT in placenta from the first trimester. (b) The first trimester (9-week) placental sections were subjected to immunohistochemistry with the anti-CRT and anti-cytokeratin 7 (CK7) antibodies. Staining of CK7 was performed to indicate the location of EVTs. CRT was expressed mainly in the cytoplasm of EVTs invading the decidua (arrows). Magnification ×40 and ×100; scale bars = 100 μm. (c) Expression of CRT, binding protein of immunoglobulin (BiP), CNX, ER protein of 57 kDa (ERp57), E-cadherin, and glyceraldehyde 3-phosphate dehydrogenase (GAPDH) were examined in the trophoblastic cell lines BeWo, Jar, JEG3, and HTR8/SVneo, using immunoblot analysis with specific antibodies. AV, anchoring fillus; DC, decidua; FV, floating villus.
Next, the expression of CRT and other molecular chaperones in the ER [binding protein of immunoglobulin, calnexin (CNX), and ER protein of 57 kDa] was examined by immunoblot analysis in three choriocarcinoma cell lines, BeWo, Jar, and JEG3, and an EVT cell line, HTR8/SVneo. In Fig. 1(c), CRT was detected as a band with 55 kDa and highly expressed in all cell lines. The other chaperones such as binding protein of immunoglobulin, CNX, and ER protein of 57 kDa were also similarly expressed in all cells. E-cadherin was detected as a 120-kDa protein in the three choriocarcinoma cell lines but not in the HTR8/SVneo cells, consistent with the character of invasive-phenotype EVTs. To investigate the physiological roles of CRT in EVTs, we selected HTR8/SVneo cells as an experimental model for the subsequent studies.
Stable knockdown of CRT expression in HTR8/SVneo cells
To study the function of CRT in HTR8/SVneo cells, we established stable CRT-knockdown cell lines by transfection with a CRT-shRNA expression vector. As shown in Fig. 2(a), CRT protein expression was suppressed in CRT-knockdown cells (CRT-shRNA1 and CRT-shRNA2) compared with parental cells [wild-type (WT)] and cells transfected with the control vector (control-shRNA). RT-PCR analysis also indicated the downregulation of CRT mRNA expression in the CRT-knockdown cells [Fig. 2(b)]. As shown in Fig. 2(c), transfection with each vector had no effect on the morphology of the cells. Next, we investigated the intracellular localization of CRT by immunofluorescence microscopy. In Fig. 2(d), immunoreactive signals for CRT showed a perinuclear reticular pattern and overlapped with the signals for protein disulfide isomerase), which is an ER resident oxidoreductase, in all cases. The signal intensity for CRT was decreased in CRT-knockdown cells compared with the control cells.

Stable knockdown of CRT expression in HTR8/SVneo cells. (a) The level of CRT protein was examined by immunoblot analysis using specific antibodies in parental (WT), mock-transfected (control-shRNA), and CRT-knockdown (CRT-shRNA1 and CRT-shRNA2) cells. The level of glyceraldehyde 3-phosphate dehydrogenase (GAPDH) is shown as a loading control. The band intensity was quantified as described in Methods. Data are shown as the mean ± standard deviation of three independent experiments. *P < 0.05 vs control-shRNA. (b) The level of CRT mRNA was examined by RT-PCR, followed by agarose-gel electrophoresis in WT, control, and CRT-knockdown cells. The band intensity was quantified as described in Methods. Data are shown as the mean ± standard deviation of three independent experiments. *P < 0.05 vs WT. (c) Cell morphology was examined using phase-contrast microscopy and photographed for WT, control, and CRT-knockdown cells. Magnification ×100; scale bars = 100 μm. (d) Intracellular localization of CRT (green) and protein disulfide isomerase (PDI; red) was examined in control and CRT-knockdown cells using immunofluorescence microscopy with specific antibodies. PDI staining was used to indicate ER localization. Representative images are shown. Magnification ×630.
Stable knockdown of CRT suppresses invasion of HTR8/SVneo cells
To investigate the effect of CRT knockdown on invasion of cells, the Matrigel invasion assay was performed. Knockdown of CRT markedly suppressed invasion of HTR8/SVneo cells after 24 hours of incubation [Fig. 3(a)]. The level of invasion of CRT-shRNA2 cells through the Matrigel was significantly suppressed to 11.0% ± 6.2% of that of the control cells. Cell proliferation was slightly suppressed in the CRT-knockdown cells compared with that in the control cells [Fig. 3(b)], although CRT knockdown was suggested to have less of an effect on cell growth at 24 hours after plating the cells.
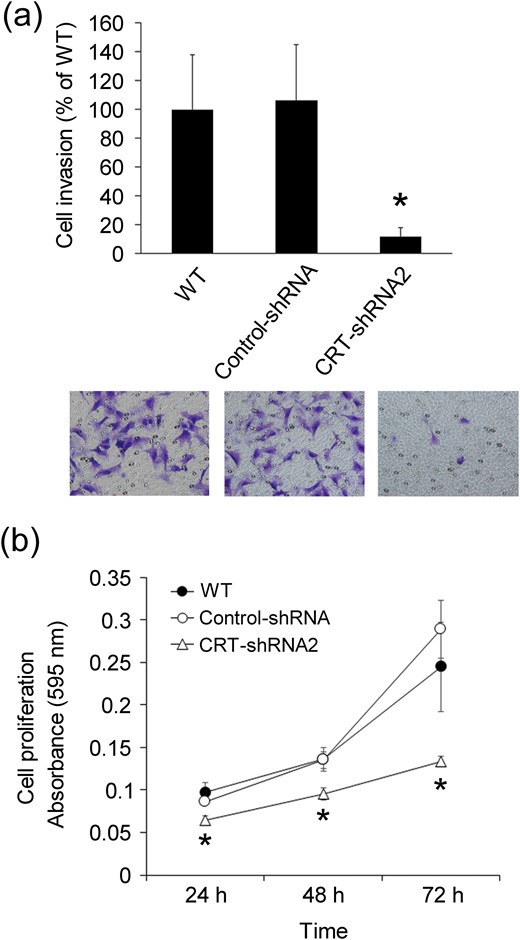
Effects of stable knockdown of CRT expression on Matrigel invasion in HTR8/SVneo cells. (a) Cellular invasion was estimated at 24 hours after plating of WT, control-shRNA, and CRT-shRNA2 cells using the Matrigel invasion assay, as described in Methods. Columns show the mean ± standard deviation of three independent experiments. *P < 0.05 vs control-shRNA. Representative images are shown (bottom). Magnification ×200. (b) Cellular proliferation was estimated photometrically in WT, control, and CRT-knockdown cells by measuring the absorbance at 595 nm, as described in Methods. The cell number was estimated 24, 48, and 72 hours after plating. Data represent the mean ± standard deviation of three independent experiments. *P < 0.05 vs the same time point for control-shRNA.
Transient knockdown of CRT suppresses invasion of HTR8/SVneo cells
To further confirm that CRT is involved in invasion, the Matrigel invasion assay was performed using the cells in which CRT was transiently knocked down by transfection with siRNA for CRT for 48 hours. As shown in Fig. 4(a), CRT protein expression was suppressed in CRT-knockdown cells compared with parental cells or cells transfected with the control RNA. RT-PCR analysis also indicated the downregulation of CRT mRNA expression in CRT-siRNA cells [Fig. 4(b)]. In Fig. 4(c), transient CRT knockdown by siRNA significantly suppressed invasion, consistent with the results obtained from the stable CRT-knockdown cell line [Fig. 3(a)]. Together, these results indicate that CRT expression is involved in the invasive ability of EVTs. Thus, for subsequent experiments, stable CRT-knockdown cells, CRT-shRNA2, were used to explore the function of CRT.

Effects of transient knockdown of CRT expression on Matrigel invasion in HTR8/SVneo cells. (a) HTR8/SVneo cells were transiently transfected for 48 hours with control-siRNA or CRT-siRNA, as described in the Methods section. Next, the level of CRT protein was examined by immunoblot analysis using specific antibodies in WT, control-siRNA, and CRT-siRNA cells. Data represent three independent experiments. The band intensity was quantified as described in Methods. Data are shown as the mean ± standard deviation of three independent experiments. *P < 0.05 vs control-siRNA. (b) The transcriptional level of CRT was examined using RT-PCR in WT, control-siRNA, and CRT-siRNA cells 48 hours after transfection with the siRNAs. The band intensity was quantified as described in Methods. Data are shown as the mean ± standard deviation of three independent experiments. *P < 0.05 vs control siRNA. (c) At 48 hours after transfection with or without control-siRNA or CRT-siRNA, the cells were plated, and the Matrigel invasion assay was performed at 24 hours after plating. Columns show the mean ± standard deviation of three independent experiments. *P < 0.05 vs control-siRNA.
Knockdown of CRT suppresses adhesion to fibronectin
To investigate the effect of CRT knockdown on cellular adhesion to ECM, we performed a cell adhesion assay. Although the control cells spread well on fibronectin-coated dishes in a time-dependent manner, CRT-shRNA2 cells spread poorly on the dishes, and the shape of cells was round-like [Fig. 5(a)]. The ability to attach to fibronectin was suppressed more in CRT-shRNA2 cells than in the control cells [Fig. 5(b)]. In contrast, no significant difference was observed in cell morphology on the collagen IV-coated plates between the control and CRT-shRNA2 cells [Fig. 5(a) and 5(b)].

Effects of CRT expression knockdown on cell adhesion to fibronectin in HTR8/SVneo cells. (a) Cells were seeded in 24-well plates coated with fibronectin or collagen IV and incubated at 37°C for 60 minutes. After removing nonattached cells, the cell morphology was examined using phase-contrast microscopy and photographed. Magnification ×200. (b) The cell adhesion assay was performed as shown in (a). The number of attached cells was estimated photometrically by measuring the absorbance at 595 nm using a microplate reader, as described in the Methods section. The adhesion value of control-shRNA cells at 60 minutes was set as 100%, and the rates of binding to fibronectin and collagen IV were expressed relative to this. Data represent the mean ± standard deviation of three independent experiments. Each rate was compared with that of control-shRNA cells at the indicated incubation time. *P < 0.05 vs the same time point for control-shRNA. (c) Control-shRNA and CRT-shRNA cells were seeded in 48-well plates precoated with fibronectin in the presence or absence of control IgG or inhibitory antibody for integrin β1 and incubated at 37°C for 60 minutes. The number of attached cells was estimated as in (b). The adhesion value of control-shRNA cells at 60 minutes was set as 100%, and the rates of binding to fibronectin were expressed relative to this. Data represent the mean ± standard deviation of three independent experiments. *P < 0.05 vs no antibody. (d) Control-shRNA and CRT-shRNA2 cells were seeded on culture plates precoated with fibronectin and then incubated for 60 minutes. The cell lysate samples were prepared at the indicated times, and the phosphorylation status of Akt (Ser473 or Thr308) and FAK (Tyr397) was examined by immunoblot analysis using specific antibodies. The band intensity was quantified as described in Methods. Data for p-Akt are shown as the mean ± standard deviation of three independent experiments. *P < 0.05 vs the same time point for control-shRNA. GAPDH, glyceraldehyde 3-phosphate dehydrogenase.
Cell adhesion to fibronectin requires counter ligands on the cell surface (23), and integrin α5β1, a ligand for fibronectin, is expressed in HTR8/SVneo cells (24). To investigate whether integrin β1 is involved in cell adhesion to fibronectin, the effect of the inhibitory antibody against integrin β1 on cell adhesion was examined [Fig. 5(c)]. In control-shRNA cells, the adhesion to fibronectin was significantly suppressed by the inhibitory antibody in a dose-dependent manner. In contrast, in CRT-shRNA2 cells, the adhesion to fibronectin was not changed by the inhibitory antibody. These results suggest that the adhesion function of integrin β1 is partly disabled in the CRT-knockdown cells.
Several cell signaling pathways, such as Akt and FAK, are involved in cell motility and invasion during human trophoblast development (25–27). We investigated the effect of CRT knockdown on the phosphorylation status of Akt and FAK on attachment to fibronectin. As shown in Fig. 5(d), the phosphorylation level of Akt (Ser473 and Thr308) was significantly suppressed in CRT-knockdown cells compared with that in the controls. The phosphorylation level of FAK was not increased by attachment to fibronectin in CRT-shRNA2 cells.
Knockdown of CRT affects expression and intracellular localization of integrin β1
Integrin α5β1 is known as a receptor for fibronectin, which is crucial for invasion of trophoblasts into the maternal interstitium (5, 28). We, therefore, investigated how the knockdown of CRT affects integrin α5β1 in HTR8/SVneo cells. In Fig. 6(a), higher molecular forms of integrins β1 and α5 were detected in CRT-shRNA2 cells compared with those in WT and control-shRNA cells. The level of integrin α1 was slightly suppressed in CRT-shRNA2 cells compared with that in the controls. As shown in Fig. 6(b), in WT and control-shRNA cells, immunofluorescent signals of integrin β1 were detected in cytoplasmic and peripheral cell regions, and the cytoplasmic signals overlapped with those for CNX, an ER-resident marker protein. Integrin β1 was localized evenly to the ER and plasma membrane in the control cells. In contrast, the signals of integrin β1 were weaker in the cytoplasm and were mainly detected at the plasma membrane in CRT-shRNA2 cells.

Effects of CRT expression knockdown on expression, intracellular localization, and complex formation of integrins in HTR8/SVneo cells. (a) Expression levels of integrins (β1, α1, and α5) and glyceraldehyde 3-phosphate dehydrogenase (GAPDH) in WT, control-shRNA, and CRT-shRNA2 cells were examined by immunoblot analysis with specific antibodies. The band intensity was quantified as described in the Methods section and indicated as the value relative to the corresponding blot of WT. (b) Intracellular localization of integrin β1 (green) and CNX (red) was examined in WT, control-shRNA, and CRT-shRNA2 cells by immunofluorescence microscopy with specific antibodies. CNX staining was used to indicate the localization of ER. Representative images are shown. Magnification ×630. (c) From the cell lysates of WT, control-shRNA, and CRT-shRNA2 cells, integrin β1 was immunoprecipitated (IP) with the anti-integrin β1 antibody, as described in Methods. The immunoprecipitates were examined by immunoblot analysis using anti-integrin α1 or integrin α5 antibodies. Three independent experiments showed similar results. (d) Intracellular localization of integrin β1 (green) and integrin α5 (red) was examined in WT, control-shRNA, and CRT-shRNA2 cells by immunofluorescence microscopy with specific antibodies. Representative images are shown. Magnification ×630.
Next, we investigated whether knockdown of CRT affects complex formation of integrin α5β1 in the cells. In Fig. 6(c), complex formation of integrins β1 and α5 was observed in both the control and the CRT-shRNA2 cells, and the level of α5 protein, which is associated with β1, showed less of a difference between the control and CRT-shRNA2 cells. In contrast, integrin α1 was not detected in the immunoprecipitates isolated with the anti-integrin β1 antibody. Intracellular localization of integrins β1 and α5 was also examined by immunofluorescence microscopy. In Fig. 6(d), immunofluorescent signals for β1 were colocalized with those for α5 in the control and CRT-shRNA2 cells. Overlapped signals between β1 and α5 were especially increased at the cell peripheral protrusion sites in the CRT-shRNA2 cells compared with control-shRNA cells [Fig. 6(d), arrows]. Taken together, integrin α5β1 showed a modified molecular form after CRT knockdown, and the colocalized complexes between α5 and β1 were increased in the plasma membrane region of the CRT-knockdown cells.
Knockdown of CRT modulates N-glycosylation of integrin β1 in HTR8/SVneo cells
Altered glycosylation of integrin regulates biological function, cell adhesion, and motility (29, 30). A form of integrin β1 with a higher molecular weight was characteristic in CRT-shRNA2 cells [Fig. 6(a)]. Hence, we investigated whether N-glycans contribute to the difference in the molecular size of integrin β1 between control and CRT-knockdown cells. As shown in Fig. 7(a), the molecular size of integrin β1 was reduced by the removal of N-glycans in the control and CRT-shRNA2 cells, and it reached the same molecular size. This indicates that, in the case of integrin β1, the variation in the molecular size resulted from a difference in the structure or number of N-glycans between the control and CRT-shRNA2 cells. To further characterize the change in glycosylation of integrin β1, lectin blot analysis was performed. ConA, DSA, and UEA-1 are reactive with high-mannose–type glycan, galactose-containing glycan (e.g., Gal-β1,4-GlcNAc), and α-1,2-fucosylated glycan, respectively. SSA and MAM are reactive with α-2,6–sialylated glycan and α-2,3–sialylated glycan, respectively. As shown in Fig. 7(b), the reactivity of integrin β1 with DSA was increased in CRT-shRNA2 cells compared with the control cells. In contrast, the reactivity of integrin β1 was decreased with ConA, SSA, and UEA-1 in CRT-shRNA2 cells compared with the controls. The reactivity with MAM was not changed between CRT-shRNA2 and the control cells.

Knockdown of CRT alters N-glycosylation of integrin β1 in HTR8/SVneo cells. (a) The cells (e.g., WT, control-shRNA, and CRT-shRNA2) were treated with peptide N-glycosidase F (PNGase), which cleaves N-glycans from glycoproteins, and the protein extracts were subjected to immunoblot analysis with the anti-integrin β1 antibody, as described in the Methods section. Three independent experiments showed similar results. (b) Integrin β1 was immunoprecipitated from the cell lysates of WT, control-shRNA, and CRT-shRNA2 cells, and the immunoprecipitates were subjected to lectin blot (LB) analysis with ConA, DSA, SSA, MAM, and UEA-1, as described in Methods. The band intensity was quantified as described in Methods and indicated as the value relative to the corresponding blot of WT. (c) Lectin-binding reactivity to the cell surface was analyzed using flow cytometry in WT, control-shRNA, and CRT-shRNA2 cells. Cells were incubated without (gray line) or with biotin-conjugated lectins (i.e., DSA, SSA, MAM, and UEA-1), followed by incubation with DyLight 488–conjugated streptavidin. Next, the cells were subjected to flow cytometric analysis as described in Methods.
Next, to estimate whether the glycan structures of cell-surface glycoproteins are completely affected by knockdown of CRT, flow cytometric analysis was performed. In CRT-shRNA2 cells, the reactivity was increased with DSA but decreased with SSA and UEA-1 compared with that in the controls [Fig. 7(c)]. No change was found in reactivity with MAM between control and CRT-shRNA2 cells. Together, these results indicate that complex type N-glycans with high-level galactose and low-level sialic acid/fucose might be enriched, not only in integrin β1, but also in other cell-surface glycoproteins in the CRT-knockdown cells.
Knockdown of CRT modulates expression of several glycosyltransferases in HTR8/SVneo cells
Several glycosyltransferases, which biosynthesize specific sugar chains in the Golgi apparatus, are involved in the change of N-glycans of integrin β1 (29, 30). We investigated the expression of glycosyltransferases in the control and CRT-knockdown cells. In Fig. 8(a) and 8(b), levels of the protein and transcription of β-1,4-galactosyltransferase-I, which synthesizes DSA-reacting galactose-containing glycan, were both increased in CRT-shRNA2 cells compared with the controls. In the case of α-2,6,-sialyltransferase-I, which synthesizes SSA-reacting sialic acid-containing glycans, the protein level was decreased, but the transcription level was less markedly changed in the CRT-shRNA2 cells. In the case of α-1,2-fucosyltransferase-I, which synthesizes UEA-1–reacting fucose-containing glycans, the protein level was decreased, but the transcription level was less markedly changed in the CRT-shRNA2 cells.
![Knockdown of CRT alters the expression of glycosyltransferases in HTR8/SVneo cells. (a) The protein level of glycosyltransferases [i.e.,β-1,4-galactosyltransferase-I (β4GalT-I), α-2,6,-sialyltransferase-I (ST6Gal-I), and α-1,2-fucosyltransferase-I (FucT-I)] was examined by immunoblot analysis using specific antibodies in WT, control-shRNA, and CRT-shRNA2 cells. The level of glyceraldehyde 3-phosphate dehydrogenase (GAPDH) is shown as a loading control. The band intensity was quantified as described in the Methods section and indicated as the value relative to the corresponding blot of WT. Data are shown as the mean ± standard deviation of three independent experiments.*P < 0.05 vs control-shRNA. (b) The transcription level of glycosyltransferases [i.e., B4GALT1, ST6GAL1, and α-1,2-fucosyltransferase-I (FUT1)] was examined by RT-PCR followed by agarose gel or acrylamide gel electrophoresis in WT, control, and CRT-knockdown cells. The band intensity was quantified as described in Methods and indicated as the value relative to the corresponding glycosyltransferase transcript of WT. Data are shown as the mean ± standard deviation of three independent experiments. *P < 0.05 vs control-shRNA.](https://oup.silverchair-cdn.com/oup/backfile/Content_public/Journal/endo/158/11/10.1210_en.2016-1966/1/m_en.2016-1966f8.jpeg?Expires=1750267619&Signature=xS9mWkfhnFUms0gaNpkKvxwcoFRa-aGESV3R3jC4O4oK93bYRl6Se-Rk~BD7iN2tMQXdldwKEtEBi6QeM5YE4KEH5ShHnNO1jwLmTky7YYzpxyT9zNGRKZ1rLZsQk~vtfAsPoR0raguktcQMLSnZ9DRTtjVno8qidl63wgYpnCGF9z~EOIEjds6L1105sloAiADp7PDaRk-l8wSLOTfe9TFm7Nw-OW1FulyvdUdh3DdR-nh3JTf5bGOwwF9JkvrGlFSFO0hyrEExVuoBUsOK~Y2lMA1x4ZskiuubN9kmWM96uUCwaMEOYin~cexI480~OMhrw87EfW0ZnRE-sxVJag__&Key-Pair-Id=APKAIE5G5CRDK6RD3PGA)
Knockdown of CRT alters the expression of glycosyltransferases in HTR8/SVneo cells. (a) The protein level of glycosyltransferases [i.e.,β-1,4-galactosyltransferase-I (β4GalT-I), α-2,6,-sialyltransferase-I (ST6Gal-I), and α-1,2-fucosyltransferase-I (FucT-I)] was examined by immunoblot analysis using specific antibodies in WT, control-shRNA, and CRT-shRNA2 cells. The level of glyceraldehyde 3-phosphate dehydrogenase (GAPDH) is shown as a loading control. The band intensity was quantified as described in the Methods section and indicated as the value relative to the corresponding blot of WT. Data are shown as the mean ± standard deviation of three independent experiments.*P < 0.05 vs control-shRNA. (b) The transcription level of glycosyltransferases [i.e., B4GALT1, ST6GAL1, and α-1,2-fucosyltransferase-I (FUT1)] was examined by RT-PCR followed by agarose gel or acrylamide gel electrophoresis in WT, control, and CRT-knockdown cells. The band intensity was quantified as described in Methods and indicated as the value relative to the corresponding glycosyltransferase transcript of WT. Data are shown as the mean ± standard deviation of three independent experiments. *P < 0.05 vs control-shRNA.
Discussion
The ER-resident molecular chaperone CRT plays a variety of roles in cell growth, differentiation, apoptosis, immunity, and cancer biology (17, 31, 32). A previous study showed that CRT was expressed in the human placenta (18). Gu et al. (19) showed that CRT was significantly increased in the maternal blood from pregnant women compared with that in nonpregnant women. In terms of the relation of CRT with PE in gestation, CRT in the serum was higher in patients with PE than that in normal pregnancy (19). In contrast, Shi et al. (33) reported that CRT expression is increased in the placental tissues of PE, which were obtained at delivery during late pregnancy. These findings suggest that placental CRT might be involved in pregnancy in both physiological and pathological states. However, the expression and function of placental CRT during placental development in early pregnancy have yet to be investigated. In the present study, we have demonstrated that CRT is highly expressed in the placenta of normal pregnancy during the first trimester, and CRT is localized to EVTs invading the maternal decidua. Thus, we investigated the physiological functions of CRT in EVTs during placental development using human EVT-derived HTR8/SVneo cells in the experiments.
In the present study, we have demonstrated that CRT knockdown markedly suppresses the invasion ability of HTR8/SVneo cells. EVTs during placental development in early pregnancy facilitate invasion by the alteration of integrin phenotypes, the downregulation of E-cadherin, and the increased production of proteases such as matrix metalloproteinase and serine proteases (34, 35). In terms of regulatory molecules for cell invasion, no significant change was observed in the expression of vascular endothelial cadherin or in the activity for matrix metalloproteinases 2 and 9 in the CRT-knockdown cells compared with the controls (data not shown). In contrast, adhesion to fibronectin was suppressed in the CRT-knockdown cells via the dysfunction of integrin α5β1. These results showed that CRT expression is required for the invasion ability of EVTs, suggesting the physiological importance of CRT in the early phase of placental development.
It has been reported that overexpression of CRT contributes to metastasis in a variety of cancer cells, suggesting that it plays a functional role in cell adhesion and migration in cancer (36, 37). Cell–extracellular matrix adhesion, such as focal-contact adhesion, is critically involved in the mechanisms of cancer metastasis, fibrosis, and wound healing (38, 39). Several mechanisms have been postulated for CRT-dependent regulation of the focal adhesions (40). It was reported that CRT regulates focal adhesion or migration with activation of integrins via direct interaction between CRT and integrin-α subunits in the cytoplasm in various types of cells (41, 42), although it is still controversial how CRT works in the cellular cytosol (31, 32). Our previous study showed that the overexpression of CRT enhances integrin α5β1-dependent cell adhesion to fibronectin and the downstream signaling in epithelial–mesenchymal transitionlike MDCK cells established by transfection with the CRT-gene expression vector (43).
Other mechanisms have also been proposed, in which CRT regulates the focal adhesions by upregulating the expression of integrin-targeting ECM proteins, such as fibronectin, collagen I, or collagen IV (44, 45). Furthermore, CRT contributes to the regulation of focal adhesions via the upregulated expression of vinculin, a focal adhesion-related cytoskeletal protein (46). In contrast, extracellular CRT interacts with various proteins such as integrins, laminin, and thrombospondin-1 to regulate the formation and disassembly of focal adhesions (31, 47). Together, results from the present and previous studies strongly suggest that CRT has a regulatory role in focal adhesions, cellular migration, and invasion through its action on integrin-related adhesion and signaling machineries by multiple methods.
Various secretory and membrane glycoproteins, such as growth factors, membrane receptors, adhesion molecules, and matrix metalloproteases, are produced and quality controlled in the ER and play important roles for trophoblast functions in placental development (48, 49). Thus, these findings suggest that CRT functions in the ER are critical for the regulation of placental development during early pregnancy. In contrast, the expression pattern of integrins in first-trimester cytotrophoblasts changes dramatically during their differentiation along the invasive pathway (3). Furthermore, glycosylation of human trophoblast integrins is altered in placentation in a stage-specific manner (50). Together, these findings suggest that N-glycosylation of integrins has a specific regulatory role for first-trimester placentation.
It is known that the N-glycosylation of integrins influences the integrin functions in cell adhesion, migration, and invasion (30). N-glycosylation of both α5 and β1 subunits plays a pivotal role in subunit heterodimerization, expression, and biological functions of integrin α5β1 (51–53). Moss et al. (50) demonstrated that N-glycans of integrin α5β1 consist of at least triantenna and short, sialylated lactosamine units and are not extensively fucosylated in first-trimester human cytotrophoblasts. In HTR8/SVneo cells, the N-glycan structures of integrin α5β1 are likely similar, in part, to those from first-trimester cytotrophoblasts. We demonstrated that the N-glycan structure of integrin β1 was markedly changed by CRT knockdown; however, the cell-surface expression or complex formation of integrin α5β1 was not affected. Furthermore, in the case of CRT-knockdown cells, the high-mannose–type structure (i.e.,α-mannose reacting with ConA), sialylation (i.e.,α-2,6-sialic acid reacting with SSA), and fucosylation (i.e.,α-1,2-fucose reacting with UEA-1) decreased and the galactose-containing lactosamine structure (i.e., Gal-β1,4-GlcNAc structure reacting with DSA) increased in the N-glycans of integrin β1. In contrast, N-glycans of integrin α5 were reactive to SSA and DSA but not UEA-1. However, the reactivity to SSA and DSA was less markedly changed between the control and CRT-knockdown cells (data not shown). These results indicate that N-glycosylation is mainly altered in integrin β1 and might be involved in the mechanism of suppressed interaction between integrin α5β1 and fibronectin.
Various studies have reported that sialylation, the galactose-containing structure, and fucosylation of N-glycans are involved in cellular invasion by modulating the function of integrin β1. Reduced adhesion to fibronectin and laminin was observed in nonmetastatic mutants of B16F1 melanoma cells, in which sialylation was markedly decreased in the N-glycans of integrin β1 (54). In addition to our results, these results suggest that sialylated N-glycans play a positive role in the integrin α5β1-dependent adhesion to fibronectin, leading to enhanced cellular invasion or migration. However, conflicting results have also been reported in myeloid (55–57) and breast cancer (58) cells. The adhesion to fibronectin might be controlled through, not only sialylation on integrin β1, but also other N-glycan structures (e.g., galactosylation, fucosylation, and a variety of branching structures).
In the case of the galactose-containing structure of N-glycans of integrin β1, Liao et al. (59) reported that the upregulated expression of the β-1,4-galactosyltransferase (B4GALT3) gene suppressed migration and invasion by upregulating DSA-reacting galactose-containing N-glycans in integrin β1 in HTR8/SVneo cells (59). In the present study, B4GALT3 expression was less markedly changed in the CRT-knockdown cells (data not shown) but B4GALT1 expression was transcriptionally increased. This result was consistent with the finding that DSA-reacting galactose-containing glycans are increased in CRT-knockdown cells. Thus, increased galactose-containing N-glycans of integrin β1 might be involved in the suppressed integrin α5β1-dependent adhesion to fibronectin in the CRT-knockdown cells, although, at present, it is unclear how the B4GALT1 gene transcript was upregulated in the CRT-knockdown cells.
Recently, Lu et al. (60) have reported that CRT promotes the activities of integrin β1 through formation of α-1,2-fucosylated N-glycans in bladder cancer cells. In the regulatory mechanism, they showed that the mRNA stability of the α-1,2-fucosyltransferase-I (FUT1) gene transcript is positively controlled by CRT, leading to an increase in the α-1,2-fucosylation level in integrin β1. In CRT-knockdown HTR8/SVneo cells, the expression of both α-1,2-fucosyltransferase-I and the UEA-1–reacting α-1.2-fucosylated integrin β1 were decreased, suggesting that decreased adhesion to fibronectin might be due, in part, to the suppressed fucosylation of integrin β1.
In the present study, we investigated the expression of several critical glycosyltransferases, which are responsible for the specific sugar chain structures in CRT-knockdown HTR8/SVneo cells. Consequently, the expression of α-2,6-sialyltransferase-I and α-1,6-fucosyltransferase-I was decreased; however, the expression of β-1,4-galactosyltransferase-I was increased in the cells. The expression balance of such glycosyltransferases is consistent with the changes in the N-glycans of integrin β1 in the CRT-knockdown cells. The precise mechanism whereby the sugar-chain structures influence the biological functions of integrins is unclear; however, conformational changes in the functional regions of the subunits might be involved in the regulation of integrin functions. Also, the expression of α-2,6-sialyltransferase-I and α-1,6-fucosyltransferase-I was downregulated independently of the transcription levels, but the expression of β-1,4-galactosyltransferase-I was transcriptionally upregulated in CRT-knockdown HTR8/SVneo cells. Hence, various indirect mechanisms might be involved in the regulation of the altered N-glycan structure of integrin β1 in the CRT-knockdown cells. The maturation processes of various N-glycosylated proteins, such as integrins and glycosyltransferases, are suggested to be disturbed in the ER and Golgi by knockdown of CRT. It is not yet known whether epigenetic or translational mechanisms are also involved or used in CRT-dependent cellular functions.
It has been reported that cell migration is suppressed in HTR8/SVneo cells by adding exogenous CRT in serum-free culture media, suggesting that an elevated level of CRT in serum might be involved in the pathology of PE (61). Possible functions of extracellular CRT have also been suggested, including the formation and disassembly of focal–adhesion contacts through direct interactions with integrin α2β1, laminin, thrombospondin-1, or low-density lipoprotein–related receptor 1 (31, 47). These might be involved in the mechanism by which extracellular CRT suppresses HTR8/SVneo cell migration. In contrast, in the present study, the level of CRT secreted in culture media was decreased in CRT-knockdown HTR8/SVneo cells compared with that of the controls (data not shown). Hence, the level of endogenous CRT in the ER also plays a key role in the regulation of HTR8/SVneo cell migration, and the mechanism with CRT is likely autonomous in EVTs. Collectively, endogenous and exogenous CRT seems to have opposite functions in the migration machinery of HTR8SVneo EVT cells via distinct mechanisms. This suggests that CRT is a multifunctional regulatory protein involved in the normal physiology and pathology of the placenta. It would be interesting to clarify the differential functions between intracellular and extracellular CRT in trophoblasts and its relation to PE. In addition, the origin of extracellular CRT remains elusive.
Recently, it was reported that CRT expression is increased in the placental tissues of PE obtained at delivery during late pregnancy (33). Furthermore, overexpression of CRT induces apoptosis and impairs cellular invasion in vitro in JEG-3 choriocarcinoma cells, although the precise molecular mechanisms are unclear (33). Although the results suggest that a high level of CRT might have a suppressive function on cell invasion of trophoblasts, the gene expression profile of JEG-3 cells is quite different from that of HTR8/SVneo EVT cells or primary human EVTs (62). Thus, it would be difficult to compare the functions of CRT between the two cell lines.
Collectively, the present study has demonstrated that the ER chaperone CRT plays a regulatory role in the invasion ability of EVTs, suggesting the importance of CRT expression in placental development during early pregnancy. In the mechanism, CRT controls the cell invasion ability through the regulation of maturation processes of various N-glycosylated proteins [Fig. 9(a)]. Under conditions with CRT knockdown, cell invasion ability was suppressed by decreased cell adhesion through dysfunction of integrins with altered N-glycosylation [Fig. 9(b)]. Identifying the mechanism by which CRT is downregulated in early pregnancy might lead to elucidation of the pathogenesis of PE. In human embryonic kidney or hepatoma cell lines, tumor necrosis factor-α, an inflammatory cytokine, leads to reduction in the CRT transcript levels (63). In our preliminary experiments, tumor necrosis factor-α treatment induced a decrease in CRT mRNA expression in HTR8/SVneo cells (data not shown). Abnormal inflammation in the fetomaternal environment might be related to the downregulation of CRT, leading to the pathogenesis of PE. Further investigation is required to clarify how CRT plays a role in the pathogenesis of PE.

Hypothetical scheme of CRT functions in HTR8/SVneo cell invasion. (a) In HTR8/SVneo cells, CRT controls cell invasion ability through the regulation of maturation processes of various N-glycosylated proteins such as integrins. (b) In CRT-knockdown cells, N-glycans of integrin β1 are altered, leading to dysfunction of integrins. As a result, cell adhesion is decreased, which contributes to the suppression of cell invasion.
Abbreviations:
- B4GALT
β-1,4-galactosyltransferase
- CNX
calnexin
- ConA
concanavalin A
- control-shRNA
small hairpin RNA transfected with the control vector
- CRT
calreticulin
- CRT-shRNA
small hairpin RNA for calreticulin
- CRT-siRNA
small interfering RNA targeting human calreticulin messenger RNA
- DSA
Datura stramonium agglutinin
- ECM
extracellular matrix
- ER
endoplasmic reticulum
- EVT
extravillous trophoblast
- FAK
focal adhesion kinase
- FCS
fetal calf serum
- IgG
immunoglobulin G
- MAM
Maackia amurensis
- mRNA
messenger RNA
- PBS
phosphate-buffered saline
- PE
preeclampsia
- RT-PCR
reverse transcription polymerase chain reaction
- SDS
sodium dodecyl sulfate
- siRNA
small interfering RNA
- SSA
Sambucus sieboldiana agglutinin
- UEA-1
Ulex europaeus
- WT
wild-type.
Acknowledgments
We thank Dr. Yoko Inai for her technical support.
Financial Support: This work was supported by Ministry of Education, Culture, Sports, Science and Technology Grants-in-Aid for Scientific Research Grant JP15K20156.
Disclosure Summary: The authors have nothing to disclose.
References
