


Cancer-associated fibroblasts (CAFs) play a vital role in malignant transformation and progression of prostate cancer (PCa), and accumulating evidence suggests an enhancing effect of estrogens on PCa. The present study aimed to investigate the possible origin of prostate CAFs and the effects of estrogen receptors, G protein-coupled receptor 30 (GPR30) and estrogen receptor (ER)-α, on stromal cell activation. High expression of fibroblast activation protein (FAP), CD44, and nonmuscle myosin heavy chain B (SMemb) accompanied by low expression of smooth muscle differentiation markers was found in the stromal cells of PCa tissues and in cultured human prostate CAFs. Additionally, SMemb expression, which is coupled to cell phenotype switching and proliferation, was coexpressed with FAP, a marker of activated stromal cells, and with the stem cell marker CD44 in the stromal cells of PCa tissue. Prostate CAFs showed high GPR30 and low ERα expression. Moreover, GPR30 was coexpressed with FAP, CD44, and SMemb. Furthermore, the study demonstrated that the overexpression of GPR30 or the knockdown of ERα in prostate stromal cells induced the up-regulation of FAP, CD44, Smemb, and the down-regulation of smooth muscle markers. The conditioned medium from these cells promoted the proliferation and migration of LNCaP and PC3 PCa cells. GPR30 knockdown or ERα overexpression showed opposite effects. Finally, we present a novel mechanism whereby GPR30 limits ERα expression via inhibition of the cAMP/protein kinase A signaling pathway. These results suggest that stem-like cells within the stroma are a possible source of prostate CAFs and that the negative regulation of ERα expression by GPR30 is centrally involved in prostate stromal cell activation.
Although the vast majority of adenocarcinomas stem from the epithelial compartment, there is evidence indicating that tumorigenesis is not merely determined by the malignant cancer cells themselves but also by the tumor stroma (1–3). Carcinomas with abundant stroma show higher malignant degrees (4, 5), and cancer-associated fibroblasts (CAFs), which constitute most tumor stroma, are prominent modifiers of cancer initiation and progression. In a tissue recombination model, CAFs established from prostate cancer (PCa) tissue have been shown to induce human benign prostatic hyperplasia epithelial cell line (BPH-1) to form tumors (2), and CAFs show a vital role in extracellular matrix remodeling and promoting cancer cell survival, proliferation and invasion (6–8).
CAFs are broadly defined as all fibroblast cells within the tumor-associated stroma, thus including fibroblasts and myofibroblasts (9). The origin of CAFs has been extensively investigated, and they have been shown to originate from different components. The most immediate source are resident fibroblasts (9). Smooth muscle cells (SMCs) are a plausible second source because the tumor stroma undergoes a progressive loss of SMCs in parallel to the appearance of CAFs (10, 11). According to other reports, CAFs originate from mesenchymal stem cells or other mesenchymal cell types within the tumor such as vascular smooth muscle cells, pericytes, or adipocytes, which transdifferentiate into CAFs (12–14). Finally, epithelial cells, which have undergone epithelial-to-mesenchymal transition, may also serve as a source of CAFs (4). Inconsistencies between these reports call for greater efforts in elucidating the source and inductors of CAFs.
In addition, the factor(s) responsible for stromal cell activation are not completely known. In prostatic carcinogenesis sex hormones play a pivotal role (15, 16), and accumulating evidence suggests that androgens and also estrogens participate in PCa progression (2, 17). The biological effects of estrogens are mainly mediated through estrogen receptors. Estrogen receptor (ER)-α and ERβ are ligand-inducible transcription factors belonging to the nuclear receptor superfamily and mediate classical estrogen actions. In addition, G protein-coupled receptor 30 (GPR30), also called G protein-coupled estrogen receptor, an orphan receptor, has been recently discovered to be involved in mediating some estrogen actions, in particular the nongenomic ones (18). Estrogen actions reported in stromal cells are mainly mediated by ERα and GPR30. Previous studies reported that estradiol (E2) regulates matrix metalloproteinase (MMP)-2 expression and enolase 1 secretion through ERα in prostate stromal WPMY-1 cells (19, 20). Another study showed ERα regulates thrombospondin 2 expression in CAFs and thereby decreases the invasive capability of PCa cells (21). In breast cancer CAFs, E2, and the GPR30-selective ligand G-1 up-regulated connective tissue growth factor and vascular endothelial growth factor in a GPR30-dependent manner (22, 23). Both, ERα and GPR30 have been reported to be involved in SMC differentiation in several tissue types (24, 25).
In this study, we investigated the possible origin of CAFs in PCa. We studied the contribution of GPR30 and ERα on phenotypic changes of stromal cells and on PCa cell proliferation and migration. Furthermore, we demonstrated the interconnected regulation between GPR30 and ERα and described the molecular mechanism thereof.
Materials and Methods
Cell culture and treatment
Primary human prostate normal fibroblasts (NAFs) established from normal prostate tissue and prostate CAFs established from prostate tumor tissue were obtained from the Department of Urology, Medical University of Innsbruck (Innsbruck, Austria). The primary stromal cells were isolated from prostate cancer patients undergoing radical prostatectomy after diagnosis of PCa according to the procedure described previously (26, 27). The use of prostate tissue samples was approved by the Ethics Committee of the Medical University of Innsbruck. Three pairs of primary NAFs/CAFs and one pair of human telomerase reverse transcriptase (hTERT)-immortalized NAFs/CAFs (11) were used in the experiments. The NAFs/CAFs were routinely maintained in DMEM phenol red-free medium (Sigma-Aldrich) supplemented with 100 U/mL penicillin/streptomycin (P/S; Invitrogen) and 10% fetal bovine serum (FBS; Invitrogen) at 37°C under 5% CO2. The human prostate stromal cell line WPMY-1, which was derived from normal stromal cells of the peripheral zone in the adult prostate and defined as myofibroblasts (28), was obtained from the American Type Culture Collection. These cells were maintained in DMEM phenol red-free medium supplemented with P/S and 5% FBS. WPMY-1 cells were treated with vehicle (dimethylsulfoxide [DMSO]) or 1 μM of the adenylyl cyclase agonist forskolin (FSK; Beyotime) for 24 hours. Then cells were collected and lysed for protein extraction. The human PCa cell lines LNCaP and PC3 were obtained from the American Type Culture Collection. All PCa cell lines were grown in RPMI 1640 phenol red-free medium (Sigma) supplemented with P/S and 10% FBS.
Plasmids and small interfering RNA (siRNA) transfection
Human cDNA fragments encoding GPR30 and ERα were PCR amplified from reverse transcribed WPMY-1 cell total RNA. Red fluorescence protein (RFP) cDNA was amplified from plasmid pDsRed-N1. The resulting cDNA fragments were cloned into the PLenti6.4-R4R2-V5-Dest vector to generate RFP, GPR30, and ERα expression constructs. The three expression plasmids were transfected into WPMY-1 cells using Lipofectamine 3000 reagent (Invitrogen). Transfected cells, labeled as WPMY1-RFP/GPR30/ERα, were harvested 72 hours after transfection for RNA or protein extraction.
siRNAs targeting GPR30 or ERα and a negative control siRNA that did not match any known human cDNA were purchased from GenePharma. The sequences used were 5-GCUGUACAUUGAGCAGAAATT-3 (forward) and 5-UUUCUGCUCAAUGUACAGCTT-3 (reverse) for GPR30, 5-UCAUCGCAUUCCUUGCAAATT-3 (forward) and 5-UUUGCAAGGAAUGCGAUGATT-3 (reverse) for ERα, and 5-UUCUCCGAACGUGUCACGUTT-3 (forward) and 5-ACGUGACACGUUCGGAGAATT-3 (reverse) for the negative control siRNA. A second pair of siRNAs was used to exclude off-target effects (see Supplemental Materials for these siRNA sequences and Supplemental Figure 1 for the knockdown verification). WPMY-1 cells and immortalized NAFs/CAFs were transfected with the corresponding siRNA using Lipofectamine 3000 reagent (Invitrogen) according to the manufacturer's instructions. For treatment, the transfected cells were incubated with 2 μM protein kinase A (PKA) inhibitor H89 (Beyotime) in DMSO or an equivalent amount of the solvent. Cells were collected for RNA or protein extraction 72 hours after transfection.
Preparation of conditioned medium (CM)
Prostate stromal cells were transfected with expression plasmids or siRNA in DMEM with 5% FBS for 24 hours. Afterward the media were changed to DMEM with 2% FBS. After a further 48 hours, media were collected, centrifuged at 400 × g for 5 minutes to remove the floating cells, and used immediately or frozen at −20°C until use. The CM volumes were normalized to cell numbers.
Real-time RT-PCR assay
Total RNA was extracted using Trizol reagent (Invitrogen). Reverse transcription was performed as described previously (24). SYBR Green I-based real-time quantitative PCR was performed on an MJ Research DNA engine Opticon continuous fluorescence detection system (Opticon Monitor II; MJ Research, Inc). Specific primer pairs are listed in Table 1. The relative gene expression was determined using the comparative CT method and normalized to the housekeeping gene hypoxanthine phosphoribosyltransferase 1 (HPRT).
Nucleotide Sequence of Primers Used in Real-Time RT-PCR
| Gene Name | Primer Sequences (5′–3′) | Annealing Temperature, °C | Product Size, bp |
|---|---|---|---|
| α-SMA | Forward, GGGACATCAAGGAGAAACTG | 56 | 219 |
| Reverse, TGATGCTGTTGTAGGTGGTT | |||
| Calponin | Forward, TTGAGGCCAACGACCTGTTT | 56 | 137 |
| Reverse, TTTCCGCTCCTGCTTCTCTG | |||
| CD44 | Forward, TCCAACACCTCCCAGTATG | 58 | 149 |
| Reverse, TTCTGGACATAGCGGGTG | |||
| ERα | Forward, GGACCATATCCACCGAGTCCTG | 56 | 348 |
| Reverse, GCCTCCCCCGTGATGTAATAC | |||
| FAP | Forward, CCCTGCGTATGTAGGTCC | 60 | 175 |
| Reverse, TGTCTGCCAGTCTTCCCT | |||
| GPR30 | Forward, TTGTGGGCAACATCCTGA | 56 | 252 |
| Reverse, CGATGTAGCGGTCGAAGC | |||
| HPRT | Forward, TGACACTGGCAAAACAATGCA | 56 | 94 |
| Reverse, GGTCCTTTTCACCAGCAAGCT | |||
| MYH11 | Forward, AGAAGCCAGGGAGAAGGAAACCAA | 68 | 131 |
| Reverse, TGGAGCTGACCAGGTCTTCCATTT | |||
| SM22α | Forward, GGTTAGGCCAAGGCTCTACTGT | 56 | 184 |
| Reverse, GGGCCACACTGCACTATGAT | |||
| SMemb | Forward, TCTTGGGATGAATGTGATG | 56 | 172 |
| Reverse, ATTGATGCGATGAACGAG |
Abbreviation: HPRT, hypoxanthine phosphoribosyltransferase 1.
Western blot assay
Cells were lysed with radioimmunoprecipitation assay buffer to extract the total protein. Protein was quantified using the bicinchoninic acid method. Equal amounts of proteins were separated by SDS-PAGE and then transferred to a polyvinyl difluoride membrane. The membrane was blotted with primary antibodies and secondary antibodies (goat antirabbit or goat antimouse horseradish peroxidase conjugated, 1:5000; Bio-Rad Laboratories). The primary antibody dilutions used are given in Table 2. After the treatment with enhanced chemiluminescence reagent (Pierce), the membrane was exposed to an x-ray film (Kodak) and ImageJ software (National Institutes of Health, Bethesda, Maryland) used for densitometry quantification.
Antibody Table
| Peptide/Protein Target | Antigen Sequence (if Known) | Name of Antibody | Manufacturer, Catalog Number, and/or Name of Individual Providing the Antibody | Species Raised (Monoclonal or Polyclonal) | Dilution Used |
|---|---|---|---|---|---|
| α-SMA | α-smooth muscle actin | Boster, BM0002 | Mouse monoclonal | 1:100 (IHC) 1:300 (WB) | |
| β-Actin | β-Actin | Boster, BM0627 | Mouse monoclonal | 1:400 (WB) | |
| Calponin | Calponin 1 | Santa Cruz Biotechnology, sc-58707 | Mouse monoclonal | 1:100 (IHC) 1:400 (WB) | |
| CD44 | CD44 | Abcam, ab51037 | Rabbit monoclonal | 1:100 (IHC/IF) 1:2000 (WB) | |
| CD44 | CD44 | Cell Signaling, 3570 | Mouse monoclonal | 1:100 (IF) | |
| ERα | Amino acids 1–300 | ERα | Abcam, ab108398 | Rabbit monoclonal | 1:100 (IHC/IF) 1:1000 (WB) |
| FAP | Fibroblast activation protein, α | Abcam, ab53066 | Rabbit polyclonal | 1:100 (IHC/IF) 1:500 (WB) | |
| FAP | FAP | Santa Cruz Biotechnology, sc-65398 | Mouse monoclonal | 1:100 (IF) | |
| GPR30 | Amino acids 307–375 | GPR30 | Abcam, ab154069 | Rabbit polyclonal | 1:100 (IHC/IF) 1:1000 (WB) |
| MYH11 | MYH11 | Santa Cruz Biotechnology, sc-6956 | Mouse monoclonal | 1:100 (IHC) 1:500 (WB) | |
| SM22α | N-terminus amino acids 16–90 | Transgelin | Santa Cruz Biotechnology, sc-50446 | Rabbit polyclonal | 1:100 (IHC) 1:300 (WB) |
| SMemb | Nonmuscle myosin heavy chain | Yamasa, 7602 | Mouse monoclonal | 1:1000 (IHC/IF) 1:2000 (WB) |
Abbreviation: WB, Western blot.
Cell proliferation assay
For quantitative proliferation assay, 20 000 PCa cells suspended in complete medium were seeded in 24-well plates together with an equal volume of CM. All treatments were repeated three times. For the determination of cell numbers after 24, 48, 72, and 96 hours, respectively, cells were trypsinized and counted using a hemacytometer.
Transwell migration assay
PCa cells were seeded in Transwell inserts with 8 μm pore size (BD Biosciences) at 20 000 cells per well in DMEM/F12 serum-free medium with 10 ng/mL mitomycin C to inhibit cell growth. CMs were added to the bottom chamber. After 24 hours, cells on the upper surface of the filter were removed using a cotton swab. Cells that had migrated through the filter to the lower surface were fixed with 4% paraformaldehyde and stained with 0.5% crystal violet. Cells were counted from five randomly selected fields per chamber.
Wound-healing assay
PCa cells were seeded in equal numbers in six-well plates. Once 90% confluent, the medium was changed to DMEM/F12 serum-free medium for 24 hours. Then three vertical wounds per well were scratched using a 10-μL pipette tip and cells incubated with the indicated CM from prostate stromal cells supplemented with 10 ng/mL mitomycin C to inhibit cell growth. Images were collected at the designated time thereafter at 100-fold magnification to assess wound closure.
Histological and immunohistochemical studies
PCa (seven patients who underwent radical prostatectomy for prostate carcinoma, Gleason 4+3 = 7) and normal prostate (six autopsy cases of patients who died due to illness other than malignancy) tissues were obtained from the Department of Pathology and the Department of Urology, the Second Affiliated Hospital of Tianjin Medical University (Tianjin, China). Use of the tissue samples in this study was approved by the institutional review board. Hematoxylin and eosin (HE) staining and immunohistochemical (IHC) staining were carried out as previously described (29). Briefly, 5-μm sections were deparaffinized in xylene and rehydrated in a graded series of alcohol. One section was HE stained for histological examination, and the other sections were processed for immunohistochemistry using the avidin-biotin-peroxidase complex method. The poach method with citrate buffer (pH 6.0) was used for antigen retrieval. Sections were incubated with the primary antibodies in 10% bovine serum in PBS overnight at 4°C, followed by the respective biotinylated secondary antibodies and horseradish-peroxidase streptavidin. Primary antibody dilutions used are given in Table 2. The stained slides were mounted and visualized in the bright field with an Olympus CX41 microscope. Pictures were obtained using a magnification of ×200. Positively stained cells were counted in at least nine randomly selected microscopic fields and the mean values were calculated.
Immunofluorescence (IF) double-staining assay
Before blocking of paraffin sections with 10% normal bovine serum in PBS, the poach method with citrate buffer (pH 6.0) was performed for antigen retrieval. Then sections were incubated with two types of primary antibodies at 4°C overnight using antibody dilutions specified in Table 2. Sections were subsequently washed and incubated with Alexa Flour 594 anti-mouse IgG (1:500 dilution; Invitrogen) and Alexa Flour 488 anti-rabbit IgG (1:1000 dilution; Invitrogen) for 1 hour at room temperature, and the DNA of cell nuclei was counterstained with 4′,6′-diamino-2-phenylindole (DAPI; 1:100 dilution; Roche; 236276). The sections were then analyzed with a confocal laser-scanning microscope. The mean fluorescence intensity (MFI) in the stromal compartment was quantified with Photoshop software. At least nine randomly selected microscopic fields were analyzed, and the mean values were calculated.
cAMP measurement
WPMY-1 cells were transfected with plasmids or siRNA as described above. Forty-eight hours after transfection, cells were rinsed once with PBS and lysed. As positive control, WPMY-1 cells were treated with DMSO or 1 μM FSK for 10 minutes. The lysates were subsequently collected and subjected to a cAMP luminescence assay according to the manufacturer's instruction (cAMP-Glo assay, V1501; Promega).
Statistical analysis
Data are expressed as the mean ± SD. Significance was assessed using a Student's paired t test. P < .05 was considered as significant.
Results
Increasing number of nonmuscle myosin heavy chain B (SMemb)-positive stem-like cells accompanies a decrease of SMCs in PCa stroma
To better understand the phenotypic characteristic of activated stromal cells in human PCa, PCa tissues were compared with normal prostate (NP) tissues by IHC. The well-established activated fibroblast marker fibroblast activation protein (FAP) (6, 30) was specifically detected in PCa stroma with a positive rate of 65.9% ± 7.5%, whereas no positive staining was detected in NP stroma. Moreover, the positive rate of CD44, a marker of prostate-resident mesenchymal stem cells (31), was 26.5% ± 7.5% in PCa stroma in contrast to only 1.8% ± 0.5% in the NP stroma. Whereas 92.7% ± 5.2% of PCa stromal cells stained positive for α-smooth muscle actin (α-SMA), the positive cells exhibited lower immunostaining intensity compared with NP stroma. The positive rates of smooth muscle (SM) differentiation markers SM22α, calponin, and MYH11 in PCa stroma (30.5% ± 4.2%, 25.7% ± 6.4%, and 21.3% ± 7.5%, respectively) were much lower than in the NP stroma (93% ± 5.7%, 85.5% ± 6.3%, and 93.7% ± 4%, respectively), whereas the SMemb, a marker indicating the cell phenotype switch, increased from 0.3% ± 0.2% in the NP stroma to 25.2% ± 7.1% in the PCa stroma (Figure 1, A and B).
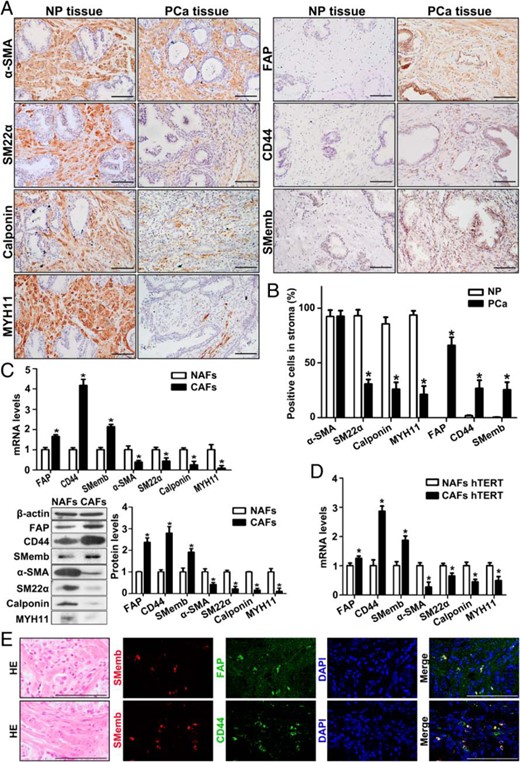
Increased SMemb-positive stem-like cells and decreased SMCs in PCa stroma. A, IHC analysis of SM differentiation markers and FAP, CD44, and SMemb expression in human NP and PCa tissue. Bar, 100 μm. B, Mean (SE) percentage of stromal area per high-power field (n = 9) stained positive for FAP, CD44, Smemb, and SM differentiation markers in NP (n = 6) and PCa (n = 7) tissue. *, P < .05, PCa vs NP. C, Real-time RT-PCR and Western blot analysis of FAP, CD44, Smemb, and SM differentiation markers expression at mRNA (upper panel) and protein level (lower panel) in primary NAFs and CAFs. ImageJ software (National Institutes of Health) was used for densitometric quantification of proteins. Results are presented as mean ± SD (n = 3). *, P < .05, CAFs vs NAFs. D, Real-time RT-PCR analysis of FAP, CD44, Smemb, and SM differentiation markers expression in hTERT-immortalized NAFs and CAFs. Results are presented as mean ± SD (n = 3). *, P < .05, CAFs vs NAFs. E, Serial sections from each group were analyzed by HE staining and double-IF staining of SMemb with FAP or SMemb with CD44 in PCa tissue. Cell nuclei were counterstained with DAPI (blue). Bar, 100 μm.
In addition, basal expression levels of these markers were measured in primary human prostate NAFs and CAFs. Consistent with tissue IHC, a 1.66-, 4.17-, and 2.15-fold increase of FAP, CD44, and SMemb mRNA expressions, respectively, were observed in CAFs compared with NAFs by real-time RT-PCR. These changes were accompanied by a 2.56-, 2.28-, 4-, and 11.1-fold decrease in α-SMA, SM22α, calponin, and MYH11 mRNA expression, respectively (Figure 1C, upper panel). Comparable changes of these markers were also observed at the protein level via Western blotting (Figure 1C, lower panel). These differences in gene expression were also detected in the hTERT-immortalized NAFs and CAFs (Figure 1D).
To address the coexpression of FAP, CD44, and SMemb, double-IF staining was performed in PCa tissue sections. Of interest, all SMemb-positive cells strongly coexpressed FAP and thus constitute an SMemb+FAP+ subtype within the FAP-positive cells. Nearly all SMemb-positive cells also coexpressed CD44 (Figure 1E). Taken together, the IHC and IF results suggest that the appearance of prostate CAFs coincides with a substantial reduction in numbers of differentiated SMCs and a significant increase of SMemb/CD44/FAP-positive stem-like cells.
Prostate CAFs show high GPR30 but low ERα expression
To investigate which ER(s) may be involved in stromal cell activation, double-IF staining for FAP and ERs was performed in tissue sections. As shown in Figure 2, A and B, all cells with strong FAP-positive staining and some cells with low FAP-positive staining coexpressed GPR30; however, no FAP+ERα+ cells were detected in PCa stroma. In NP stromal cells, GPR30 was not only expressed at lower levels compared with PCa stromal cells, but it was also found to be primarily localized to the nucleus (Figure 2B, arrow). By contrast, GPR30 was present in the cell membrane and the cytoplasm of PCa stromal cells (Figure 2B, arrowhead). Quantification revealed GPR30 up-regulation by 3.4-fold and ERα down-regulation by 5-fold, respectively, in PCa stroma (Figure 2, A and B, lower panel). The up-regulation of GPR30 and down-regulation of ERα in the stroma of PCa tissues were confirmed by IHC staining (Supplemental Figure 2).
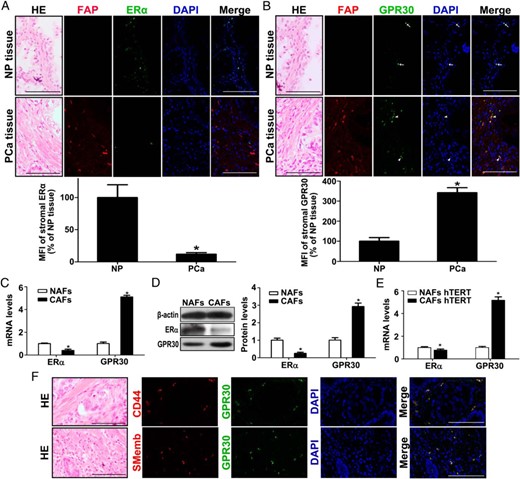
Prostate CAFs show high GPR30 but low ERα expression. A, Serial sections from each group were analyzed by HE staining and double-IF staining of FAP with ERα in NP and PCa tissue (upper panel) and mean of florescent intensity of the images (MFI) of stromal ERα (lower panel) (n = 6). Cell nuclei were counterstained with DAPI (blue). Bar, 100 μm. *, P < .05, PCa vs NP. B, Serial sections from each group were analyzed by HE staining and double-IF staining of FAP with GPR30 in NP and PCa tissue (upper panel) and MFI of stromal GPR30 (lower panel). Bar, 100 μm. *, P < .05, PCa vs NP. C and D, Real-time RT-PCR and Western blot analysis of ERα and GPR30 expression at mRNA (C) and protein level (D) in primary NAFs and CAFs. Results are presented as mean ± SD (n = 3). *, P < .0,5 CAFs vs NAFs. E, Real-time RT-PCR analysis of ERα and GPR30 expression in hTERT-immortalized NAFs and CAFs. Results are presented as mean ± SD (n = 3). *, P < .05, CAFs vs NAFs. F, Serial sections from each group were analyzed by HE staining and double-IF staining of CD44 with GPR30 and SMemb with GPR30 in PCa tissue. Bar, 100 μm.
In vitro, using real-time RT-PCR, we confirmed that GPR30 mRNA expression is increased by 5.1-fold in CAFs compared with NAFs, which is accompanied with a 2.5-fold decrease in ERα mRNA (Figure 2C). Western blotting revealed a 2.9-fold increase of GPR30 and 4-fold decrease of ERα at protein levels in CAFs compared with NAFs (Figure 2D). We confirmed the expression of GPR30 and ERα mRNA in the immortalized NAF and CAF cells and obtained congruent results (Figure 2E). Furthermore, double-IF staining revealed that in addition to FAP, GPR30 was strongly coexpressed with CD44 and SMemb (Figure 2F).
Taken together, our results suggest that the acquisition of an activated fibroblasts phenotype is positively related to the expression of GPR30 but negatively to the expression of ERα in the PCa stroma.
Overexpression of GPR30 or knockdown of ERα in stromal cells promote PCa cell proliferation and migration in a paracrine manner
The inverse expression of GPR30 and ERα in prostate CAFs prompted us to investigate their roles in PCa progression via a stromal to epithelial stimulation. WPMY-1 cells were transfected with expression plasmid or siRNA for GPR30 and ERα, respectively (Figure 3, A and C), and the CM was subsequently collected to study the effects on PCa cells. We used two prostate epithelial cell lines, the less invasive PCa cell line LNCaP and the highly malignant PCa cell line PC3 as models. As shown in Figure 3, B and D, the CM collected from WPMY-1 cells overexpressing GPR30 promoted LNCaP and PC3 cell proliferation, whereas the silencing of GPR30 abrogated the promotion effect. In contrast, the CM collected from WPMY-1 cells overexpressing ERα suppressed LNCaP and PC3 cell proliferation, whereas the silencing of ERα enhanced the CM ability of the WPMY-1 cells to promote PCa cell proliferation. The same results were obtained using hTERT-immortalized prostate NAF and CAF cells. The CM from immortalized CAF cells with GPR30 knockdown showed a diminished ability to promote PCa cell proliferation (Figure 3, E and F), whereas the CM collected from immortalized NAF cells with ERα knockdown promoted LNCaP and PC3 cell proliferation (Figure 3, G and H).
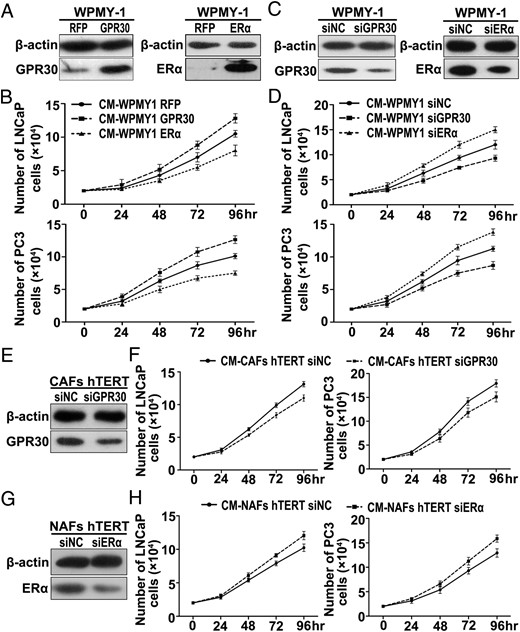
High expression of GPR30 or low expression of ERα in stromal cells promote PCa cell proliferation in a paracrine manner. A, C, E, and G, Prostate stromal cells were transfected with expression plasmid (A) or siRNA (C, E, and G) for GPR30 and ERα. Overexpression and knockdown were verified by Western blot analysis after 72 hours. Notice that Western blot images were obtained using different sensitivity settings for overexpression and knockdown experiments in WPMY-1 cells, lower sensitivity for overexpression (A), and higher sensitivity for knockdown experiments (C). B, D, F, and H, PCa cell lines LNCaP and PC3 were treated with CM from transfected stromal cells. Cells were counted after 24, 48, 72, and 96 hours, respectively. The proliferation curves of LNCaP and PC3 cells are depicted (n = 3).
On the other hand, we investigated the effects of the CMs obtained above in a Transwell migration assay (BD Biosciences). Results showed increased numbers of migrated LNCaP and PC3 cells with the CM from WPMY-1 GPR30 cells, whereas the numbers of migrated LNCaP and PC3 cells were decreased with the CM from WPMY-1 ERα cells (Figure 4A). Conversely, the CM of WPMY-1 siGPR30 significantly reduced LNCaP and PC3 cell migration, whereas the CM of WPMY-1 siERα increased LNCaP and PC3 cell migration (Figure 4B). Similarly, the CM from immortalized CAF cells with GPR30 knockdown showed a diminished ability to promote PCa cell migration (Figure 4C), whereas the silencing of ERα enhanced the CM ability of the immortalized NAF cells to promote LNCaP and PC3 cell migration (Figure 4D). Additionally, these findings were confirmed by wound-healing assays (Figure 4, E–H). Taken together, our data suggest that the expression of GPR30 in the tumor stroma may play a promoting role, whereas ERα expression may have a suppressing role upon PCa progression.
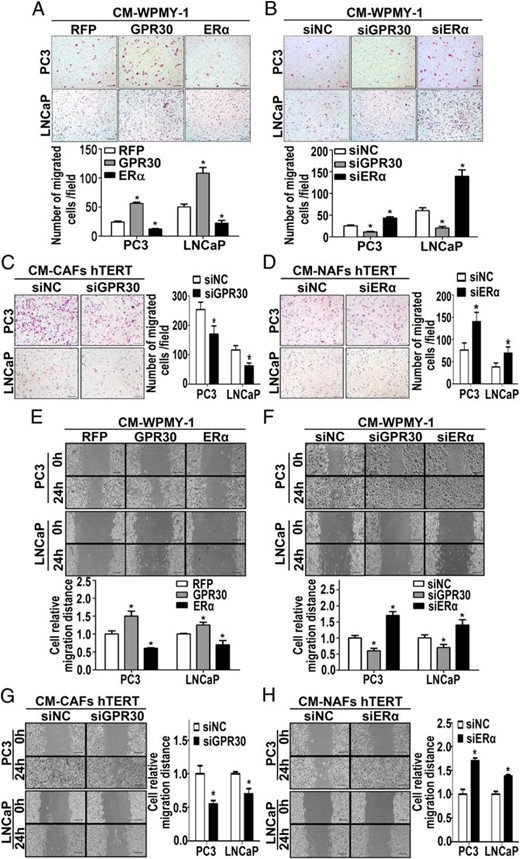
CM from stromal cells with high expression of GPR30 or low expression of ERα stimulate PCa cell migration. A–D, The Transwell assay was performed to evaluate the effect of CM from transfected stromal cells on migration of LNCaP and PC3 cells. CMs were placed into the lower chamber of the Transwell plates (BD Biosciences). LNCaP and PC3 cells were put into the top chamber and allowed to migrate for 24 hours. The Transwell inserts were fixed and stained before light microscopy visualization and cell number counting. Results are presented as mean ± SD (n = 5). *, P < .05 vs controls. Bar, 200 μm. E–H, Wound-healing assay of LNCaP and PC3 cells incubated for 0 or 24 hours with CM from transfected stromal cells. ImageJ software (National Institutes of Health) was used for the quantification of wound closure. Results are presented as mean ± SD (n = 3). *, P < .05 vs controls. Bar, 200 μm.
High expression of GRP30 and/or low expression of ERα is positively related to the CAF-like phenotype of prostate stromal cells
To elucidate the mechanism by which stromal GPR30 and ERα were able to exert their effects on PCa progression, we further investigated their functions on stromal cell phenotypic switching. We scrutinized the expression of FAP, CD44, Smemb, and the differentiation markers at both the mRNA and protein levels in WPMY-1 cells, which were transfected with expression plasmids or siRNA for GPR30 and ERα. As shown in Figure 5, A and B, FAP, CD44, and SMemb were significantly up-regulated in WPMY-1 cells upon GPR30 overexpression, together with the substantial down-regulation of α-SMA, SM22α, calponin, and MYH11. In contrast, the expression levels of FAP, CD44, and SMemb were dramatically reduced in WPMY-1 cells and the immortalized CAFs upon GPR30 knockdown, whereas the expression levels of differentiation markers were increased (Figure 5, C–F).
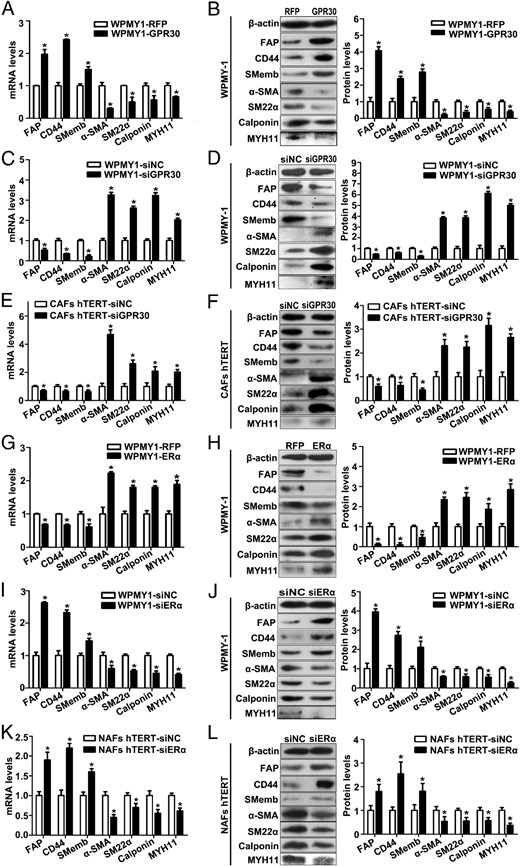
High expression of GPR30 and/or low expression of ERα is related to the CAF-like phenotype in prostate stromal cells. A–D, Real-time RT-PCR and Western blot analysis of gene expression in WPMY-1 cells transfected with GPR30 expression plasmid (A and B) or siRNA (C and D) at the mRNA level and protein level. E and F, Real-time RT-PCR and Western blot analysis of gene expression in immortalized CAFs transfected with siGPR30 at the mRNA (E) and protein level (F). G–J, Real-time RT-PCR and Western blot analysis of gene expression in WPMY-1 cells transfected with ERα expression plasmid (G and H) or siRNA (I and J) at the mRNA and protein level. K and L, Real-time RT-PCR and Western blot analysis of gene expression in immortalized NAFs transfected with siERα at mRNA (K) and protein level (L). Results are presented as mean ± SD (n = 3). *, P < .05 vs controls.
On the other hand, in WPMY-1 cells with ERα overexpression, FAP, CD44, and SMemb were down-regulated, but α-SMA, SM22α, calponin, and MYH11 were up-regulated (Figure 5, G and H), and knocking down ERα resulted in a remarkable opposite regulation in both WPMY-1 cells and the immortalized NAFs (Figure 5, I–L). All results suggest that high GPR30 expression and/or low ERα expression facilitate the induction of a CAF-like phenotype in prostate stromal cells.
GPR30 represses ERα expression in prostate stromal cells via inhibition of the cAMP/PKA signaling pathway
Because GPR30 and ERα show opposite roles in stromal cell activation, we further investigated whether GPR30 and ERα could regulate each other's expression. Interestingly, the overexpression of GPR30 resulted in a significant down-regulation of ERα at both the mRNA and protein levels, whereas the knockdown of GPR30 resulted in a dramatic up-regulation of ERα in WPMY-1 cells (Figure 6, A and B). Conversely, the overexpression or knockdown of ERα induced no significant regulation of GPR30 expression (Figure 6, C and D). The interconnected regulation was also confirmed in the immortalized NAFs and CAFs (Figure 6, E and F).
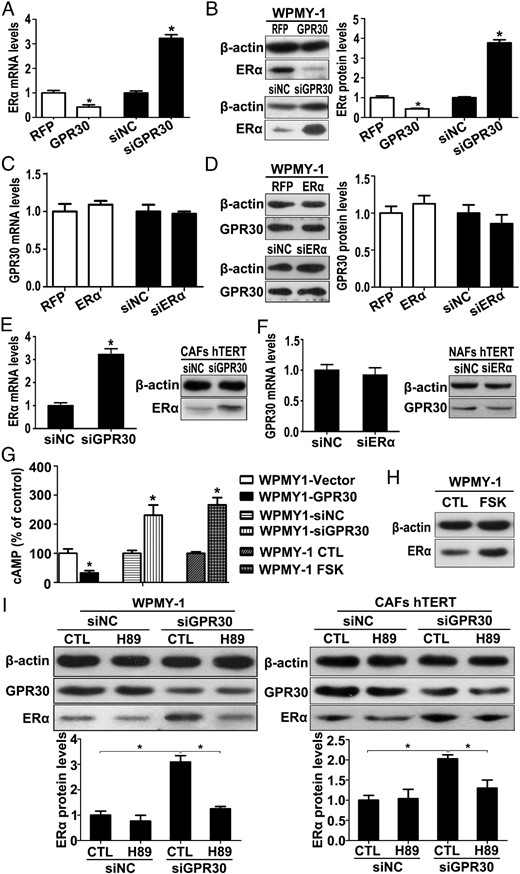
GPR30 represses ERα expression in prostate stromal cell via inhibition of the cAMP/PKA signaling pathway. A and B, Real-time RT-PCR and Western blot analysis of ERα expression in WPMY1-GPR30 or WPMY1-siGPR30 at mRNA (A) and protein level (B). C and D, Real-time RT-PCR and Western blot analysis of GPR30 expression in WPMY1-ERα or WPMY1-siERα at the mRNA (C) and protein level (D). E, Real-time RT-PCR and Western blot analysis of ERα expression in immortalized CAFs transfected with siGPR30 at mRNA (left panel) and protein level (right panel). F, Real-time RT-PCR and Western blot analysis of GPR30 expression in immortalized NAFs transfected with siERα at mRNA (left panel) and protein level (right panel). G, WPMY-1 cells were transfected with GPR30 expression plasmid or siRNA for 48 hours or treated with 1 μM FSK for 10 minutes, and then concentrations of cAMP were quantified using the cAMP-Glo assay (n = 3). *, P < .05 vs corresponding controls (CTLs). H, WPMY-1 cells were treated with 1 μM FSK for 24 hours, and ERα protein expression was demonstrated by Western blot. I, Western blot analysis of ERα protein expression in WPMY-1 cells (left panel) and immortalized CAFs (right panel) transfected with siGPR30 and treated with 2 μM H89 (upper panel), and quantification by densitometry (lower panel). Results are presented as mean ± SD (n = 3). *, P < .05.
It was reported that FSK stimulates ERα expression by activating the PKA pathway (32), whereas other reports indicated that GPR30 suppresses PKA activity by inhibiting cAMP production (33, 34). This led us to examine whether GPR30 represses ERα expression though inhibiting PKA activity. Thus, we quantified cAMP concentrations after transfection of WPMY-1 with GPR30 expression plasmid or specific siRNA. As shown in Figure 6G, cAMP levels were reduced 3.1-fold in WPMY-1 cells upon GPR30 overexpression, whereas knockdown increased cAMP concentration by 2.3-fold. FSK, a cAMP activator used as a positive control, rapidly stimulated cAMP production and, as expected, increased ERα protein expression in WPMY-1 cells (Figure 6H). We then treated stromal cells with the selective PKA inhibitor H89 after transfection of siGPR30. As shown in Figure 6I, H89 blocked the up-regulation of ERα protein expression by GPR30 knockdown in both WPMY-1 cells and immortalized CAFs. Thus, these data provide the evidence that GPR30 negatively regulates ERα expression through inhibiting the cAMP/PKA signaling pathway in prostate stromal cells.
Overall, our data reveal a mechanism summarized in Figure 7: GPR30 inhibits ERα expression and ERα downstream signaling pathways. A high GPR30/ERα ratio subsequently induces a CAF-like phenotype switch of prostate stromal cells.
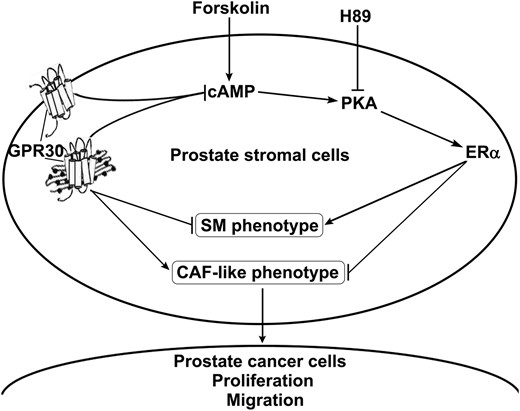
A schematic illustration of the proposed mechanism. GPR30 lowers cAMP and inhibits PKA activity, which represses ERα expression and attenuates ERα-mediated stimulation of SM differentiation and inhibition of CAF-like phenotype switching. High GPR30/low ERα supports the CAF phenotype, which enhances the release of proliferation and migration-promoting factors into the supernatant for paracrine stimulation of prostate tumor cells.
Discussion
In this study, we found an increased expression of FAP accompanied by an enhanced expressions of CD44 and SMemb and a substantial down-regulation of SM differentiation markers in stromal cells of prostate cancer tissues and cultured stromal cells derived therefrom. Moreover, CD44 and SMemb were largely coexpressed in PCa stromal cells, and double-positive CD44+SMemb+ cells strongly coexpress FAP.
SMemb, an embryonic-type member of the nonmuscle myosin heavy chain isoform family was previously reported to be abundantly expressed by activated mesenchymal cells in cardiac myxomas and atherosclerosis (35, 36), and its expression was coupled to the cell phenotype switch and proliferation (37). Coexpression of SMemb and the stem cell marker CD44 in PCa stroma indicates that most stromal stem-like cells have been abnormally reawakened/reactivated and undergone a phenotypic change to gain a higher proliferative capacity. It is well accepted that stem cells have a high plasticity (38), and the existence of CD44+SMemb+FAP+ cells indicates that the reactivated stromal stem-like cells differentiate into FAP-positive CAFs during PCa development. Yet we also detected FAP+CD44− cells within the PCa stroma. According to a previous report CD44-positive cells are able to generate CD44-negative cells by undergoing asymmetric division and to develop into fully differentiated myofibroblasts with reduced CD44 expression upon TGF-β stimulation (31, 39). By this mechanism the FAP+CD44− cells may be derived from the FAP+CD44+SMemb+ cells. The proliferation of stem-like cells and their transit-amplifying progeny contribute to the generation of reactive stroma. In view of the several hypotheses about the origin of CAFs, our study supports stromal stem-like cells as a source of prostate CAFs.
In prostate CAFs we found a significantly increased expression level of GPR30. Moreover, the FAP-positive stromal cells, especially the FAP+CD44+SMemb+ subtype, coexpressed GPR30, which was mainly localized to the cell membrane and the cytoplasm, whereas GPR30 showed predominant nuclear localization in NP stromal cells. In the vast majority of previous studies, GPR30 appeared to be expressed on the cell surface and the endoplasmic reticulum of several cancer or stromal cells (40–42). However, in cultured breast CAFs, GPR30 was reported to translocate into the nucleus through an importin-dependent mechanism, and its nuclear localization is required to stimulate the up-regulation of c-fos, one of the GPR30 target genes (22, 43). These data suggest that the cellular localization of GPR30 may be related to its physiological function and its tissue specificity.
We further demonstrate that the high expression of GPR30 in prostate stromal cells up-regulates FAP, CD44, and SMemb and down-regulates SM differentiation markers. Opposite to GPR30, the high expression of ERα in stromal cells is accompanied by the low expression of FAP, CD44, and SMemb and the high expression of SM differentiation markers. This suggests that high GPR30 and/or low ERα levels facilitate the phenotype switch of stromal cells toward CAFs. A role of ERα in prostate stromal cells phenotype modulation was reported previously (24). However, to our knowledge, our report is the first to link GPR30 to prostate CAF induction, identifying it as a crucial modifier of the stromal cell phenotype.
Another important finding of our study is the repression of ERα expression by GPR30, whereas ERα demonstrated no effect on GPR30 expression in prostate stromal cells. Contrary to our finding, Ariazi et al (44) previously reported the E2-mediated down-regulation of GPR30 mRNA via ER in breast cancer cells. Similarly, the group of Gao et al (45) found that the activation of GPR30 by G-1 inhibited ERα (Ser118) phosphorylation signals in the mouse uterus.
The CM from the stromal cells with high GPR30 or low ERα expression have promoting effects on the growth and migration of PCa cells. These findings are consistent with a large body of literature demonstrating that activated stromal cells secrete an abundance of paracrine-acting growth factors and cytokines that modulate the proliferation and motility/invasion of cancer cells. For example, hepatocyte growth factor secreted by prostate stromal cells can drive proliferation of adjacent epithelial cells (46); its production was found induced by estrogens in mammary fibroblasts (47). Similarly, Slavin et al (21) reported the down-regulation of MMP3 by ERα in prostate CAFs, and Yeh et al (48) reported the abrogation of IL-6 secretion by ERα in prostate CAFs. Both MMP3 and IL-6 promote the migration of tumor cells (4, 48, 49) and are also candidate mediators for the observed effects on tumor cell migration.
As we discussed above, GPR30 is up-regulated in prostate CAFs, and the overexpression of GPR30 in WPMY-1 cells induced a CAF-like phenotype to promote PCa cell proliferation and migration in a paracrine manner. In addition, a role for GPR30 in prostate epithelium has been reported previously. Chan et al (50) reported the activation of GPR30 by the nonestrogenic ligand G-1 inhibited the proliferation of PCa cells. Additionally, G-1 effectively inhibited the growth of castration-resistant tumors and elicited neutrophil infiltration-associated necrosis in xenograft models (51). This seems to disclose an opposing role of stromal and epithelial GPR30 in PCa progression, which is similar to the prostatic androgen receptor (AR) that epithelial AR functions as a suppressor and stromal AR functions as a promoter for PCa cell invasion (52). Moreover, G-1 inhibits PCa cell proliferation through the sustained activation of ERK1/2 and a c-jun/c-fos-dependent up-regulation of p21 (50), whereas in our study GPR30 suppresses ERα expression and was critically identified through inhibiting the cAMP/PKA signaling pathway in prostate stromal cell lines, although GPR30 overexpression or knockdown had no effect on ERK1/2 phosphorylation in WPMY-1 cells (data not shown). Therefore, the specific downstream signaling of epithelial and stromal GPR30 could be taken into account for the development of PCa therapies targeting GPR30.
Although our result of the down-regulation of SM differentiation makers in prostate CAFs is in agreement with previous reports (5, 6), no mechanism has been demonstrated before. Here we propose two possible mechanisms according to our results: 1) with PCa development, the stromal stem-like cells stimulated via GPR30 up-regulation preferentially propagate over the preexisting SMCs, resulting in the decrease of SM markers in PCa stroma; or 2) GPR30 up-regulation directly down-regulates SM differentiation marker expression in stromal cells by suppressing ERα. Therefore, GPR30 and its downstream signaling pathway may be a crucial event involved in prostate CAF formation.
In conclusion, we provide evidence that stromal stem-like cells are a possible source of prostate CAFs, and GPR30 plays a central role in promoting stromal cell activation by inhibiting ERα signaling. Further studies will be required to identify the mechanism(s) underlying stromal GPR30 up-regulation and cellular translocalization during PCa development. The crucial role of GPR30 in the induction and stimulation of a reactive tumor stroma suggests that treatment for PCa by targeting stromal GPR30 should be considered in the future.
Acknowledgments
This work was supported by the National Natural Science Foundation of China Grant 81370859 and The 111 Project Grant B08011.
Disclosure Summary: The authors have nothing to disclose.
Abbreviations
- AR
androgen receptor
- CAF
cancer-associated fibroblast
- CM
conditioned medium
- DAPI
4′,6′-diamino-2-phenylindole
- DMSO
dimethylsulfoxide
- E2
estradiol
- ER
estrogen receptor
- FAP
fibroblast activation protein
- FBS
fetal bovine serum
- FSK
forskolin
- GPR30
G protein-coupled receptor 30
- HE
hematoxylin and eosin
- hTERT
human telomerase reverse transcriptase
- IF
immunofluorescence
- IHC
immunohistochemical
- MFI
mean fluorescence intensity
- MMP
matrix metalloproteinase
- NAF
normal fibroblast
- NP
normal prostate
- PCa
prostate cancer
- PKA
protein kinase A
- P/S
penicillin/streptomycin
- RFP
red fluorescence protein
- siRNA
small interfering RNA
- SM
smooth muscle
- α-SMA
α-smooth muscle actin
- SMC
SM cell
- SMemb
nonmuscle myosin heavy chain B.
