


In pancreatic β-cells, controlling the levels of reactive oxygen species (ROS) is critical to counter oxidative stress, dysfunction and death under nutrient excess. Moreover, the fine-tuning of ROS and redox balance is important in the regulation of normal β-cell physiology. We recently demonstrated that Bcl-2 and Bcl-xL, in addition to promoting survival, suppress β-cell glucose metabolism and insulin secretion. Here, we tested the hypothesis that the nonapoptotic roles of endogenous Bcl-2 extend to the regulation of β-cell ROS and redox balance. We exposed mouse islet cells and MIN6 cells to the Bcl-2/Bcl-xL antagonist Compound 6 and the Bcl-2-specific antagonist ABT-199 and evaluated ROS levels, Ca2+ responses, respiratory control, superoxide dismutase activity and cell death. Both acute glucose stimulation and the inhibition of endogenous Bcl-2 progressively increased peroxides and stimulated superoxide dismutase activity in mouse islets. Importantly, conditional β-cell knockout of Bcl-2 amplified glucose-induced formation of peroxides. Bcl-2 antagonism also induced a mitochondrial proton leak that was prevented by the antioxidant N-acetyl-L-cysteine and, therefore, secondary to redox changes. We further established that the proton leak was independent of uncoupling protein 2 but partly mediated by the mitochondrial permeability transition pore. Acutely, inhibitor-induced peroxides promoted Ca2+ influx, whereas under prolonged Bcl inhibition, the elevated ROS was required for induction of β-cell apoptosis. In conclusion, our data reveal that endogenous Bcl-2 modulates moment-to-moment ROS signaling and suppresses a redox-regulated mitochondrial proton leak in β-cells. These noncanonical roles of Bcl-2 may be important for β-cell function and survival under conditions of high metabolic demand.
Pancreatic β-cells respond to elevated blood glucose levels by secreting insulin. To do so, β-cells metabolize glucose via glycolysis and mitochondrial oxidative phosphorylation, thereby increasing the ATP to ADP ratio. This inactivates plasma membrane ATP-sensitive K+ (KATP) channels, which depolarizes the cell and activates voltage-gated Ca2+ entry to trigger insulin granule exocytosis (1). Mitochondria are also a major source of reactive oxygen species (ROS). Superoxide is formed during mitochondrial respiration and can subsequently be converted to hydrogen peroxide (H2O2) by the antioxidant enzyme superoxide dismutase (SOD). Unlike superoxide, peroxides can diffuse across membranes and are less reactive, making them effective second messengers (2). Indeed, it has been suggested that during nutrient oxidation, moderate levels of mitochondria-derived ROS, most likely H2O2, serve as important metabolic coupling factors that amplifies KATP/Ca2+-dependent insulin secretion (2, 3), although some studies challenge this (4). In response to nutrients, the amount of mitochondrial ROS that is generated is dependent on the degree to which mitochondrial respiration is coupled to the production of ATP. Conversely, the degree to which mitochondrial electron transport is uncoupled, eg, by uncoupling proteins (UCPs) and other mechanisms of passive proton flux, can be modulated by ROS (5, 6).
Although low levels of ROS contribute to physiological signaling pathways, excessive and prolonged elevations in ROS can induce oxidative stress, which is believed to contribute significantly to the failure and loss of β-cells in the pathogenesis of type 2 diabetes (7). β-Cells express relatively low levels of antioxidant enzymes (8, 9), and this has been proposed to facilitate the use of ROS as signaling molecules involved in the regulation of insulin secretion at the expense of making the cells more susceptible to oxidative damage and death (6, 9, 10). Therefore, it is critical that the β-cell maintains a healthy balance of ROS production and scavenging to fine-tune these signals. A better understanding of the mechanisms underlying this β-cell redox control is needed to help clarify how disruption of the system can occur and lead to β-cell failure and death.
The B-cell lymphoma 2 (Bcl-2) family of proteins regulate the intrinsic pathway of apoptotic cell death that is activated in β-cells under prolonged oxidative and endoplasmic reticulum stress (11–16). Prosurvival members, including Bcl-2, Bcl-xL, and Mcl-1, counteract apoptosis by binding and antagonizing pro-death proteins of the family that otherwise promote mitochondrial outer membrane permeabilization and caspase activation (17). Nutrient stress and other diabetogenic insults sensitize β-cells to apoptosis, in part, by decreasing the levels of Bcl-2 and Bcl-xL (11, 15, 16, 18). We recently reported that Bcl-2 and Bcl-xL, in addition to their canonical antiapoptotic roles, dampen β-cell insulin secretion and mitochondrial metabolism through mechanisms that remain to be fully established (19). This dampening of basal metabolism by Bcl-2/Bcl-xL was relieved acutely after their pharmacological inhibition. Motivated by the close reciprocal relationship between β-cell metabolism and ROS, and the paramount importance of these variables for β-cell physiology and pathophysiology, we have investigated whether the Bcl proteins also impact β-cell ROS signaling and redox state. Such roles of endogenously expressed Bcl-2 have been suggested by studies on other tissues, including the brain of Bcl-2-null animals (20) and in vitro studies of neuronal oxidative stress and survival (21), but remain unexplored in pancreatic β-cells. Using small molecule antagonists and conditional knockout of Bcl-2, we now reveal that endogenous Bcl-2 controls ROS levels, as well as a redox-sensitive mitochondrial proton leak in β-cells. These findings provide novel insights into the complex regulation of β-cell ROS with potential implications for both normal β-cell physiology and their pathophysiology in the progression of diabetes.
Research Design and Methods
Materials
Compound 6 (C6) (Calbiochem) and ABT-199 (also known as Venetoclax; Selleckchem) were dissolved in dimethyl sulfoxide (DMSO). Dihydroethidium (DHE), 2′,7′-dichlorodihydrofluorescein diacetate (H2DCF-DA) and fura 2-AM were from Molecular Probes/Life Technologies. N-acetyl-L-cysteine (NAC), propidium iodide (PI), oligomycin, carbonyl cyanide 4-(trifluoromethoxy) phenylhydrazone (FCCP), antimycin-A, rotenone, diethyldithiocarbamate (DDC), and cyclosporin A (CsA) were from Sigma-Aldrich; eFluor780 was purchased from eBiosciences. Genipin was from Enzo Life Sciences.
Cell culture and pharmacological inhibition of endogenous Bcl proteins
MIN6 insulinoma cells were cultured in DMEM (25 mmol/L glucose), and primary mouse islets and dispersed mouse islet cells were cultured in RPMI 1640 (11 mmol/L glucose). All culture media were supplemented with 10% fetal bovine serum, penicillin (200 U/mL) and streptomycin (200 mg/mL) (complete media), and cell culture was at 37°C in a humidified atmosphere containing 95% air and 5% CO2. Endogenous Bcl-2 was antagonized using 2 different small molecules: C6 that binds both Bcl-2 and Bcl-xL (19, 22) and ABT-199 (Venetoclax), which is almost 5000-fold more selective for Bcl-2 compared with the other main antiapoptotic family members (Ki is <0.01 for Bcl-2, 48nM for Bcl-xL and >444nM for Mcl-1, in a time-resolved FRET competition binding assay) (23), and is showing promising results in clinical trials for treatment of chronic lymphocytic leukemia (24). Cells were treated with Bcl inhibitors in complete media with the indicated glucose concentrations. In some experiments, cells were precultured with NAC, DDC, CsA, or genipin for 1 hour before addition of Bcl inhibitors.
Mouse models, islet isolation, and islet dispersion
To investigate the effects of conditional Bcl-2 gene deletion on islet ROS signaling, we bred Pdx1-CreER (19, 25) and Bcl-2flox mice (Bcl2tm1Irt/J; The Jackson Laboratory stock number 008882). The resulting Bcl-2flox/flox:Pdx1-CreER and Bcl-2flox/flox littermates were injected ip with tamoxifen (3 mg/40 g body weight) for 4 consecutive days to activate Cre recombinase and generate knockout (Bcl-2βKO) and control (Bcl-2WT) mice, respectively (19). Pancreatic islets were isolated from 12- to 16-week-old C57BL/6J male mice (The Jackson Laboratory), from 16- to 28-week-old littermate Bcl-2WT and βKO mice, and from 12- to 16-week-old female β-cell-specific UCP2 knockout (UCP2βKO) and RIPCre control mice (6) by perfusing the pancreas via the pancreatic duct with collagenase (1000 U/mL, C7657; Sigma-Aldrich) as previously described (19). Islets were picked by hand and cultured overnight in complete RPMI 1640 media before being used for further experiments. For single cell studies, islets were dispersed with 0.01% trypsin (19). All animals were maintained in compliance with Canadian Council on Animal Care guidelines and the studies were approved by the University of British Columbia Committee on Animal Care and by the University of Manitoba's Animal Care Committee.
Intracellular ROS measurements
Intracellular ROS species were measured in MIN6 cells and dispersed islet cells using the fluorescent indicators H2DCF-DA and DHE, which reflect the levels of peroxides and superoxide, respectively (26–29). Dispersed islet cells were aliquoted into 35-mm Petri dishes (∼50 islets per dish) and allowed to rest for 1 hour before the experimental treatments. During the last 20 minutes of the treatment, cells were loaded with 25 μmol/L H2DCF or DHE, and then washed once with PBS and resuspended in PBS with 2% fetal bovine serum. The mean intensity of the cellular fluorescence derived by the oxidized probes was measured on a FACSCanto (BD Biosciences) at excitation/emission wavelengths of 488/530 nm for H2DCF and 518/605 nm for DHE. Cell viability was simultaneously evaluated by staining with PI (10 μg/mL; used in conjunction with H2DCF staining) or eFluor780 (1 μL/mL; used in conjunction with DHE staining). Dead cells (PI or eFluor positive) were excluded from the ROS analyses. Data were analyzed using FlowJo v. 7.6.1 (Tree Star) and presented as the mean fluorescence intensity of the live cells.
SOD activity
The total cellular SOD activity (Cu/Zn, Mn, and FeSOD) was measured using an assay kit according to the manufacturer's instructions (Cayman) (30). Briefly, 200 mouse islets were dispersed and cultured for 1 hour in complete RPMI 1640 media and then transferred to RPMI 1640 media containing 3 mmol/L glucose for 1 hour before exposure to Bcl inhibitors or stimulatory concentrations of glucose, as indicated. After treatments, the islet cells were collected, washed once with PBS, lysed in 50 μmol/L SOD assay lysis buffer, and sonicated for 4 minutes (Misonix). Cell lysates were stored at −80°C until assaying. One unit of SOD was defined as the amount of enzyme needed to produce 50% dismutation of superoxide radical. All data were normalized to total protein content.
Oxygen consumption measurements
Characteristics of MIN6 and dispersed islets cellular respiration were determined using the Seahorse Extracellular Flux Analyzer XFe96 (Seahorse Bioscience). Cells were seeded in Seahorse XF96 Cell Culture Microplates and allowed to adhere in culture for 2 days before the experiments. MIN6 cells were plated at 15 000 cells per well and dispersed islet cells at approximately 40 000 cells per well. On the day of the experiment MIN6 cells had grown to approximately 70% confluence. Before loading into the XFe96 Analyzer, cells were washed with XF basic medium supplemented with 3 mmol/L glucose, 2 mmol/L glutamine, and 2 mmol/L sodium pyruvate and incubated at 37°C in a non-CO2 incubator for 60 minutes. When the oxygen consumption rate (OCR) measurement reached a steady state, wells were injected with glucose or C6 as indicated, followed by injections of 1 μmol/L oligomycin, 0.5 μmol/L FCCP and finally a combination of 1 μmol/L rotenone and 1 μmol/L antimycin A (6, 31, 32). ABT-199 was added to the cells 1 hour before loading the plate into the machine. Mitochondrial proton leak was calculated by subtracting the extramitochondrial respiration from the OCR value after oligomycin injection (32). Corrected OCR values were normalized to total protein per well quantified using the bicinchoninic acid assay.
Ca2+ imaging
Dispersed mouse islet cells were cultured for 2 days on glass coverslips and then stained with 5 μmol/L fura 2-AM in culture media with or without 5 mmol/L NAC for 30 minutes at 37°C, 5% CO2. The fura 2-loaded cells were mounted in an imaging chamber of volume 1 mL and washed for 30 minutes with 3 mmol/L glucose Ringer's solution (5.5 mmol/L KCl, 2 mmol/L CaCl2, 1 mmol/L MgCl2, 20 mmol/L HEPES, and 144 mmol/L NaCl; adjusted to pH 7.4 by NaOH). Throughout the experiments, cells were perifused at a flow rate of 1 mL/min. Recordings were made on a Leica DMI6000 inverted microscope equipped with a Leica HC Plan Fluotar ×10 objective and a Leica DFC365 FX digital camera. Fura 2 was excited alternately at 340 and 380 nm, and the resulting emissions were collected through a 502- to 538-nm filter. The changes in cytosolic Ca2+ are expressed as the ratio of fluorescence emission intensity (F340/F380).
Western blotting and quantitative PCR (qPCR)
Western blotting detection of cleaved caspase 3 was performed as previously described (19, 33) using a rabbit polyclonal antibody from Cell Signaling Technology (9661S). Total islet RNA was extracted from islets using the RNEasy Mini kit (QIAGEN) and cDNA was synthesized by reverse transcription using 100-ng RNA and the qScript cDNA synthesis kit (Quanta Biosciences). Bcl-2 expression was measured relative to mouse 18S housekeeping gene using PerfeCTa SYBR Gree SuperMix plus ROX (Quanta Biosciences) and assayed using an Applied Biosystems 7500 Fast Real-Time qPCR machine. Primers were synthesized by Integrated DNA Technologies: Bcl-2 forward, 5′-GCCCACCATCTAAAGAGCAA-3′ and reverse, 5′-GCATTTTCCCACCACTGTCT-3′ and 18S forward, 5′-ACCGCAGCTAGGAATAATGG-3′ and reverse, 5′-CCTCAGTTCCGAAAACCAAC-3′.
Statistical analysis
Data are shown as mean ± SEM. In the flow cytometry-based measurements of ROS levels, the fluorescence intensities are in arbitrary units and the absolute levels vary between individual experiments. To enable statistical comparison, superoxide and peroxide data were z-transformed before analysis. Differences between 2 groups were compared by unpaired Student's t test and multiple groups by one-way ANOVA followed by Bonferroni multiple comparison test. Differences were considered significant if P < .05.
Results
Antagonism of Bcl-2/xL acutely modulates ROS levels in β-cells
As an initial measure of physiological ROS regulation, we examined the effects of varying glucose concentrations on superoxide levels in MIN6 cells. Compared with culture in standard DMEM (25 mmol/L glucose), overnight culture in low glucose DMEM (5 mmol/L) increased superoxide levels (Figure 1, A and control conditions in C). Then, an acute increase in the extracellular glucose concentration from 5 to 10 mmol/L or 25 mmol/L rapidly reduced superoxide levels (Figure 1B), which is in agreement with previous studies of purified rat β-cells (34). As a positive control for the detection of superoxide by our DHE probe, we used rotenone, which inhibits mitochondrial complex I and increases mitochondrial superoxide formation (Figure 1A) (35). Interestingly, the small molecule Bcl-2/Bcl-xL coantagonist C6 (19, 22) also reduced superoxide levels, although this lowering appeared more transient than the response to glucose (Figure 1C). The inhibitor-induced reduction in superoxide levels was observed in the presence of both 5 and 25 mmol/L glucose, suggesting that this effect did not depend significantly on the metabolic state of the cell (Figure 1C). To evaluate the contribution of Bcl-2 we used the BH3 mimetic ABT-199 (Venetoclax), which has very high specificity for Bcl-2 compared with the other antiapoptotic family members (see Research Design and Methods) (23). Notably, ABT-199-mediated inhibition of Bcl-2 also decreased MIN6 superoxide levels in a dose- and a time-dependent manner (Figure 1D). To determine whether the observed effects were restricted to clonal β-cells, we performed similar measurements in primary mouse islet cells. As shown in Figure 1E, left, lowering glucose from 11 to 3 mmol/L markedly elevated superoxide levels in the islet cells. Analogous to what was seen in MIN6, superoxide levels dropped when glucose was then raised to a high stimulatory concentration of 20 mmol/L. However, in contrast to MIN6, we did not detect a lowering of superoxide in primary cells after 2 hours of exposure to C6 or ABT-199 (Figure 1E, right).
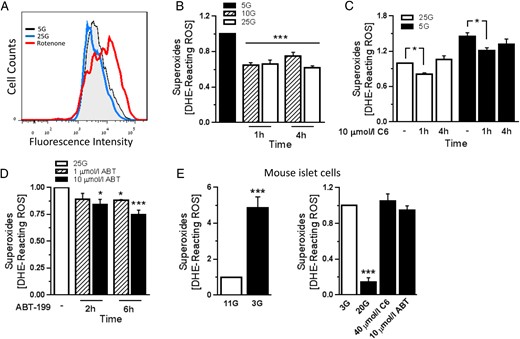
Effects of acute Bcl-2 inhibition on superoxide levels in β-cells. A, Representative flow cytometry measurement of superoxide in MIN6 cells that were cultured overnight in 25 mmol/L glucose (25G; normal glucose concentration), 5 mmol/L glucose (5G; low glucose concentration), or treated with 1 μmol/L rotenone for 1 hour. B, Superoxide levels expressed as units of mean fluorescence intensity in the different glucose concentrations, normalized to the levels in 5G. Following culture in low glucose, stimulatory glucose was added to the cells, and superoxide levels were measured at the indicated time points (n = 5–7 from at least 3 independent experiments); ***, P < .001 vs 5G. C and D, Superoxide levels in MIN6 cells that were treated with the Bcl-2/Bcl-xL inhibitor C6 in the presence of 5G and 25G (C) or with the specific Bcl-2 inhibitor ABT-199 in the presence of 25G (D). Results were normalized to superoxide levels in 25G containing DMSO vehicle (n = 3–6 from at least 3 independent experiments); *, P < .05; ***, P < .001 vs DMSO-treated cells. E, Superoxide levels in dispersed mouse islet cells. Left, Cells were incubated in RPMI 1640 with 11 mmol/L glucose (11G; normal glucose concentration) or 3 mmol/L glucose (3G) for 1 hour; ***, P < .001 vs 11G. Right, After 1 hour of preincubation in 3G, cells were stimulated for 2 hours with 20 mmol/L glucose or with either 40 μmol/L C6 or 10 μmol/L ABT-199 in 3G (n = 4 from 2 independent experiments); ***, P < .001 vs 3G.
We next measured the effect of glucose stimulation and Bcl-2/xL inhibition on β-cell peroxide levels. Culturing MIN6 cells overnight in 5 mmol/L glucose did not have a significant effect (Figure 2B, control conditions), whereas an acute rise in glucose significantly increased peroxide levels (Figure 2A). Interestingly, inhibition of Bcl-2/xL by C6 also lead to a 3-fold increase in peroxides. This effect was not dictated by the concentration of glucose in the culture media (Figure 2B). A significant increase in peroxide levels was also seen in response to Bcl-2-specific inhibition with ABT-199 (Figure 2C), providing evidence that Bcl-2 contributed to this effect. Importantly, as detailed later (see figure 5 below), the inhibitor concentrations and time points used in this experiment were not associated with an increase in MIN6 cell death. We next examined peroxide levels in primary islet cells. Dispersed mouse islets were preincubated in 3 mmol/L glucose media for 1 hour and then treated with Bcl inhibitors or 20 mmol/L glucose for 2 hours. Also in primary cells, both glucose and Bcl-2 antagonism significantly elevated peroxide levels. Notably, the increase in peroxides was prevented by preincubation with the antioxidant NAC (Figure 2, D and E). H2O2 was used as a positive control for the detection of peroxides by the H2DCF-DA probe (Figure 2D). The short-term elevation of peroxides after glucose or Bcl-2 inhibitor exposure were not associated with an increase in primary islet-cell death (percent cell death: 15.8 ± 2.1, 15.1 ± 2.0, and 19.5 ± 0.8 for DMSO, ABT-199, and C6, respectively). Bcl-2 expression levels did not change in islet cells or MIN6 cells as a result of the variations in glucose exposures used in our studies (Supplemental Figure 1). Together, these data reveal that loss of Bcl-2 function in β-cells rapidly modulates redox state by affecting ROS levels. Most notably, Bcl inhibition increased peroxides analogously to what is seen in response to short-term stimulation with glucose, suggesting that endogenous Bcl-2 normally suppresses β-cell peroxide formation.
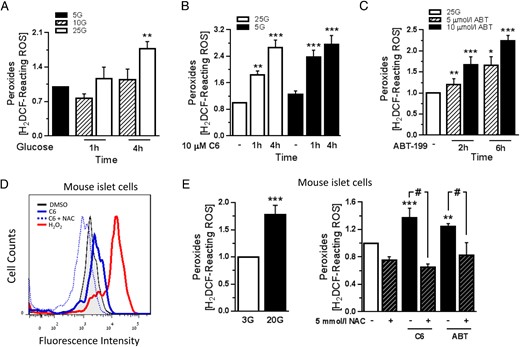
Acute Bcl-2 inhibition increases peroxide levels in β-cells. A, MIN6 cell peroxide levels expressed as mean fluorescence intensity, normalized to the levels in 5 mmol/L glucose (5G; low glucose). After overnight culture in 5G, MIN6 cells were stimulated with 10 or 25 mmol/L glucose (10G or 25G) and peroxide levels were measured (n = 4 from 4 independent experiments); **, P < .01 vs 5G. B and C, Peroxide levels in MIN6 cells that were treated with the Bcl inhibitor C6 in the presence of 5G and 25G (B) or the specific Bcl-2 inhibitor ABT-199 in the presence of 25G (C). Results are normalized to peroxide levels in 25G containing DMSO vehicle (n = 3–6 from 4 independent experiments); *, P < .05; **, P < .01; ***, P < .001 vs the corresponding DMSO-treated cells. D and E, Representative flow cytometry measurement of peroxides in dispersed mouse islet cells (D) and quantification of peroxide levels in the indicated treatments (E). Cells were incubated in 3 mmol/L glucose (3G; white bar) with or without 5 mmol/L NAC for 1 hour, followed by treatment with 20 mmol/L glucose, 40 μmol/L C6, or 10 μmol/L ABT-199 for 2 hours or 100 μmol/L H2O2 for 1 hour. Bcl-2 inhibitors and H2O2 were added in the presence of 3G (n = 4–6 from at least 3 independent experiments); **, P < .01; ***, P < .001 vs DMSO-treated cells; #, P < .05.
Bcl-2 inhibition stimulates islet SOD activity
We hypothesized that the changes in ROS that resulted from glucose stimulation or Bcl-2 inhibition might be attributed to an increase in SOD antioxidant activity, which converts superoxide radicals into H2O2. To test this, dispersed mouse islet cells were cultured at 3 mmol/L glucose for 1 hour and then either stimulated with 20 mmol/L glucose or exposed to Bcl inhibitors for 2 hours. It has been reported that glucose stimulates SOD activity in rat islets, and this was attributed to activation of the cytosolic form of the enzyme, Cu/Zn-SOD (SOD1) (37). In our mouse islet cells glucose notably increased total SOD activity although the effect did not reach statistical significance. In contrast, both C6 and ABT-199 significantly stimulated total islet cell SOD activity by 2- to 3-fold (Figure 3A). To determine whether SOD1 activity contributed to the changes in peroxides after Bcl-2 inhibition, we used the SOD1-selective inhibitor DDC (38). In primary islet cells, basal SOD activity was reduced by approximately 50% by 1 μmol/L DDC (Figure 3B). SOD1 inhibition was associated with a significant reduction in peroxides under basal and ABT-199-stimulated conditions, but this was not seen in the presence of C6 (Figure 3C). Further, a small response to ABT-199 remained in DDC-treated cells (Figure 3C). These results suggest that Bcl-2 affects β-cell ROS by mechanisms that include, but are not limited to, modulation of SOD1 activity.
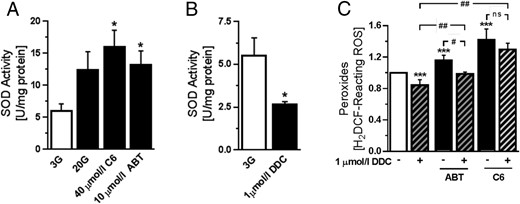
Stimulation of SOD activity by Bcl inhibition. A, Measurement of SOD activity in mouse islet cells after incubation in 3 mmol/L glucose (3G) for 1 hour, followed by treatment with 20 mmol/L glucose (20G), 40 μmol/L C6, or 10 μmol/L ABT-199 for 2 hours. Bcl-2 inhibitors were added in the presence of 3G (n = 5–10 from 3 independent experiments); *, P < .05 vs 3G. B, SOD activity in islet cells treated with 1 μmol/L of the SOD1 inhibitor DDC for 2 hours (n = 4 from 2 independent experiments); *, P < .001 vs 3G. C, Peroxide levels in islet cells that were cultured in 3G for 1 hour, followed by 2 hours treatment with 40 μmol/L C6 or 10 μmol/L ABT-199 in the presence or absence of 1 μmol/L DDC (n = 4 from 2 independent experiments); ***, P < .001 vs 3G; #, P < .05; ##, P < .001.
Bcl-2 suppresses a redox-modulated proton leak that partially involves the CsA-sensitive mitochondrial permeability transition pore (mPTP)
To further characterize the roles of endogenous Bcl-2 in β-cell metabolism, we next used the Seahorse Extracellular Flux Analyzer to examine the effects of Bcl-2 inhibition on mitochondrial respiratory control (32). Our measurements demonstrated an increase in basal respiration in response to glucose, whereas Bcl-2 inhibition did not have a significant effect (Figure 4A). Interestingly, the analyses also revealed that acute Bcl inhibition, but not glucose, promoted a mitochondrial proton leak that was clearly evident during ATP synthase inhibition by oligomycin but was not sufficient to change basal respiration (Figure 4, A and B). Given the known reciprocal relationship between ROS signaling and mitochondrial coupling, we next measured the proton leak rate after preincubation with the antioxidant NAC. Importantly, we found that the leak was blocked by NAC and therefore secondary to the inhibitor-induced changes in β-cell redox state (Figure 4B), but it was not prevented by inhibition of SOD1 (Supplemental Figure 2). Because ROS can promote the activity of UCP2 (5, 39), we investigated the involvement of UCP2 using the inhibitor genipin, as well as dispersed islet cells from β-cell-specific UCP2 knockout mice (UCP2βKO) (6). The ABT-induced proton leak was not significantly affected in UCP2βKO islet cells (Figure 4C) or by preincubation with 50 μmol/L genipin (Figure 4D), suggesting that the proton leak does not result from UCP2 activation. ROS can also regulate physiological mPTP opening (40). In addition, it was recently reported that in neurons the c-subunit of the mitochondrial ATP-Synthase also mediates a proton leak that is regulated by Bcl-xL and may in fact constitute the pore-forming component of the mPTP (41, 42). It is not known whether this mPTP-associated leak is similarly regulated by Bcl-2. To test the putative contribution from the mPTP, we used the inhibitor CsA, which also inhibits the ATP-Synthase-associated leak conductance (43). As shown in Figure 4D, CsA at a concentration of 100 nmol/L partially blocked the proton leak in β-cells exposed to ABT-199. Together, these experiments reveal that Bcl-2 also regulates β-cell mitochondrial coupling by mechanisms that are ROS-dependent and may, in part, involve an mPTP-mediated proton leak.
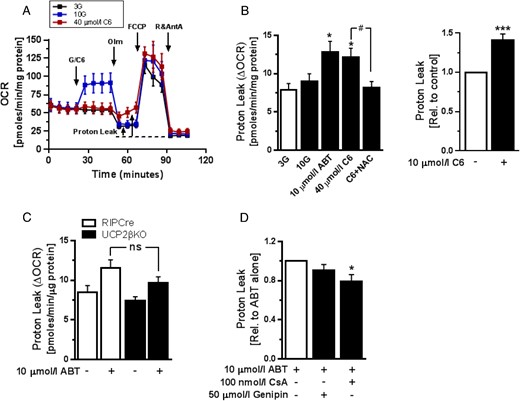
Acute Bcl-2 inhibition promotes ROS-dependent mitochondrial proton leak. The bioenergetics of MIN6 or dispersed mouse islets cells after glucose stimulation or Bcl inhibition were studied using an XFe96 Extracellular Flux Analyzer. A, Representative mitochondrial respiration assay in dispersed mouse islet cells (see Research Design and Methods; n = 4). B, left, Quantification of mitochondrial proton leak in dispersed mouse islet cells following the indicated treatments. Cells were preincubated with 5 mmol/L NAC for 1 hour. Bcl-2 inhibitors were added in the presence of 3 mmol/L glucose (3G) (n = 10–12 from 3 independent experiments); *, P < .05 vs 3G; #, P < .05. Right, Proton leak in MIN6 cells treated with C6 in the presence of 5 mmol/L glucose (n = 5 from 2 independent experiments); ***, P < .001 vs DMSO-treated cells. C, Comparison of mitochondrial proton leak induced by 10 μmol/L ABT-199 in islet cells from UCP2βKO and control RIPCre mice in the presence of 3G (n = 6 and n = 4, respectively, from 3 independent experiments). D, The effects of UCP2 inhibition with 50 μmol/L genipin or mPTP inhibition with 100 nmol/L CsA on ABT-199-induced mitochondrial proton leak in C57BL/6J mouse islet cells. Measurements were made in the presence of 3G (n = 8 from at least 2 independent experiments); *, P < .05.
NAC prevents Bcl-inhibition-induced islet cell Ca2+ responses and apoptosis
In our previous work, we demonstrated that inhibition of Bcl-2/Bcl-xL by C6 rapidly triggers KATP channel-dependent and voltage-gated β-cell Ca2+ entry (19). To examine whether this physiological effect might be secondary to changes in β-cell redox state, we measured cytosolic Ca2+ in mouse islet cells exposed to C6 in the absence or presence of NAC. As shown in Figure 5, the C6-induced Ca2+ responses were prevented by preincubation of the cells with the antioxidant (Figure 5, A and B). The quality of the islet cell preparations was confirmed by the presence of robust responses to stimulation with glucose (data not shown). We also previously found that prolonged coinhibition of Bcl-2 and Bcl-xL by C6 eventually induces β-cell apoptosis (19). By preincubating our cells with NAC we now established that the inhibitor-induced caspase 3 activation and β-cell death are also ROS-dependent (Figure 5, C and D). It should be noted that specific inhibition of Bcl-2 by ABT-199 did not lead to islet cell death at 6 hours (Figure 5C) or after prolonged 24 hours of treatment (data not shown). These data indicate that regulation of ROS signaling by Bcl-2 may have important implications for acute β-cell physiology, as well as more chronic consequences for β-cell survival that is likely also influenced by the other antiapoptotic proteins in the Bcl-2 family.
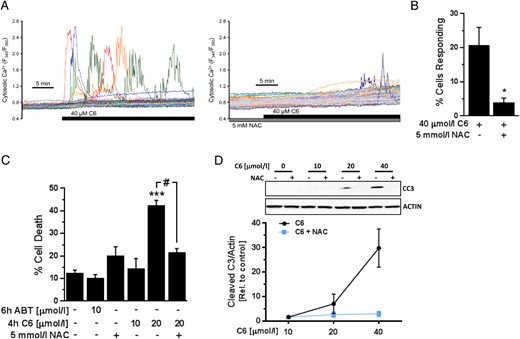
Bcl-2 inhibition-induced Ca2+ response and cell death is ROS-dependent. A, Representative cytosolic Ca2+ response of mouse islets cells exposed to the Bcl-2/Bcl-xL inhibitor C6 alone (left) or in the presence of 5 mmol/L NAC (right). The compounds were added to Ringer's perfusate containing 3 mmol/L glucose. B, Quantification of the percentage of islet cells that responded with Ca2+ transients to C6 in the presence or absence of NAC (n = 8 C57BL/6J islet cell preparations); *, P < .05 vs treatment with C6 alone. C, Percentage of dead (PI-positive) MIN6 cells as measured by flow cytometry following the indicated treatments, which were added to DMEM media with 25 mmol/L glucose (n = 5–7 from at least 3 independent experiments); ***, P < .001 vs DMSO-treated cells; #, P < .001. D, Accumulation of cleaved caspase 3 (CC3) in MIN6 cells after 4 hours of exposure to C6 in the presence or absence of 10 mmol/L NAC in DMEM media with 25 mmol/L glucose (n = 3–4).
Conditional Bcl-2 deletion amplifies glucose-stimulated peroxide formation in β-cells
As a complementary loss-of-function model to the small molecule Bcl-2 inhibitors, we used the Cre-Lox approach to establish a new line of mice with tamoxifen-inducible and β-cell-selective Bcl-2 deletion (see Research Design and Methods for details). We administered ip tamoxifen injections to adult littermate Bcl-2flox/flox (WT) and Bcl-2flox/flox:Pdx1-CreER (Bcl-2βKO) mice, and 12–16 weeks after the last injection, we isolated their islets to quantify Bcl-2 expression levels and compare their ROS responses to glucose. Bcl-2βKO islets showed the expected reduction of Bcl-2 expression compared with WT islets (Figure 6A). Despite the difference in Bcl-2 expression, a 20 mmol/L glucose stimulus lowered superoxide similarly in islets of the 2 genotypes (Figure 6B). The peroxide response to glucose, on the other hand, was significantly amplified in Bcl-2βKO islets cells compared with WT (Figure 6C). These data provide additional evidence that endogenous Bcl-2 suppresses β-cell peroxides and establish that this noncanonical function of Bcl-2 extends to the modulation of physiological glucose-induced ROS responses.
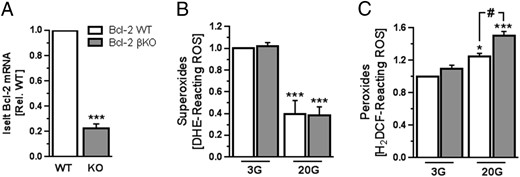
Inducible, β-cell-specific deletion of Bcl-2 enhances glucose-induced peroxide production. A, Quantification by qPCR of Bcl-2 mRNA levels in islets from Bcl-2βKO (gray bars) and Bcl-2WT littermates (white bars) (n = 10–12 islet preparations of each genotype); ***, P < .001 vs WT. B and C, Superoxide levels (B) and peroxide levels (C) measured in Bcl-2βKO and Bcl-2WT islet cells that were incubated in RPMI 1640 media with 3 mmol/L glucose (3G) for 1 hour followed by stimulation with 20 mmol/L glucose (20G) for 2 hours (n = 4–6 islet preparations from 3 independent experiments); *, P < .05 and ***, P < .001 vs 3G; #, P < .05.
Discussion
In this study, we provided evidence that the core antiapoptotic protein Bcl-2 has moment-to-moment functions in regulating β-cell ROS levels by mechanisms that include changes in the activity of SOD and mitochondrial coupling. We demonstrated that β-cells possess a Bcl-2-regulated mitochondrial proton leak that is sensitive to the antioxidant NAC, and partially involves the mPTP. Finally, we found that ROS are required for the acute metabolism-dependent Ca2+ influx, as well as the more long-term effects on survival, we have previously shown result from Bcl-2/Bcl-xL coantagonism in β-cells (19). Together this identifies new roles for Bcl-2 in β-cell ROS signaling and the cross talk of β-cell redox state and mitochondrial physiology.
We recently reported that Bcl-2/Bcl-xL coantagonism by C6, analogous to glucose, acutely increases ATP/ADP, and activates voltage-gated Ca2+ influx and insulin secretion that requires mitochondrial respiration (19). Here, we show that the similarities between Bcl-2 inhibition and glucose signaling in β-cells extend to acute effects on β-cell ROS regulation. Over the years, studies have reported widely different, and seemingly contrasting, effects of a short-term physiological glucose stimulus on β-cell ROS. Purified rat β-cells respond to glucose with a reduction in both superoxide and peroxides (34), but other studies on rat and mouse islets, as well as MIN6 and INS1 cell lines, recorded increases in superoxide and/or peroxide levels (2, 3, 44). In this study, we observed that glucose lowered superoxide levels and increased cellular peroxides in both MIN6 and mouse islet cells. The peroxide response to glucose was amplified in Bcl-2 knockout islet cells and short-term Bcl-2 inhibition increased peroxides in both MIN6 and primary islets, demonstrating that β-cell peroxide levels are normally suppressed by Bcl-2. The effect of Bcl antagonism on superoxide levels was more complex and also less consistent between MIN6 and primary cells. After Bcl inhibition, MIN6 cells responded with a drop in superoxide that was not seen in islet cells. The reason for this difference is not clear. One possibility might be that Bcl inhibition activates a parallel mechanism for superoxide formation that is stronger and/or more rapidly induced in primary cells than in MIN6 cells.
Antibody Table
| Peptide/Protein Target | Antigen Sequence (if Known) | Name of Antibody | Manufacturer, Catalog Number, and/or Name of Individual Providing the Antibody | Species Raised in; Monoclonal or Polyclonal | Dilution Used |
|---|---|---|---|---|---|
| Cleaved caspase 3 | Cleaved caspase3 (Asp175) | Cell Signaling, 9661 | Rabbit; polyclonal | 1:1000 |
Martens et al have proposed that glucose stimulation may lower superoxide levels by increasing respiratory flux and diverging O2 from superoxide toward formation of H2O (34). In this scenario peroxide formation should also be diminished. Because we instead see elevated peroxides in response to both glucose and Bcl inhibition (Figure 2), this is not likely the mechanism by which superoxide is lowered in our experiments. A number of mechanisms exist by which peroxides can be increased, including a reduction in catalase or glutathione (GSH) peroxidase activity, as well as activation of amino acid oxidase, acyl-CoA oxidase and/or SOD (9). Intriguingly, we found that SOD was rapidly and robustly activated by Bcl inhibitors and that inhibition of cytosolic SOD by DDC significantly lowered peroxide levels in the presence of ABT-199. However, DDC did not fully prevent an ABT-199-induced increase in peroxides or suppress the ABT-199-induced proton leak. Also, peroxide levels in the presence of C6 were not significantly affected. It therefore seems that these inhibitor-induced effects either involve additional SOD-independent redox processes or rely preferentially on activation of mitochondrial SOD. We also observed that glucose notably increased SOD activity in mouse islets, but unlike previous studies on rat islets (37) this response did not reach statistical significance, which possibly reflects species-dependent differences in the activity of the enzyme (45). It has been proposed that SOD may be activated via factors derived from glycolysis or the pentose phosphate pathway (37). Another intriguing possibility is that the effect of glucose and Bcl-2 inhibition on SOD may rely in part on activation of voltage-gated Ca2+ influx, as suggested by the finding that suppression of KATP channels up-regulates SOD in a Ca2+-dependent manner (30).
Unlike the similarities between the effects of glucose and Bcl-2 inhibition on SOD activity and peroxides, we did not detect acute changes in O2 consumption in response to Bcl inhibitors. This was in contrast to the increase in basal OCR that accompanies glucose metabolism (Figure 4A). A second difference was the mitochondrial proton leak current that was activated in β-cells by C6 and ABT-199 but not by glucose (Figure 4, A and B). That the inhibitor-induced proton leak did not result in higher basal OCR is likely because the control of basal respiration is dominated by cellular ATP turnover (32). Nonetheless, the stable basal OCR and the increased proton leak were both unexpected considering that exposure to C6, like glucose, results in mitochondrial hyperpolarization and increased ATP/ADP (19). This suggests that there are key points at which the metabolic effects of glucose and Bcl inhibition diverge, or that C6 activates additional signals that counteract an increase in O2 consumption. Notably, we found that the Bcl-2-regulated leak was prevented by preculture with the GSH precursor and antioxidant NAC, demonstrating that it is secondary to the inhibitor-induced changes in β-cell redox state (Figure 4B). It is known that ROS at physiological levels can induce mitochondrial proton leak through UCPs and the adenine nucleotide translocase (46). Furthermore, the activity of UCP2 is regulated by its glutathionylation (31). In neurons, Bcl-2 has been reported to bind GSH and promote mitochondrial GSH uptake (21). If similar mechanisms operate in β-cells, it would therefore seem possible that Bcl-2 could affect UCP2 via ROS and/or GSH-dependent regulation. In light of this, it is noteworthy that both pharmacological inhibition and gene deletion ruled out a significant contribution from UCP2 in the ABT-199-induced proton leak (Figure 4, C and D). In contrast, we found that the leak was partially prevented by CsA, suggesting it involves the mPTP (Figure 4D). Mitochondrial ROS and Ca2+ overload can trigger prolonged high-conductance mPTP opening associated with a form of programmed necrosis, but because our ABT-199 treatments were not accompanied by β-cell death, the CsA-sensitive leak likely reflects physiological low-conductance pore opening (40). In addition to potential mPTP regulation by ROS, this might involve a recently identified leak current through the c-subunit of the ATP synthase (41, 42), which in neurons is directly regulated by Bcl-xL. This interaction is perturbed by the BH3 mimetic ABT-737 that inhibits Bcl-w, Bcl-xL, and Bcl-2 (47). Unlike ABT-737, the newer derivative ABT-199, which we used here, is highly specific for Bcl-2 (23). Our results thus hint that Bcl-2 might also affect the coupling state of the ATP synthase and the feasibility of this is supported by reports of Bcl-2 localization to the inner mitochondrial membrane (36). Conclusive evidence for direct ATP synthase regulation by Bcl-2, and clarification of the relationship of this with ROS signaling, will require further in-depth studies.
In regards to the control of cell survival, it is interesting that prolonged culture with C6 induced NAC-sensitive β-cell apoptosis, whereas ABT-199 did not increase cell death (Figure 5). This was despite the fact that both similarly increased peroxide levels (Figure 2), suggesting that secondary mechanisms dictate the degree of apoptosis that is activated. C6 antagonizes several antiapoptotic Bcl-2 family members and ABT-199 is specific for Bcl-2. This could mean that Bcl-2, relative to the other prosurvival proteins, plays little role in countering apoptosis in β-cells under oxidative stress. However, given the protection offered islets by Bcl-2 overexpression (11, 14) we believe it is more likely to reflect a significant redundancy in the antiapoptotic capacity of the survival proteins under these conditions.
In summary, we have identified new functions of the antiapoptotic protein Bcl-2 in the moment-to-moment regulation of ROS signaling and mitochondrial physiology of pancreatic β-cells. There is mounting evidence that low levels of ROS act as metabolic coupling factors for insulin secretion, whereas excess ROS is known to result in β-cell oxidative stress. Chronic oxidative stress and endoplasmic reticulum stress both promote loss of Bcl-2 (11, 18). Future studies are therefore warranted to determine whether such reductions in Bcl-2 further perturb redox state and thereby promote a vicious cycle of oxidative stress-induced “preapoptotic” β-cell failure in the pathogenesis of type 2 diabetes.
Acknowledgments
The authors would like to acknowledge the infrastructure support provided through the Child & Family Research Institute (CFRI) Flow Cytometry/FACS Core and the CFRI Islet Isolation Core, as well as the expert technical assistance provided by L. Xu and M. Komba in the FACS and Islet Cores, respectively. We also thank M. Speck (CFRI) and B. Xiang (University of Manitoba) for valuable technical input and assistance.
This work was supported by the Canadian Institutes for Health Research Grant MOP-119537 and the Juvenile Diabetes Research Foundation Grant 2-2013-50 (D.S.L.) and by operating funds from the Manitoba Medical Services Foundation (C.A.D.) and the Children's Hospital Research Institute of Manitoba (C.A.D. and V.W.D.). D.S.L. was also supported by the Canadian Diabetes Association and the Child & Family Research Institute. M.A.-S. was supported by a Child & Family Research Institute Bertram Hoffmeister Postdoctoral Fellowship and a CIHR-BC Transplantation Training Award.
Disclosure Summary: The authors have nothing to disclose.
Abbreviations
- C6
compound 6
- CsA
cyclosporin A
- DDC
diethyldithiocarbamate
- DHE
dihydroethidium
- DMSO
dimethyl sulfoxide
- GSH
glutathione
- H2DCF-DA
2′,7′-dichlorodihydrofluorescein diacetate
- H2O2
hydrogen peroxide
- KATP
ATP-sensitive K+
- mPTP
mitochondrial permeability transition pore
- NAC
N-acetyl-L-cysteine
- OCR
oxygen consumption rate
- PI
propidium iodide
- qPCR
quantitative PCR
- ROS
reactive oxygen species
- SOD
superoxide dismutase
- UCP
uncoupling protein.
