


The mammary glands (MG) undergo rapid expansion of the ductal network during puberty in response to endocrine cues including the potent mitogenic effects of estrogen. The proliferation of mammary epithelial cells occurs in a spatially distinctive manner, where terminal end buds located at the ductal termini are the primary site of cell division. Here, we present a relatively high throughput approach to spatially assess epithelial cell proliferation in whole mouse MG using histochemical detection of 5-ethynyl-2′-deoxyuridine in conjunction with a standard curve-based data deconvolution technique to semiquantitatively measure proliferation via wide-field epifluorescent microscopy. This approach was validated against the “gold standard” of counting labeled nuclei from confocal images utilizing computer-assisted image analysis. Our method proved sensitive enough to describe the significant and spatially variable proliferative response to low-dose estrogen after 108 hours. This flexible method presents a timely and economical approach to obtaining spatial information regarding epithelial cell proliferation in the mouse MG.
Mammary glands (MG) development during puberty is orchestrated by a milieu of endocrine and growth factor cues that stimulate elongation of the mammary ductal network into an adipose stroma (1). A hallmark of this development in the mouse is the formation of terminal end buds (TEBs) at the ductal termini (2). These structures undergo high rates of mitosis in concert with regional apoptosis to yield hollow ducts that extend to the bounds of the mammary fat pad (3). Importantly, TEB have an increased risk for carcinogenic insult, making puberty a sensitive developmental window for breast cancer risk (4). Among the factors regulating ductal growth, estrogen (E) is a major stimulant for mammary epithelial cell (MEC) mitosis and TEB development (2). Moreover, ductal elongation and TEB development represents a sensitive endpoint for assessing the effects of adverse exposures such as environmental chemicals on MG morphogenesis as a surrogate for breast cancer risk (5).
The study of MG responses to genetic and/or environmental perturbation has raised the need for relatively high-throughput, low-cost spatial localization of cell division in the MG. Given that growth of the TEB is not faithfully recapitulated in vitro (6), these structures need to be studied in situ. Confocal microscopy allows for serial sectioning of proliferative zones but has disadvantages including cost, time involved, and field of view. Whole mount analysis has been used widely to study the MG and its spatial arrangement, providing important insights to epithelial morphogenesis (7–9), which typically has relied on stereomicroscopy to image a majority of the mouse MG. Although the MG has been studied extensively using this approach, the resulting preparation that is stained with carmine alum or equivalent has a somewhat limited utility beyond its use for morphological assessment.
To date, most analysis of MG growth in mice during puberty has utilized various combinations of morphometric analysis alongside the separate localization of epithelial cell proliferation in tissue sections (10–12). For this latter approach, immunohistochemical detection of proliferating cell nuclear antigen (13) and Ki67 (14) have served as stalwart readouts of epithelial proliferation. Similarly, in vivo administration of 3H-thymidine (15), 5-bromo-2′-deoxyuridine (16), or 5-ethynyl-2′-deoxyuridine (EdU) (17) have captured cellular proliferation during specific windows. Although a recent report highlighted the detection of EdU in whole mount preparations using data-intensive and expensive high-end confocal imaging (18), most approaches for localizing proliferation have been confined to tissue sections, which limits the field of view and fails to preserve important spatial information. Although great care has been taken in multiple studies to preserve the integrity of spatial information through serial sectioning and staining (19, 20), that approach can be costly, cumbersome, and imperfect.
In the method described here, we combine the relative ease and compatibility of EdU incorporation into dividing cells with staining and whole mount analysis of the MG viewed by stereomicroscopy. This method provides valuable spatial information that cannot be captured by traditional techniques. We further describe a streamlined pipeline for semiquantitative measurement of localized epithelial cell proliferation that is compatible with high throughput.
Materials and Methods
Mice
All procedures were approved by the University of California Davis Institutional Animal Care and Use Committee. Balb/cJ mice (The Jackson Laboratory) were housed under a 14-hour light, 10-hour dark cycle with ad libitum access to water and a modified AIN-93G diet (Teklad Laboratory Animal Diets). Prepubertal female mice were bilaterally ovariectomized (OVX) (21) at 21 or 22 days of age. Mice were assigned to receive either the control or 17β-estradiol (Sigma-Aldrich) treatments orally, commencing 7 days after OVX. Treatment with E began at 8 pm, coincident with the start of the dark cycle when mice are active and consume most food and water (22). A stock solution of E (10 mg/mL in ethanol) was diluted in the drinking water to a final concentration of 200nM (23). Control mice received drinking water containing ethanol vehicle (5.45 ppm). Cohorts of mice (n = 4–9) were euthanized at approximately 8 am by CO2 inhalation followed by cervical dislocation at 12, 36, 60, 84, 108, 132, 156, or 180 hours after treatment initiation. Mice were administered a single bolus of EdU (0.25 mg in 100-μL saline, ip; Life Technologies) at 8 pm, 12 hours before euthanasia.
EdU detection in whole MG
The second and third thoracic MG were excised, spread on a glass slide, and fixed overnight in 10% buffered formalin at 4°C. Tissues were then washed in PBS and stored in 70% ethanol at 4°C before further processing. Samples were stained in carmine alum for 24–48 hours at 4°C to visualize the mammary epithelium that allowed for trimming of muscle and excess stroma under a dissecting microscope, as needed. Samples were defatted in acetone (1 h, room temperature with rocking) before transfer into wells of a 48-well plate. Glands were washed in PBS, permeabilized in PBS-Triton X-100 (0.3%, room temperature, 1 h with rocking), then washed 3 times with PBS. Samples were then incubated in EdU detection cocktail (250 μL per well; Life Technologies) overnight at 4°C, which was then removed before washing with 3 changes of PBS. Tissues were counterstained with 4′,6-diamidino-2-phenylindole (DAPI) (1:1000 in PBS) overnight at 4°C. Samples were cleared in 50% then 75% glycerol in PBS for 1 hour each, then coverslipped in glycerol containing fade-preventing n-propyl-gallate (20 μg/mL; Sigma-Aldrich). Samples for staining were assigned across treatment groups and time points over 7 different staining runs.
Wide-field epifluorescence imaging and analysis
Samples were imaged using an Olympus SZX16 epifluorescent stereomicroscope fitted with a cooled CCD digital camera (QICAM; Q Imaging) and Q Capture Pro 7 software (Q Imaging). Monochrome images of DAPI-stained nuclei were captured at low magnification (Olympus SDF PLAPO 1XPF, 0.7X) (Figure 1, A–D) to visualize the entire ductal network. In order to subsample ductal termini for further analysis, concentric polygons were outlined around the periphery of the ductal network before nominating every other ductal terminus (Figure 1, B and D) for imaging of the DAPI and Alexa Fluor 488 signals at high magnification (Olympus SDF PLAPO 1XPF,11.5X) (Figure 1, E–H). Exposure time (ET) was recorded for all images.
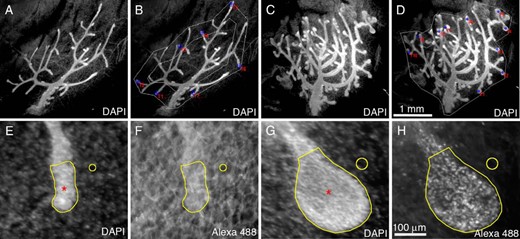
Image acquisition and analysis procedures for semiquantitative determination of epithelial cell proliferation in whole mouse MG. Representative images of whole mouse MG from mice OVX at 21 days of age and treated with either vehicle (A and B and E and F) or 17β-estradiol (200nM in drinking water) (C and D and G and H) for 156 hours. Low-magnification images of whole DAPI-stained MG were captured (A and C), and ductal termini at the leading edge of the ductal network were tagged (B and D) for imaging at higher magnification. Scale bar, 1 mm. Proliferating epithelial cells were detected using Alexa Fluor 488 Click-iT histochemistry for EdU (F and H) against a DAPI counterstain (E and G). Exposure time was recorded for each image acquired. Mean grayscale values (AUs) were measured from a user-defined ROI (red asterisk) for both Alexa Fluor 488 and DAPI images using FIJI. Background mean grayscale values were also recorded (open circle). Scale bar, 100 μm.
A user-defined region of interest (ROI) was manually constructed around each ductal terminus in DAPI images at high magnification (Figure 1, E and G, red asterisk) and was added to the ROI manager in FIJI software (24). Stromal background was defined from a region adjacent to the epithelium (Figure 1, E and G, yellow circle) and added to the ROI manager. Mean grayscale measurements (arbitrary units [AUs]) were recorded for both the ductal terminus and stromal background. The corresponding AU was recorded for the user-defined ROIs created using the DAPI image in the corresponding Alexa Fluor 488 image (Figure 1, F and H). In this way, AU for both DAPI and Alexa Fluor 488 was recorded for user-defined ROIs representing ductal termini and stromal background.
Imaging and modeling of fluorescent standards
InSpeck Green (505/515) and Blue (350/440) Microscope Image Intensity Calibration beads (Thermo Fisher Scientific) were spotted onto glass slides according to the manufacturer’s specifications. A total of 7 slides were prepared for both bead sets so each of the EdU staining runs had its own standard slides. Green beads at 100%, 30%, 10%, 3%, 1%, and 0.03% relative intensity (RI) and blue beads at 100%, 30%, 10%, 3%, and 1% RI were imaged at high magnification (×11.5) at 5–6 different ET spanning near-saturated to near-absent signal (Figure 2A). Otsu thresholding was applied in FIJI (24), and AU was measured for the thresholded area. In this way, for each RI, corresponding AU and ET was recorded and assimilated into a spreadsheet for each of the 7 green and blue standard curves. The relationship between AU and ET with RI was described by the following model (Figure 2B):
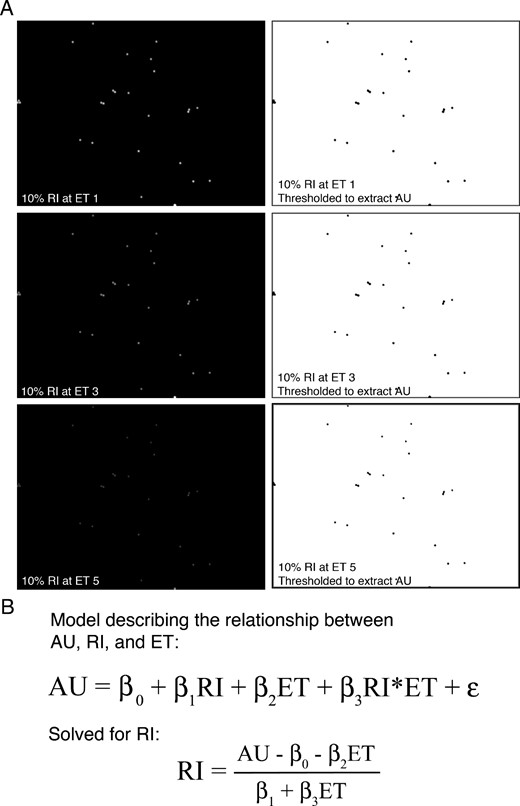
Quantification of RI using a standard curve derived from InSpeck fluorescent beads. A, Representative images of InSpeck fluorescent beads (green) having 10% RI. Images were captured at 5–6 different ETs ranging from near-saturated to near-absent signal. Representative images depicting high (ET1), intermediate (ET3), and low (ET5) signal are shown in A. Thresholding was applied to these images, and mean grayscale values (AUs) were measured using FIJI. B, Regression model describing the relationship between AU, ET, and RI, including random error (ϵ). Known RI and ET, along with measured AU from the InSpeck fluorescent bead standards, allows for extraction of regression coefficients (β). The model can then be algebraically solved for RI, enabling the calculation of RI for any image where ET and AU are known.
Reworking this model enabled the prediction of RI for each combination of AU and ET (Figure 2B).
Regression analysis of n = 7 independent standard curves returned adjusted R2 values ranging from 0.92 to 0.97 for green fluorescence and 0.76–0.84 for blue fluorescence.
Fluorescent standard curve-based data deconvolution
Estimated coefficients (β0, β1, β2, and β3) were extracted from regressions for each standard curve preparation, and subsequent rapid data deconvolution was accomplished using simple coding in R (25). Based upon measured AU and ET, a predicted RI for ductal termini and stromal background was determined. Each ductal terminus RI was adjusted for stromal background by subtraction for both the DAPI and Alexa Fluor 488 images. Calculated RI for all ductal termini per animal were averaged to determine overall mean RI. Mean green RI (EdU-positive mitotic cells) was expressed relative to the corresponding mean blue RI (DAPI-positive nuclei).
Confocal microscopy and count validation
To validate the standard curve-based approach across a range of proliferation levels, we imaged ductal termini (n = 3/gland) from mice treated with E for 12, 84, or 156 hours (n = 4/time point), corresponding to low, medium, and high levels of EdU incorporation, respectively (representative image in Figure 3B). Images were captured using a Leica TCS SP8 STED 3× high sensitivity confocal microscope under ×20 oil magnification (Figure 3B). Individual nuclei were counted using Imaris software (Bitplane AG). Briefly, a mask was applied to the image to direct quantification of nuclei only in the ductal termini. Count data for DAPI- and Alexa Fluor 488-labeled nuclei were extracted from the masked area under the blue and green channels, respectively, using the “spots” tool (Figure 3C), with additional filtering for the blue channel, thereby ensuring that counted “green” nuclei corresponded to “blue” nuclei. Count data were expressed as the ratio of green to blue nuclei, and averages over each of 3 ductal termini were calculated for each biological replicate.
![Semiquantitative analysis of epithelial cell proliferation using wide-field stereomicroscopy and standard curve-based data deconvolution validates against count-based data collected using confocal microscopy. Representative images of a TEB from a whole thoracic MG from a mouse OVX at 21 days of age then treated with 17β-estradiol (200nM in drinking water) for 156 hours. Images were captured using wide-field epifluorescent stereomicroscopy (A) or confocal microscopy (B). Proliferating epithelial cells labeled with EdU (green) were detected using Alexa Fluor 488 Click-iT histochemistry against a DAPI counterstain (blue). Scale bar, 50 μm. C, Confocal images were analyzed using Imaris image analysis software, enabling the automated quantification of green and blue nuclei. D, Plot of mean green to blue nuclear counts from confocal images (primary y-axis) and mean green to blue RI from wide-field images (secondary y-axis) for mice administered 17β-estradiol (200nM in drinking water) for either 12, 84, or 156 hours; n = 4 biological replicates with 3 subsamples per group. E, Log[green to blue (RI), y-axis] representing data that was deconvoluted from InSpeck fluorescent bead standard curves was regressed against Log[green to blue (count), x-axis] quantified using Imaris. Each data point is an average of 3 subsamples for a single animal (n = 12). Linear regression was significant (P < .05).](https://oup.silverchair-cdn.com/oup/backfile/Content_public/Journal/endo/157/10/10.1210_en.2016-1480/2/m_zee0101686460003.jpeg?Expires=1747893389&Signature=uF8kMyRECtaunU4K-ZxEtltga8WTRU788xgQlsfOMbV7Y~AdSL5AQtsS~3AA~pH-9eVALXaKg8m8-1evrOB5tvFyutPQQJFj550bF~yKNZLhDBGc3T7qMgY~n-9Er8lZVEFfkPdQaaUUjgogNbQ62hLBhil4zQ1eD3KwECZT1KIJ8EG6TJ7OgMdb46oiaao63iA-K~EGjynJ2EL4g4jFFx6BJAGJiG~WtQv6EurSULZVHbO7kBHH0K1LMSjcJHGL5B5FUkGKs00BWcEywLxD7lUno2SlwocD0KaFx6SeanJjBWRymGJFjSECyaxg9QA95MEWtttSSZ33blIqe1dH2w__&Key-Pair-Id=APKAIE5G5CRDK6RD3PGA)
Semiquantitative analysis of epithelial cell proliferation using wide-field stereomicroscopy and standard curve-based data deconvolution validates against count-based data collected using confocal microscopy. Representative images of a TEB from a whole thoracic MG from a mouse OVX at 21 days of age then treated with 17β-estradiol (200nM in drinking water) for 156 hours. Images were captured using wide-field epifluorescent stereomicroscopy (A) or confocal microscopy (B). Proliferating epithelial cells labeled with EdU (green) were detected using Alexa Fluor 488 Click-iT histochemistry against a DAPI counterstain (blue). Scale bar, 50 μm. C, Confocal images were analyzed using Imaris image analysis software, enabling the automated quantification of green and blue nuclei. D, Plot of mean green to blue nuclear counts from confocal images (primary y-axis) and mean green to blue RI from wide-field images (secondary y-axis) for mice administered 17β-estradiol (200nM in drinking water) for either 12, 84, or 156 hours; n = 4 biological replicates with 3 subsamples per group. E, Log[green to blue (RI), y-axis] representing data that was deconvoluted from InSpeck fluorescent bead standard curves was regressed against Log[green to blue (count), x-axis] quantified using Imaris. Each data point is an average of 3 subsamples for a single animal (n = 12). Linear regression was significant (P < .05).
Statistics
Mean green to blue RI for each sample was analyzed as a randomized complete block design using the PROC GLM procedure in SAS with blocking by staining batch. Regression analysis of mean green to blue count data generated from confocal images against mean green to blue RI was performed using the PROC REG procedure in SAS. Data were transformed where appropriate. Frequency histograms with overlaid density plots were created using the geom_histogram and geom_density functions in the ggplot2 (26) package for R (25).
Results
Validation of wide-field image analysis
Enumeration of the frequency of dividing nuclei is generally considered the “gold standard” for quantifying the proliferation of epithelial cells within the MG. We compared predicted RI (as a read-out of epithelial cell proliferation) for ductal termini obtained from the deconvolution of fluorescent standard curve-based data (representative image Figure 3A) against nuclear counts from confocal images obtained using computer-assisted image analysis (Figure 3). Confocal count-based quantification was more sensitive at lower levels of proliferation, reflecting that the standard curve-based approach for wide-field analysis was impacted more by background fluorescence (Figure 3D). By regressing mean Log(Green:Blue) nuclear count obtained from analysis of confocal images for each sample against the corresponding Log(Green:Blue) RI obtained using the standard curve-based approach, we established that there was a significant linear relationship (P < .05, adjusted R2 = 0.63) (Figure 3E). These results indicate that fluorescent standard curve-based quantification of wide-field images validates against widely accepted nuclear counting for the assessment of MEC proliferation.
Quantification of E-induced proliferation in mammary ductal termini
Exogenous E is a potent stimulator of epithelial mitosis and TEB development in OVX females (2). We assessed MEC proliferation in the ductal termini of OVX prepubertal mice and the response to oral low-dose E. As measured by RI, there was a numerical increase in MEC proliferation in the ductal termini after 84 hours of E, whereas the difference became statistically significant relative to the age-matched control after 108 hours (Figure 4B). Proliferation of MEC in the ductal termini continued to be significantly increased at 132, 156, and 180 hours after E treatment (Figure 4B), localizing primarily to TEB (Figure 4A). Finally, proliferation tended to be spatially restricted to TEB at the leading edges of the ductal network (Figure 4A), although termini varied substantially in their proliferative response. This variation and its change in response to exogenous E was illustrated by frequency histograms with overlaid density plots for individual termini RI at each time point (Figure 4C).
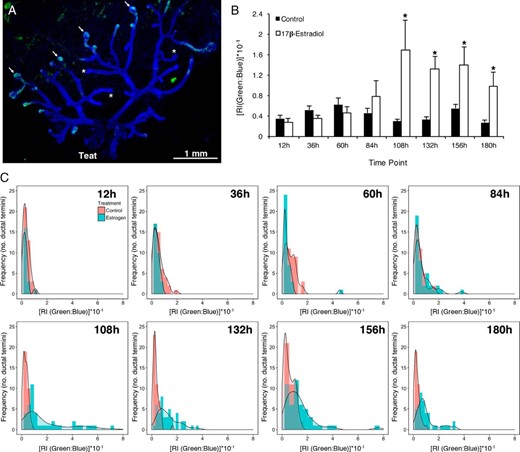
Estrogen stimulates epithelial cell proliferation in the ductal termini of whole mouse MG. A, Representative image a whole MG from a mouse OVX at 21 days of age then administered 17β-estradiol in the drinking water (200nM) for 156 hours. Proliferating epithelial cells were detected by EdU histochemistry (green), with DAPI overlay (blue). Arrows indicate proliferative TEBs. Asterisks indicate termini with a low level of proliferation. B, Relative fluorescence intensity was quantified using FIJI, and data were deconvoluted using a standard curve-based approach and expressed as the ratio of green to blue fluorescence. Data are mean green to blue ratio ± SEM; n = 4–9/time points per group; *, P < .05 vs control within a time point. C, Frequency histograms for RI of individual termini, with overlaid density plots, at various time points following treatment with vehicle or 17β-estradiol (n = 27–56 termini/group per time point).
Discussion
Here, we outline a straight-forward method for quantifying and localizing cell proliferation within the ductal network of the MG in peripubertal mice that has several advantages over previous approaches. First, an ability to localize cell proliferation across the entire ductal network allows for the determination of regional differences and responses, as occurs in response to E when TEB develop and proliferate at some, but not all, ductal termini. By contrast, immunohistochemical and autoradiographic methods require the subsampling of regions within the gland (during sample excision or sectioning) or structures (by microdissection). Alternatively, spatial information can be gathered by immunostaining serial sections followed by three dimensional reconstruction, as was used for the MG of EdU-labeled mice (19) and 5-bromo-2′-deoxyuridine-labeled heifers (20). Although informative, this approach can be cumbersome, time consuming, prone to sectioning challenges, and costly. Thus, in many instances important spatial information can be lost or overlooked. Our method addresses many of these issues in a time- and cost-effective manner. Furthermore, once proliferative regions or structures are identified in EdU-labeled whole mounts, they can be further and promptly microdissected given their mounting in aqueous medium. Beyond these benefits, data deconvolution can be performed in readily available open-source software, allowing for an economically viable alternative to advanced image analysis software packages.
Our method helps to address a need to quantify cell proliferation changes in the MG in response to stimuli, whether they be endocrine or environmental. A key element of this method is the integration of internal calibration standards that allows relative amounts of fluorescence, and hence regions of mitotic activity, to be quantified. Generally speaking, epifluorescent wide-field stereomicroscopy of EdU-labeled MG whole mounts is unable to provide resolution to the single cell level, a limitation that can be overcome by confocal imaging (18, 27). Others have demonstrated that traditional mammary whole mount preparation methods can be adapted to confocal (28) and multiphoton microscopy (29) to facilitate the detailed resolution of parenchymal morphology. Our validation strategy confirms that compared with confocal imaging, the measure of proliferation was relatively similar using the 2 approaches. As a caveat, our method does not appear to be as sensitive at low levels of proliferation, likely because of a greater impact of background fluorescence. That said, even confocal microscopy struggles at the greater tissue depths required to image TEB due to nuclear density and laser penetration. An additional consideration regarding the internal standard curve-based approach for wide-field epifluorescent microscopy is the potential for variation across labs and equipment. Thus, validation should be performed for each application, and caution should be used when comparing absolute values derived from different instrumentation configurations.
In summary, this method presents an economical, higher throughput approach to obtaining targeted and quantitative spatial information using wide-field epifluorescent microscopy. The approach described here has broad application for the study of MG development and efforts to define the genetic and environmental factors regulating it.
Acknowledgments
We thank the Department of Animal Science Small Animal Colony manager Sandra Weisker and student staff. We also thank undergraduate intern Heather Yee for her assistance.
This work was supported by National Institutes of Health National Cancer Institute Ruth L Kirschstein National Research Service Award F31 CA189421 (to G.E.B.).
Disclosure Summary: The authors have nothing to disclose.
Abbreviations
- AU
arbitrary unit
- E
estrogen
- EdU
5-ethynyl-2′-deoxyuridine
- ET
exposure time
- DAPI
4′,6-diamidino-2-phenylindole
- MEC
mammary epithelial cell
- MG
mammary glands
- OVX
ovariectomized
- RI
relative intensity
- ROI
region of interest
- TEB
terminal end bud.
