


Abstract
It is increasingly recognized that vitamin D deficiency is associated with increased risks of metabolic disorders among overweight children. A recent study showed that vitamin D deficiency exacerbated inflammation in nonalcoholic fatty liver disease through activating toll-like receptor 4 in a high-fat diet (HFD) rat model. The present study aimed to further investigate the effects of vitamin D deficiency on HFD-induced insulin resistance and hepatic lipid accumulation. Male ICR mice (35 d old) were randomly assigned into 4 groups as follows. In control diet and vitamin D deficiency diet (VDD) groups, mice were fed with purified diets. In HFD and VDD+HFD groups, mice were fed with HFD. In VDD and VDD+HFD groups, vitamin D in feed was depleted. Feeding mice with vitamin D deficiency diet did not induce obesity, insulin resistance, and hepatic lipid accumulation. By contrary, vitamin D deficiency markedly alleviated HFD-induced overweight, hyperinsulinemia, and hepatic lipid accumulation. Moreover, vitamin D deficiency significantly attenuated HFD-induced up-regulation of hepatic peroxisome proliferator-activated receptor γ, which promoted hepatic lipid uptake and lipid droplet formation, and its target gene cluster of differentiation 36. In addition, vitamin D deficiency up-regulated carnitine palmitoyltrans 2, the key enzyme for fatty acid β-oxidation, and uncoupling protein 3, which separated oxidative phosphorylation from ATP production, in adipose tissue. These data suggest that vitamin D deficiency is not a direct risk factor for obesity, insulin resistance, and hepatic lipid accumulation. Vitamin D deficiency alleviates HFD-induced overweight, hyperinsulinemia, and hepatic lipid accumulation through promoting fatty acid β-oxidation and elevating energy expenditure in adipose tissue.
Nonalcoholic fatty liver disease (NAFLD) is gaining increasing recognition as a component of the epidemic of obesity in China (1). Hepatic excessive triglyceride (TG) accumulation is the hallmark of NAFLD (2). The spectrum of NAFLD ranges from simple fatty liver to a potentially progressive form, nonalcoholic steatohepatitis, which may lead to hepatic fibrosis and cirrhosis (3). Although high-fat and high-fructose diets, obesity and insulin resistance are recognized as risk factors for the incidence of NAFLD (2, 4, 5), other significant factors leading to NAFLD remain to be identified.
Vitamin D is essential for the maintenance of calcium homoeostasis, with severe vitamin D deficiency in children resulting in the occurrence of rickets (6). Vitamin D deficiency, defined as lower than 50 nmol/L for 25-hydroxyvitamin D (25[OH]D), is increasingly recognized as a public health problem (7). Indeed, vitamin D deficiency is highly prevalent in overweight and obese children (8). It is increasingly recognized that vitamin D deficiency is associated with an increased risk of metabolic disorders, including insulin resistance and NAFLD among overweight children (9–11). According to several recent reports, vitamin D deficiency was linked with NAFLD independent of obesity (12, 13). A recent study found that vitamin D deficiency exacerbated inflammation in the pathogenesis of NAFLD through activation of toll-like receptor 4 in a high-fat diet (HFD) rat model (14). Nevertheless, it needs to be further demonstrated whether vitamin D deficiency exacerbates HFD-induced obesity, insulin resistance, and hepatic lipid accumulation in different animal models.
The aim of the present study is to investigate whether vitamin D deficiency directly induces obesity, insulin resistance, and hepatic lipid accumulation. In addition, we are to further explore whether vitamin D deficiency exacerbates HFD-induced obesity, insulin resistance, and hepatic lipid accumulation. Our results demonstrate that vitamin D deficiency does not directly cause obesity, insulin resistance, and hepatic lipid accumulation in male mice. Unexpectedly, vitamin D deficiency alleviates HFD-induced overweight, hyperinsulinemia, and hepatic lipid accumulation in male mice.
Materials and Methods
Animals and treatments
Young male ICR mice (5 wk old) were purchased from Beijing Vital River, whose foundation colonies were all introduced from Charles River Laboratories, Inc. The animals were allowed free access to food and water at all times and were maintained on a 12 hours light/dark cycle in a controlled temperature (20°C–25°C) and humidity (50 ± 5%) environment. Mice were randomly assigned into 4 groups (20 animals each group) as follows. In control diet (CD) group, mice were fed with purified diet (15). In vitamin D deficiency diet (VDD) group, mice were fed with CD, in which vitamin D was depleted. In HFD group, mice were fed with HFD. In VDD+HFD group, mice were fed with HFD, in which vitamin D was depleted (14, 16). In CD and HFD groups, vitamin D content was normal (1000-IU vitamin D3/3606 kcal). In VDD and VDD+HFD groups, vitamin D was depleted (25-IU vitamin D3/3606 kcal) and the UV section of light (290–315 nm) was filtered from the room (14, 17). As expected, serum 25(OH)D were reduced to less than 5 ng/mL in VDD and VDD+HFD groups (0.46 ± 0.24 and 1.32 ± 0.45 ng/mL, respectively), significantly lower than those in CD and HFD groups (16.65 ± 2.65 and 13.77 ± 0.94 ng/mL, respectively). All diets were purchased from TROPHIC Animal Feed High-tech Co Ltd. Food composition in different groups is shown in Supplemental Table 1. Total sugars, total fat, total protein, total calories, calorie from fat and vitamin D3 content are shown in Supplemental Table 2. Mice were inspected daily for food intake and weighted weekly. Four weeks after diet intervention, fasting blood glucose was measured every 2 weeks. Glucose tolerance test (GTT) and insulin tolerance test (ITT) were assessed 12 weeks after diet intervention. Fourteen weeks after diet intervention, mice were anesthetized with phenobarbital sodium (50 mg/kg) and killed. Serum was collected for 25(OH)D level and biochemical parameters. Liver tissue was collected for immunoblot, real-time RT-PCR, and hepatic TG measurement or fixed in 4% paraformaldehyde for histology. Perinephric and epididymis fats were collected for real-time RT-PCR. This study was approved by the Association of Laboratory Animal Sciences and the Center for Laboratory Animal Sciences at Anhui Medical University. All procedures on animals followed the guidelines for humane treatment set by the Association of Laboratory Animal Sciences and the Center for Laboratory Animal Sciences at Anhui Medical University.
Serum 25(OH)D
Serum 25(OH)D was measured by a RIA kit (DiaSorin) with 125I labeled 25(OH)D as a tracer. The quality and reproducibility were determined using the quality controls provided with the kits. Two controls (low control, 14.0 ng/mL; high control, 53.8 ng/mL) were provided, and the coefficient of variation for all kits used was 15.97% for the low control and 12.68% for the high control. The controls fell within the acceptable range given by the manufacturer.
GTT and ITT
GTT was performed after overnight fasting. For GTT, mice were ip injected with a single dose of glucose (2.0 g/kg) and blood glucose was measured using a glucometer (Roche Accu-Chek Inform) at different time points after glucose injection. ITT was performed after 4 hours fasting. For ITT, mice were ip injected with a single dose of insulin (0.75 U/kg; Becton Dickinson and Co) and blood glucose was measured using a glucometer (Roche Accu-Chek Inform) at different time points after insulin injection. Mice were allowed to recover for at least 4 days between tests.
Immunoblots
Mice were fasted for 8 hours and ip injected with recombinant insulin (1.0 U/kg). Mice were killed 5 minutes after insulin injection. Liver tissue was homogenized in ice-cold lysis buffer (50mM Tris-HCl [pH 7.4], 150mM NaCl, 1mM EDTA, 1% Triton X-100, 1% sodium deoxycholate, 0.1% sodium dodecyl sulfate, and 1mM phenylmethanesulfonyl fluoride) supplemented with 1% cocktail of protease inhibitors (Sigma) and centrifuged at 14 000g for 10 minutes at 4°C. The supernatant was collected for immunoblots. Protein was separated by 12.5% sodium dodecyl sulfate-polyacrylamide gel (Amresco) electrophoresis and transferred onto a polyvinylidene fluoride membrane. The membranes were incubated for 2 hours with either anti-protein kinase B (Akt) or phospho-Akt-Ser473 antibody. After washes in Dulbecco's phosphate-buffered saline containing 0.05% Tween 20, the membranes were incubated with goat antirabbit IgG antibody for 2 hours. The membranes were washed in Dulbecco's phosphate-buffered saline containing 0.05% Tween 20, followed by signal development using an enhanced chemiluminescence detection kit (Pierce Biotechnology).
Isolation of total RNA and real-time RT-PCR
Total RNA was extracted using TRI reagent (Molecular Research Center). Ribonuclease-free deoxyribonuclease-treated total RNA (1.0 μg) was reverse-transcribed with Aves myeloblast leukemia virus reverse transcriptase (Promega). Real-time RT-PCR was performed with a LightCycler 480 SYBR Green Imasterq PCR mix (Roche) using gene-specific primers as listed in Supplemental Table 3. The amplification reactions were carried out on a LightCycler 480 Instrument (Roche Diagnostics GmbH) with an initial hold step (95°C for 5 min) and 50 cycles of a 3-step PCR (95°C for 15 s, 60°C for 15 s, and 72°C for 30 s). The comparative cycle threshold method (18) was used to determine the amount of target, normalized to an endogenous reference (Gapdh) and relative to a calibrator using the LightCycler 480 software (version 1.5.0; Roche). All RT-PCR experiments were performed in triplicate.
Biochemical parameters
Serum TG, total cholesterol, very low density lipoprotein (VLDL) cholesterol, and alanine transaminase were determined by routine laboratory methods using an autoanalyzer (Modular DPP, number 1549-06; Roche). Serum insulin level was determined by Insulin ELISA kit (Millipore).
Histological examination
Formalin fixed liver sections were stained with hematoxylin and eosin to evaluate hepatic lipid accumulation. Histological scoring (14, 19) was performed by a blinded hepatopathologist for steatosis (score 0–3), lobular inflammation (score 0–3), and ballooning (score 0–2). The basis for the scoring is shown in the Supplemental Table 4 (19).
Hepatic TG measurement
Hepatic TG was extracted using a slight modification method developed by Bligh and Dyer (20). Briefly, liver samples were homogenized in ice-cold 2× PBS. TG was extracted with methanol/chloroform (1:2), dried, and resuspended in 5% fat-free BSA. Hepatic TG was measured using the TG reagent kit (Zhejiang Dongou Diagnostics Co, Ltd) according to manufacturer's protocol. Hepatic TG content was expressed as μmol/g liver.
Oil Red O staining
Frozen sections of liver (10 μm) were stained with Oil Red O and counterstained with hematoxylin. Representative photomicrographs were captured at ×200 magnification using a system incorporated in the microscope.
Statistical analysis
Normally distributed data were expressed as mean ± SEM. For analyses of different dietary effects, comparisons were made by two-way ANOVAs using the HFD and the VDD factors of different groups. One-way ANOVA and the Student-Newmann-Keuls post hoc test were used to determine differences among different groups. For histological features, Student's t tests were used to compare between HFD group and VDD+HFD group. Time data were tested by repeated measures ANOVA. Further comparison between 2 groups used Least Significant Difference (LSD) post hoc test. P < .05 was considered statistically significant.
Results
Food and caloric intakes and body weight growth
No significant difference on body weight growth was observed between CD- and VDD-fed mice. HFD-fed mice showed a significantly accelerated elevation of body weight (Figure 1A). Unexpectedly, compared with HFD group, VDD+HFD group presented a notably slower increase of body weight (Figure 1A, left), although no significant difference was observed between HFD group and VDD+HFD group 14 weeks after diet intervention (Figure 1A, right). The effects of vitamin D deficiency on food and caloric intakes were analyzed. There was a slight elevation of food intakes in VDD-fed mice. Moreover, a marked elevation of food intakes was observed in VDD+HFD group as compared with HFD group (Figure 1B). Correspondingly, there was a slight elevation of caloric intakes in VDD-fed mice. In addition, a marked elevation of caloric intakes was observed in VDD+HFD group as compared with HFD group (Figure 1C).
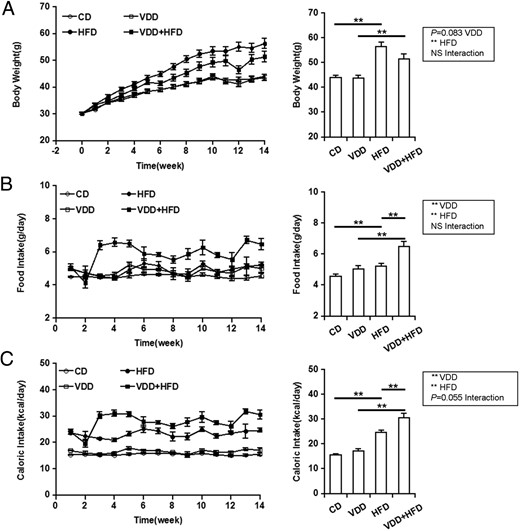
Effects of vitamin D deficiency on body weight growth and food and caloric intakes. A, Body weight. Left, P < .001 (repeated measures ANOVA). NS, CD vs VDD; P < .001, CD vs HFD; P < .01, VDD vs VDD+HFD; P < .01, HFD vs VDD+HFD (LSD post hoc test). Right, Data of the endpoint of the experiment. B, Food intake. Left, P < .001 (repeated measures ANOVA). P < .001, CD vs VDD; P < .001, CD vs HFD; P < .001, VDD vs VDD+HFD; P < .001, HFD vs VDD+HFD (LSD post hoc test). Right, Data of the endpoint of the experiment. C, Caloric intake. Left, P < .001 (repeated measures ANOVA). P < .01, CD vs VDD; P < .001, CD vs HFD; P < .001, VDD vs VDD+HFD; P < .001, HFD vs VDD+HFD (LSD post hoc test). Right, Data of the endpoint of the experiment. All data were expressed as mean ± SEM (n = 20). NS, nonsignificant. **, P < .01.
Hepatic and circulating lipids
As expected, liver weight was increased in HFD group, whereas no difference on liver weight was observed between VDD- and CD-fed mice (Figure 2A). Unexpectedly, HFD-induced elevation of liver weigh was attenuated when vitamin D in feed was depleted. The effects of vitamin D deficiency on hepatic TG content and hepatic lipid accumulation were analyzed. As expected, hepatic TG content was significantly increased in HFD-fed mice (Figure 2B). Histopathology showed that hepatic lipid accumulation was observed in HFD-fed but not in CD-fed mice (Figure 2C). HFD-induced hepatic lipid accumulation was further demonstrated by Oil Red O staining (Figure 2D). Vitamin D deficiency did not affect hepatic TG content. Unexpectedly, HFD-induced elevation of hepatic TG content was attenuated when vitamin D in feed was depleted (Figure 2B). Correspondingly, HFD-induced hepatic lipid accumulation was alleviated in VDD+HFD-fed mice (Figure 2, C and D, and Table 1). Finally, the effects of vitamin D deficiency on serum lipids were analyzed. No difference was observed in serum TG and VLDL cholesterol among different groups (Table 2).
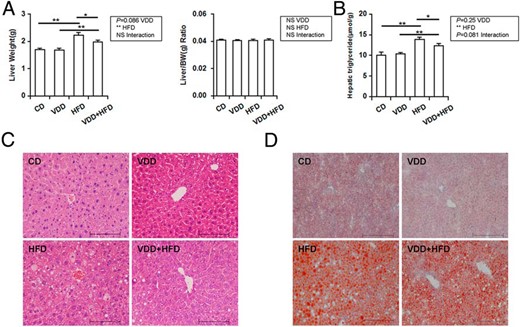
Effects of vitamin D deficiency on hepatic TG content and hepatic lipid accumulation. A, Liver weight. B, Hepatic TG content. C, Liver sections were stained with hematoxylin and eosin (original magnification, ×200). D, Liver sections were stained with Oil Red O (original magnification, ×200). Data were expressed as mean ± SEM (n = 20). NS, nonsignificant. *, P < .05; **, P < .01.
Histology Scores in Different Dietary Groups
| CD | VDD | HFD | VDD+HFD | |
|---|---|---|---|---|
| Liver fat score | n.d. | n.d. | 1.80 ± 0.29 | 1.00 ± 0.18a |
| Lobular inflammation score | n.d. | n.d. | 1.50 ± 0.18 | 0.90 ± 0.16a |
| Ballooning score | n.d. | n.d. | 0.80 ± 0.17 | 0.30 ± 0.11a |
| NAFLD activity score | n.d. | n.d. | 4.10 ± 0.58 | 2.20 ± 0.35a |
n = 10/group. n.d., not detected.
P < .05 HFD vs VDD+HFD.
Serum Biochemical Parameters
| CD | VDD | HFD | VDD+HFD | P Value | |||
|---|---|---|---|---|---|---|---|
| VD | HFD | VD×HFD | |||||
| TGs (mmol/L) | 1.59 ± 0.41 | 1.07 ± 0.12 | 1.47 ± 0.12 | 1.27 ± 0.15 | NS | NS | NS |
| Total cholesterol (mmol/L) | 5.11 ± 0.08 | 4.15 ± 0.28 | 5.34 ± 0.38 | 6.50 ± 0.38b | NS | <.01 | <.01 |
| VLDL cholesterol (mmol/L) | 0.60 ± 0.15 | 0.40 ± 0.04 | 0.55 ± 0.04 | 0.47 ± 0.05 | NS | NS | NS |
| Alanine transaminase (IU/L) | 31.40 ± 1.99 | 30.00 ± 2.92 | 46.00 ± 10.92 | 40.00 ± 8.56 | NS | NS | NS |
| Calcium (mmol/L) | 2.56 ± 0.04 | 2.61 ± 0.05 | 2.58 ± 0.02 | 2.60 ± 0.07 | NS | NS | NS |
| Adiponectin (μg/mL) | 16.75 ± 2.01 | 10.98 ± 1.01c | 11.09 ± 0.96a | 9.93 ± 0.65 | <.05 | <.05 | .089 |
| Leptin (ng/mL) | 15.89 ± 4.53 | 14.62 ± 3.23 | 18.11 ± 3.18 | 24.93 ± 3.70 | NS | 0.099 | NS |
| Insulin (ng/mL) | 0.70 ± 0.10 | 0.36 ± 0.06c | 2.66 ± 0.44a | 1.50 ± 0.21b, d | <.01 | <.001 | NS |
n = 20/group. NS, nonsignificant.
P < .05 CD vs HFD.
P < .05 VDD vs VDD+HFD.
P < .05 CD vs VDD.
P < .05 HFD vs VDD+HFD.
Hepatic lipid-related genes
The effects of vitamin D deficiency on genes for hepatic fatty acid synthesis were analyzed (Figure 3A). Vitamin D deficiency had no effect on hepatic sterol-regulated element-binding protein (Srebp)-1, a transcription factor that regulates the expression of the enzymes for fatty acid synthesis. Accordingly, vitamin D deficiency did not affect the expression of hepatic Fasn, Acc, and Scd-1, 3 downstream target genes of Srebp-1. The effects of vitamin D deficiency on genes for hepatic lipid transport were then analyzed (Figure 3B). As expected, hepatic peroxisome proliferator-activated receptor (Ppar)γ and its downstream target gene Cd36 were significantly up-regulated in HFD-fed mice. Although no difference on hepatic Fabp1, another gene for hepatic fatty acid uptake, was observed among different groups, hepatic Apob and Mttp, 2 genes for assembly of VLDL, were significantly down-regulated in HFD-fed mice. Unexpectedly, HFD-induced up-regulation of hepatic Pparγ, and Cd36 was attenuated in VDD+HFD group. Finally, the effects of vitamin D deficiency on hepatic lipolysis-related genes were analyzed (Figure 3C). As expected, hepatic carnitine palmitoyltrans (Cpt)-1α and Cyp4a10, 2 key genes for fatty acid oxidation, were down-regulated in HFD-fed mice. Of interest, vitamin D deficiency had little effect on hepatic lipolysis-related genes.
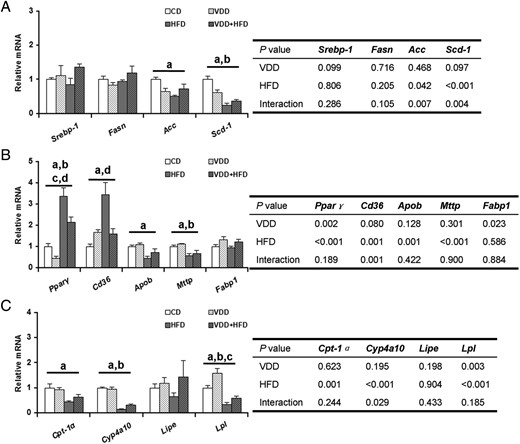
Effects of vitamin D deficiency on the expression of hepatic lipid-related genes. A, Genes for hepatic fatty acid synthesis. B, Hepatic genes for lipid transport. C, Hepatic lipolysis-related genes. Data were expressed as mean ± SEM (n = 6). Fasn, fatty acid synthase; Acc, acetyl-Coenzyme A carboxylase; Scd-1, stearoyl-CoA desaturase-1; Cd36, cluster of differentiation 36; Apob, apolipoprotein b; Mttp, microsomal triglyceride transfer protein; Fabp1, fatty acid-binding protein 1; Cyp4a10, cytochrome P450, family 4, subfamily a, polypeptide 10; Lipe, hormone sensitive lipase; Lpl, lipoprotein lipase. a, P < .05 CD vs HFD; b, P < .05 VDD vs VDD+HFD; c, P < .05 CD vs VDD; d, P < .05 HFD vs VDD+HFD.
Fasting blood glucose and serum insulin
As shown in Figure 4A, no significant difference on fasting blood glucose level was observed between VDD- and CD-fed mice. The effects of vitamin D deficiency on HFD-induced elevation of fasting blood glucose were analyzed. As expected, fasting blood glucose was significantly higher in HFD group compared with CD group. Unexpectedly, there was a downward trend on fasting blood glucose in VDD+HFD group as compared with HFD group (P = .06) (Figure 4A, left). The effects of vitamin D deficiency on serum insulin were then analyzed. As expected, there was a marked increase in the level of serum insulin in HFD group as compared with CD group. Of interest, there was a significant reduction on serum insulin levels 14 weeks after diet intervention in VDD group as compared with CD group. Similarly, vitamin D deficiency reduced serum insulin levels in HFD-fed mice (Table 2).
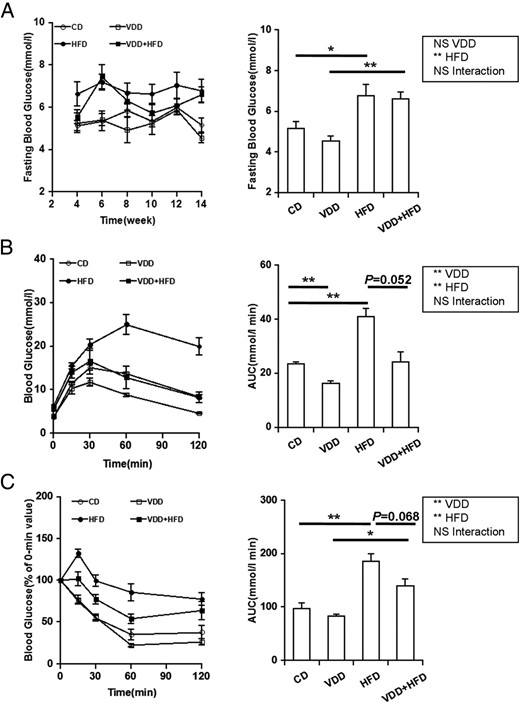
Effects of vitamin D deficiency on fasting blood glucose, glucose tolerance, and insulin tolerance. A, Fasting blood glucose was measured every 2 weeks (n = 20). Left, P < .001 (repeated measures ANOVA). NS, CD vs VDD; P < .001, CD vs HFD; P < .001, VDD vs VDD+HFD; P = .06, HFD vs VDD+HFD (LSD post hoc test). Right, Data of the endpoint of the experiment. B and C, GTT and ITT were performed 12 weeks after diet intervention. Data were expressed as mean ± SEM (n = 6). NS, nonsignificant. *, P < .05; **, P < .01.
Glucose tolerance and insulin tolerance
The effects of vitamin D deficiency on glucose tolerance were analyzed 12 weeks after diet intervention using GTT. Blood glucose levels were significantly increased among all groups in response to glucose injection. Compared with the control mice, HFD-fed mice presented a significant elevation of the glucose area under the curve (AUC) during the GTT. Unexpectedly, the glucose AUC was markedly reduced in VDD group as compared with CD group. Moreover, there was a downward trend on the glucose AUC during the GTT in VDD+HFD group as compared with HFD group (Figure 4B). The effects of vitamin D deficiency on insulin tolerance were analyzed 12 weeks after diet intervention using ITT. Blood glucose levels were significantly decreased among all groups in response to insulin injection. Compared with CD-fed mice, HFD-fed mice presented a significant increase in the glucose AUC during the ITT. Interestingly, there was a downward trend on the glucose AUC during the ITT in VDD+HFD group as compared with HFD group (Figure 4C).
Hepatic insulin signal transduction
To investigate the effects of vitamin D deficiency on insulin signal transduction in mice, hepatic phosphorylated Akt (pAkt) and Akt were measured (for antibodies, please see Table 3). Although hepatic Akt protein did not differ among different groups, hepatic pAkt level was increased in response to insulin challenge. As expected, hepatic pAkt level was significantly decreased in HFD-fed mice (Figure 5, A and B). Of interest, there was a upward trend on HFD-induced reduction of hepatic pAkt level in VDD+HFD group as compared with HFD group (Figure 5, A and B). The effects of vitamin D deficiency on hepatic Irs-2 expression were then analyzed. As expected, hepatic Irs-2 mRNA was significantly down-regulated in HFD-fed mice. Interestingly, vitamin D deficiency had little effect on hepatic Irs-2 mRNA. Finally, the effects of vitamin D deficiency on hepatic Pepck and G6pc, 2 downstream genes of insulin signaling, were analyzed. As expected, hepatic Pepck and G6pc were down-regulated in HFD-fed mice. Of interest, vitamin D deficiency had little effect on hepatic Pepck and G6pc (Figure 5C).
Antibody Table
| Peptide/Protein Target | Antigen Sequence (if known) | Name of Antibody | Manufacturer, Catalog Number, and/or Name of Individual Providing the Antibody | Species Raised in; Monoclonal or Polyclonal | Dilution Used |
|---|---|---|---|---|---|
| Phospho-Akt Ser473 | Cell Signaling Technologies, 4060s | Rabbit monoclonal | 1:2000 | ||
| Akt | Cell Signaling Technologies, 4691s | Rabbit monoclonal | 1:2000 | ||
| Goat antirabbit IgG-HRP | Goat antirabbit IgG-HRP | Santa Cruz Biotechnology, Inc, C0612 | 1:50 000 |
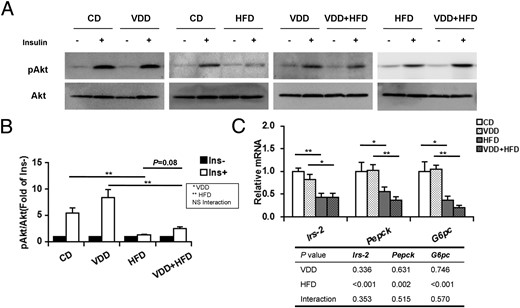
Effects of vitamin D deficiency on hepatic insulin signal transduction. A, Mice were fasted for 8 hours and ip injected with recombinant insulin (1.0 U/kg). Liver tissues were collected 5 minutes after insulin injection. Hepatic phospho-Akt and Akt were measured using immunoblots (n = 6). Blots reflect representative data. All experiments were replicated for 4 times. B, The level of pAkt/Akt was quantified and normalized to corresponding control (without treatment of insulin). C, Hepatic Irs-2, Pepck, and G6pc were determined using real-time RT-PCR (n = 6). Data were expressed as mean ± SEM. NS, nonsignificant. Irs-2, insulin receptor substrate 2; Pepck, phosphoenolpyruvate carboxykinase; G6pc, glucose-6-phsophatase catalytic. *, P < .05; **, P < .01.
Lipid-related genes in adipose tissue
As expected, perinephric and epididymal fat mass was significantly elevated in HFD-fed mice. However, vitamin D deficiency did not exacerbate HFD-induced elevation of fat mass (Figure 6, A and B). The effects of vitamin D deficiency on genes for fatty acid synthesis in adipose tissue were analyzed. Fasn, Acc, and Scd-1, 3 rate-limiting enzyme genes for fatty acid synthesis, were significantly down-regulated in white adipose tissue of HFD-fed mice. Interestingly, vitamin D deficiency significantly attenuated HFD-induced down-regulation of Fasn, Acc, and Scd-1 in white adipose tissue (Figure 6C). The effects of vitamin D deficiency on genes for lipid transport in adipose tissue were then evaluated. No significant difference on the expression of Cd36 and Fabp4 in white adipose tissue was observed among different groups (Figure 6D). Next, the effects of vitamin D deficiency on genes for lipolysis and fatty acid β-oxidation in adipose tissue were analyzed. Lipe, the key gene for lipolysis, and Cpt2, the key gene for fatty acid β-oxidation, were markedly down-regulated in white adipose tissue of HFD-fed mice. Interestingly, HFD-induced down-regulation of Lipe and Cpt2 in white adipose tissue was blocked when vitamin D in feed was depleted (Figure 6E). Uncoupling proteins (Ucps) separate oxidative phosphorylation from ATP production (21). As expected, vitamin D deficiency had little effect on Ucp1 and Ucp2 in white adipose tissue. Ucp3 was down-regulated in white adipose tissue of HFD-fed mice. Interestingly, HFD-induced down-regulation of Ucp3 in white adipose tissue was significantly attenuated when vitamin D in feed was depleted (Figure 6F). The effects of vitamin D deficiency on the expression of Ucps in brown adipose tissue were then analyzed. Although vitamin D deficiency had little effect on Ucp1 and Ucp2 in brown adipose tissue, the expression of Ucp3 in brown adipose tissue was significantly up-regulated in VDD and VDD+HFD groups (Figure 6G).
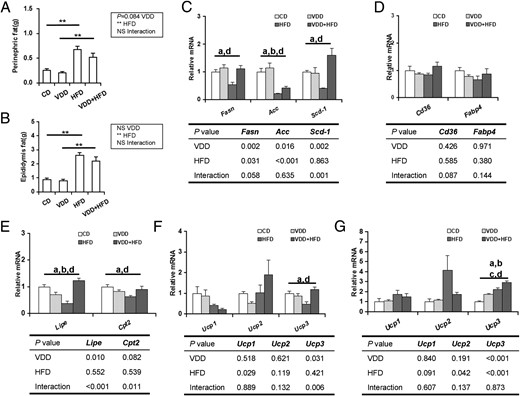
Effects of vitamin D deficiency on lipid-related genes in adipose tissue. Perinephric (A) and epididymal (B) fats were weighed (n = 20). The expression of lipid-related genes in adipose tissue was determined using real-time RT-PCR (n = 6). C, Genes for fatty acid synthesis in white adipose tissue. D, Genes for lipid transport in white adipose tissue. E, Lipolysis-related genes in white adipose tissue. F, Ucps in white adipose tissue. G, Ucps in brown adipose tissue. Data were expressed as mean ± SEM. NS, nonsignificant. *, P < .05; **, P < .01; a, P < .05 CD vs HFD; b, P < .05 VDD vs VDD+HFD; c, P < .05 CD vs VDD; d, P < .05 HFD vs VDD+HFD.
Discussion
The present study showed that vitamin D deficiency did not elevate hepatic TG content and circulating lipid levels. In addition, vitamin D deficiency did not directly induce hepatic lipid accumulation in mice. Actually, the absolute liver weight was lower in VDD+HFD group as compared with HFD group. Correspondingly, hepatic TG content was lower in VDD+HFD group as compared with HFD group. In addition, HFD-induced hepatic lipid accumulation was significantly attenuated in VDD+HFD group. These results are significantly different from those from rats (14), in which vitamin D deficiency exacerbated HFD-induced elevation of circulating TG level and hepatic lipid accumulation in rats. These results suggest an obvious species differences in the effects of vitamin D deficiency on hepatic lipid metabolism.
Increasing evidence demonstrates that hepatic de novo fatty acid synthesis plays an important role in the development of NAFLD (22). The Srebp-1 is the most important transcription factor that regulates the expression of the enzymes for fatty acid synthesis (23). The role of vitamin D receptor (VDR) on fatty acid synthesis remains controversial. According to an earlier report, 25(OH)D3, the ligand of VDR, showed significant prosteatotic effects in HepG2 cells (24). By contrary, a recent study found that doxercalciferol, a VDR agonist, significantly attenuated HFD-induced renal TG accumulation in mice through down-regulating the expression of Srebp-1, the master regulators of fatty acid synthesis, and Fasn and Acc, the rate-limiting enzymes for fatty acid synthesis (25). The present study investigated the effects of vitamin D deficiency on the expression of hepatic Srebp-1 and its target genes. Unexpectedly, vitamin D deficiency had no effect on the expression of hepatic Srebp-1. Moreover, vitamin D deficiency did not influence the expression of hepatic Fasn, Acc, and Scd-1 in HFD-fed mice. These results suggest that vitamin D deficiency does not influence hepatic de novo fatty acid synthesis.
Pparγ, which promotes hepatic lipid uptake and lipid droplet formation, has been demonstrated to be a prosteatotic factor in the development of HFD-induced NAFLD (26–28). Generally, Pparγ is expressed at a low level in human and mouse liver (29). Hepatic Pparγ was markedly up-regulated in HFD-induced NAFLD (30–32). Indeed, hepatic Cd36, a mediator of fatty acid uptake, is a downstream target of Pparγ (33, 34). The present study showed that hepatic Pparγ mRNA was significantly elevated in HFD-fed mice. Hepatic Cd36, the target gene of Pparγ, was correspondingly up-regulated in HFD-fed mice. Interestingly, vitamin D deficiency did not only down-regulated hepatic Pparγ mRNA expression but also attenuated HFD-induced up-regulation of hepatic Pparγ and its target gene Cd36. These results suggest that vitamin D deficiency alleviates HFD-induced hepatic lipid accumulation through attenuating up-regulation of hepatic Pparγ and its target gene Cd36.
It remains controversial whether vitamin D deficiency elevates the risk of insulin resistance and type 2 diabetes. Numerous studies found that vitamin D deficiency were associated with insulin resistance (10, 35, 36). By contrary, several recent studies showed that no significant association was observed between vitamin D deficiency and insulin resistance (37–40). According to the results from a recent meta-analysis, the association between vitamin D deficiency and the risk of metabolic syndromes was demonstrated only in cross-sectional studies but not in longitudinal studies (41). Indeed, serum vitamin D concentration was significantly decreased in obese adolescents and adults (10, 42–44). On the other hand, obesity is a risk factor of type 2 diabetes (45). Thus, we hypothesize that vitamin D deficiency may be a confounding factor for obesity-associated insulin resistance. The causal association among obesity, vitamin D deficiency and insulin resistance needs to be further identified using animal experiments and randomized placebo-controlled trials. The present study investigated the effects of vitamin D deficiency on hepatic insulin sensitivity using a vitamin D-depleted HFD mouse model. We showed that vitamin D deficiency did not directly elevate the levels of fasting blood glucose and serum insulin. Further study showed vitamin D deficiency did not exacerbate HFD-induced insulin resistance, not only as a whole but also in liver. Unexpectedly, vitamin D deficiency alleviated HFD-induced hyperinsulinemia. These results are in agreement with several randomized placebo-controlled trials, in which vitamin D supplementation did not improve insulin sensitivity or change the incidence of metabolic syndrome (46–48). Taken together, these results suggest that vitamin D deficiency may be not a direct risk factor of insulin resistance. However, the present research cannot differentiate the change of insulin sensitivity between a primary result of low vitamin D status and a secondary effect mediated through reduced weight gain. Thus, further research is needed to explore the primary effects of low vitamin D status on insulin sensitivity.
The vitamin D hormonal system is mainly under the regulation of the PTH, which stimulates the conversion of circulating 25(OH)D to its active form, 1,25-(OH)2D. Indeed, a report showed that vitamin D deficiency/insufficiency with increased PTH is an independent predictor of β-cell dysfunction, insulin resistance, and glycemia (49). However, another study demonstrated that patients with normocalcemic primary hyperparathyroidism do not exhibit insulin resistance and glucose intolerance (50). Thus, additional work is required to assess the effects of PTH elevation on glycometabolism.
The mechanism by which vitamin D deficiency alleviates HFD-induced insulin resistance remains obscure. It is increasingly recognized that obesity is the main risk factor of HFD-induced insulin resistance (45, 51). The present study showed that body weight growth was slower in VDD+HFD group than in HFD group. Moreover, there was a slight downstream trend on visceral fat mass in VDD+HFD group as compared with HFD group, indicating that vitamin D deficiency alleviates HFD-induced overweight and obesity. Increasing evidence demonstrates that principal cause of overweight and obesity is energy imbalance: caloric intakes are more than those used by bodily processes, eg, breathing, digestion, and thermogenesis (52). Unexpectedly, the present study showed that food and caloric intakes were markedly elevated in VDD+HFD group as compared with HFD group, indicating that vitamin D deficiency elevates energy consumption. Indeed, an earlier report showed that the rate of fatty acid β-oxidation in white adipose tissue was higher and the expression of Ucp1, Ucp2, and Ucp3 was up-regulated in VDR-null mice (53). The present study showed that Cpt2, a key gene for fatty acid β-oxidation was obviously down-regulated in white adipose tissue of HFD-fed mice. Correspondingly, the expression of Ucp3 was significantly decreased in white adipose tissue of HFD-fed mice. Interestingly, vitamin D deficiency not only attenuated HFD-induced down-regulation of Cpt2 and Ucp3 in white adipose tissue but also up-regulated the expression of Ucp3 in brown adipose tissue. Thus, our results suggest that vitamin D deficiency alleviates HFD-induced obesity and hyperinsulinemia through up-regulating Ucp3 and elevating energy expenditure in adipose tissue. Additional research is needed to further explore the mechanism how vitamin D deficiency regulates the expression of Ucp3 in adipose tissue.
In summary, the present study investigated the effects of vitamin D deficiency on HFD-induced obesity, insulin resistance, and hepatic lipid accumulation in male mice. We demonstrate that vitamin D deficiency does not directly cause obesity, insulin resistance, and hepatic lipid accumulation in male mice. By contrary, vitamin D deficiency alleviates HFD-induced overweight, hyperinsulinemia, and hepatic lipid accumulation through promoting fatty acid β-oxidation and elevating energy expenditure in adipose tissue.
Acknowledgments
We thank Zhi-hui Zhang, Zhen Yu, Lu-lu Yang, and Lin Fu (all from Department of Toxicology, Anhui Medical University, Hefei, China) for their assistance with the experimental techniques.
This work was supported by National Natural Science Foundation of China Grants 30973544, 81172711, 81100449, 81471467, and 81373495 and by Key Project of the Department of Education of Anhui in China Grants KJ2011A159, KJ2012A167, and KJ2013A38.
Disclosure Summary: The authors have nothing to disclose.
For News & Views see page 1933
Abbreviations
- AUC
area under the curve
- Akt
protein kinase B
- CD
control diet
- Cpt
carnitine palmitoyltrans
- GTT
glucose tolerance test
- HFD
high-fat diet
- ITT
insulin tolerance test
- LSD
Least Significant Difference
- NAFLD
nonalcoholic fatty liver disease
- 25(OH)D
25-hydroxyvitamin D
- pAkt
phosphorylated Akt
- Ppar
peroxisome proliferator-activated receptor
- Srebp
sterol-regulated element-binding protein
- TG
triglyceride
- Ucp
uncoupling protein
- VDD
vitamin D deficiency diet
- VDR
vitamin D receptor
- VLDL
very low density lipoprotein.
References
Author notes
X.-J.L. and B.-W.W. contributed equally to this work.
