


Abstract
The molecular mechanisms and metabolic pathways whereby the citrus flavonoid, naringenin, reduces dyslipidemia and improves glucose tolerance were investigated in C57BL6/J wild-type mice and fibroblast growth factor 21 (FGF21) null (Fgf21−/−) mice. FGF21 regulates energy homeostasis and the metabolic adaptation to fasting. One avenue of this regulation is through induction of peroxisome proliferator-activated receptor-γ coactivator-1α (Pgc1a), a regulator of hepatic fatty acid oxidation and ketogenesis. Because naringenin is a potent activator of hepatic FA oxidation, we hypothesized that induction of FGF21 might be an integral part of naringenin's mechanism of action. Furthermore, we predicted that FGF21 deficiency would potentiate high-fat diet (HFD)-induced metabolic dysregulation and compromise metabolic protection by naringenin. The absence of FGF21 exacerbated the response to a HFD. Interestingly, naringenin supplementation to the HFD robustly prevented obesity in both genotypes. Gene expression analysis suggested that naringenin was not primarily targeting fatty acid metabolism in white adipose tissue. Naringenin corrected hepatic triglyceride concentrations and normalized hepatic expression of Pgc1a, Cpt1a, and Srebf1c in both wild-type and Fgf21−/− mice. HFD-fed Fgf21−/− mice displayed greater muscle triglyceride deposition, hyperinsulinemia, and impaired glucose tolerance as compared with wild-type mice, confirming the role of FGF21 in insulin sensitivity; however, naringenin supplementation improved these metabolic parameters in both genotypes. We conclude that FGF21 deficiency exacerbates HFD-induced obesity, hepatic steatosis, and insulin resistance. Furthermore, FGF21 is not required for naringenin to protect mice from HFD-induced metabolic dysregulation. Collectively these studies support the concept that naringenin has potent lipid-lowering effects and may act as an insulin sensitizer in vivo.
Aberrant glucose and lipid homeostasis define a constellation of metabolic abnormalities including obesity, dyslipidemia, insulin resistance, and type 2 diabetes, suggesting that restoration of energy homeostasis is critical for therapeutic intervention (1–4). Previously we demonstrated that the citrus flavonoid, naringenin, is a potent inhibitor of apolipoprotein B100 secretion from cultured hepatoma cells (5–10). We extended these studies to a well-established model of dyslipidemia and atherosclerosis, the high-fat diet (HFD) fed Ldlr−/− mouse, in which the administration of naringenin lowered very low-density lipoprotein production, corrected dyslipidemia, improved glucose and insulin tolerance, reduced hepatic lipid accumulation, and attenuated atherosclerosis (11–14). Naringenin treatment induced hepatic fatty acid oxidation, which reduced lipid availability, especially triglycerides (TGs), for the assembly and secretion of apolipoprotein B-containing lipoproteins, leading to reduced hepatic lipid accumulation and improved dyslipidemia (12). Interestingly, unlike other polyphenols, naringenin did not stimulate fatty acid oxidation in skeletal muscle; instead naringenin reduced lipid accumulation and promoted glucose uptake (12). These data suggest that naringenin may not act directly in muscle and reduced muscle lipid and improved glucose use is due to reduced lipoprotein uptake, a consequence of decreased very low-density lipoprotein secretion as well as reduced de novo lipogenesis, secondary to normalization of hyperinsulinemia. Additionally, naringenin prevents diet-induced weight gain and adiposity by increasing whole-body energy expenditure (12). Other polyphenolic compounds prevent diet-induced adipose tissue accumulation through a variety of mechanisms including inhibition of preadipocyte differentiation, stimulating lipolysis, and increasing mitochondrial function (15). However, the molecular mechanisms by which naringenin stimulates hepatic β-oxidation and prevents HFD-induced adipose tissue accumulation remain to be fully elucidated.
Previously we identified that naringenin induces hepatic fatty acid oxidation, which was coupled to the induction of peroxisome proliferator-activated receptor (PPAR)-γ coactivator-1α (Pgc1a) as well as the PPARα-target genes, carnitine palmitoyltransferase-1α (Cpt1a) and acylCoA oxidase 1 (Acox1), which code for rate-limiting enzymes in mitochondrial and peroxisomal fatty acid oxidation, respectively (11, 12). However, naringenin is not a direct PPARα activator (12). Recently we reported that naringenin robustly increases hepatic Fgf21 expression in mice on high-fat-high-cholesterol or low-fat-high-cholesterol diets, suggesting it may be essential in mediating naringenin's metabolic effects (11).
Fibroblast growth factor (FGF) 21 is induced by fasting, or more specifically reduced intake of protein, and is regulated, in part, by the transcription factor PPARα (16–19). FGF21 is predominantly derived from the liver and signals through a complex including β-Klotho, which is selectively expressed in liver, adipose, and pancreas, and one of four tyrosine kinase FGF receptors (FGFR1c, FGFR 2c, FGFR 3c, and FGFR 4) (20–25). However, β-Klotho is not required for FGF21 signaling in adipose tissue (26). FGF21 stimulates hepatic expression of PPARγ coactivator-1α (Pgc1a) (18, 27–29), which regulates genes involved in ketogenesis and hepatic fatty acid (FA) oxidation including Cpt1a. Hepatoma cells transfected with an FGF21 construct demonstrated reduced TG content and lower levels of the nuclear form of sterol response element binding protein 1c (SREBP-1c) (30), suggesting that FGF21 may reduce hepatic lipogenesis. The importance of FGF21 in regulating energy and lipid metabolism in vivo has been demonstrated in HFD-fed C57BL/6 mice, whereby injection of FGF21 improved hyperinsulinemia, improved insulin sensitivity, decreased hepatic expression of Srebf1c, reduced FA synthesis, attenuated hepatic steatosis, and increased energy expenditure (31–33), results very similar to the response we observed in naringenin-treated, HFD-fed mice (11, 12). Furthermore, transgenic mice overexpressing hepatic FGF21 are lean, protected from HFD-induced insulin resistance, and exhibit an extended lifespan (34, 35).
In this study, we tested whether naringenin action requires FGF21 for its metabolic effects on the regulation of white adipose tissue (WAT) energy homeostasis, hepatic lipid metabolism, and whole-body glucose homeostasis. We used Fgf21−/− mice, which the current studies confirm as unique model of diet-induced obesity and metabolic dysfunction, in which the absence of FGF21 significantly enhanced the response to a HFD. Naringenin potently reduced lipid accumulation in all adipose tissue depots, the liver, and muscle independent of FGF21. For the first time, we evaluated naringenin's effect on the expression of genes involved in lipid homeostasis in WAT, and we conclude that the ability of naringenin to protect from HFD-induced metabolic dysregulation is independent of FGF21, and the primary site of action is not lipid metabolism in WAT. Collectively these findings add to the growing body of evidence that naringenin has marked lipid-lowering potential and demonstrate that it can normalize glucose tolerance and insulin sensitivity and prevent obesity, independent of FGF21. The ability of naringenin to modulate metabolic pathways linked to the metabolic syndrome suggests citrus flavonoids represent valuable tools in the search for regulators of insulin signaling, lipid homeostasis, and energy balance.
Materials and Methods
Animals and diets
C57BL/6 and Lepob/ob mice were obtained from the Jackson Laboratory. Congenic Fgf21−/− mice on a C57BL/6 background were developed by one of the authors (A.K.) at Lilly Research Laboratories (Indianapolis, IN) and were bred for experiments by another author (C.L.P.) at the University of Western Ontario (London, Ontario, Canada) (36, 37). Male C57BL6/J and Fgf21−/− mice, 8–12 weeks of age, were housed singly, on a 12-hour light, 12-hour dark cycle, at 23°C. Mice were fed ad libitum for 16 weeks (n = 6–8/group) a standard chow diet (14% kcal fat, TD8604; Harlan Teklad), a HFD [42% kcal fat, 43% kcal carbohydrate, 0.05% (wt/wt) cholesterol, TD96125; Harland Teklad], or a HFD supplemented with 3% (wt/wt) naringenin (Sigma-Aldrich) (12). Male Lepob/ob mice (aged 6 wk) were fed a low-fat semisynthetic diet (Harlan Teklad; AIN-73A) ±3% naringenin for 4 weeks (n = 8/group). Food intake and body weight were measured three times per week. Caloric intake was calculated as described previously (11). Mice were fasted for 4 hours prior to metabolic studies and being killed. Experiments were approved by the Animal Care and Use Subcommittee at the University of Western Ontario (protocol number 2008–071).
Plasma and tissue analyses
Mice were euthanized by CO2 inhalation, and cardiac puncture was conducted to collect blood, which was stored at −20°C. Plasma insulin (ALPCO Diagnostics), FGF21 (EMD Millipore), FGF15 (Uscn Life Science Inc), leptin (Crystal Chem Inc), total adiponectin (Biovendor Inc), TNFα (eBioscience) and IGF-1 (R&D Systems) were determined by a mouse-specific ELISA. Plasma triglycerides (Roche Diagnostics) and plasma free fatty acids (FFAs) (Wako Chemicals) were measured enzymatically (12, 13, 38). Liver and quadriceps were removed, snap frozen in liquid nitrogen, and stored at −80°C. Liver and muscle lipids were extracted and analyzed as described previously (12, 13, 38).
Glucose and insulin tolerance tests
For glucose tolerance tests (GTTs), mice were fasted for 4 hours (Fgf21−/− and C57BL/6 mice) or 6 hours (Lepob/ob mice) and administered by gavage a 20% D-glucose solution in 0.9% NaCl (1 g/kg body weight). For insulin tolerance tests (ITT), nonfasted mice were injected ip with 0.6 IU/kg Novolin ge Toronto (Novo Nordisk). GTTs and ITTs were performed as described previously (12, 13, 38).
Gene expression
Tissue mRNA levels were determined using a two-step quantitative real time-PCR protocol on an ABI Prism (model 7900 HT) sequence detection system (Applied Biosystems) according to the manufacturer's instructions. Primer probe sets were manufactured by Taqman Assays-on-Demand (Applied Biosystems) with the exception of Srebf1c, which was designed from the Mus musculus Srebf1 sequence (Genbank accession number AL669954), as described previously (12). The 2(-Delta Delta threshold Cycle) method was used to estimate specific mRNA concentrations, and each gene was normalized to β-actin (Actb) or Gapdh expression.
Tissue sectioning and histology
WAT was fixed in 10% formalin, embedded in paraffin, sectioned, and stained with hematoxylin and eosin. All photomicrographs were generated on an Olympus BX50 microscope with a QImaging Retiga EXi FAST camera (QImaging). Adipocyte diameter was calculated using Northern Eclipse 7.0 software on ×20 magnification photomicrographs (11).
Microcomputed tomography (micro-CT) imaging
Male C57BL/6 and Fgf21−/− mice were imaged after 8 weeks on a diet (n = 4–6/group). Whole-body composition analysis was conducted by micro-CT imaging using a Locus Ultra micro-CT scanner (GE Healthcare) (39). Nonfasted mice were anesthetized with 1.5% isoflurane in O2. A calibrating phantom, comprising air and water, was scanned concurrently to ensure images were reconstructed equivalently. The scan protocol consisted of an x-ray tube voltage of 80 kVp and a current of 55.0 mA. In a scan time of 16 seconds, 1000 views were acquired in one continuous rotation. Images were reconstructed to an isotropic voxel size of 150 μm3. Using the image values of water and air, data were calibrated into CT number, expressed in Hounsfield Units. The analysis was conducted using MicroView software version 2.2 (GE Healthcare). Total adipose tissue volume was calculated by selecting all voxels with values within a window of −225 to −60 Hounsfield Units and then divided into sc and visceral depots. Subcutaneous and visceral adipose tissue depots were differentiated using the muscular abdominal wall, which is readily identified because of its higher density (40). The sc and visceral adipose depots were outlined manually and the volume of each region was calculated by MicroView as the number of voxels falling within the threshold window multiplied by the voxel volume (150 μm3). Adipose tissue was highlighted in red.
Statistical Analysis
Data are presented as the mean ± SEM. An ANOVA was conducted to test the interaction between diet and genotype, followed by a post hoc Tukey test. Within a genotype, a one-way ANOVA was performed followed by a post hoc Tukey test. Different upper-case letters indicate statistical significance among wild-type (WT) mice (P < .05). Different lower-case letters indicate statistical significance among Fgf21−/−mice (P < .05). An asterisk indicates statistical significance between genotypes (WT vs Fgf21−/−) fed the same diet, determined by a Student's unpaired t test (P < .05). Statistical analysis was performed using Sigma Plot version 14.0.
Results
Enhanced weight gain in HFD-fed Fgf21−/− mice is prevented by naringenin
Previous studies determined that hepatic Fgf21 mRNA in Ldlr−/− animals that had been fed a HFD containing naringenin for 4 weeks was 3-fold higher than in mice fed the HFD alone (Supplemental Figure 1A). Naringenin supplementation also increased fasting plasma FGF21 concentrations 2-fold compared with mice fed the HFD alone (Supplemental Figure 1B). To further evaluate the requirement of FGF21 in the flavonoid-mediated reduction in metabolic abnormalities, we fed both WT and Fgf21−/− mice a HFD with or without naringenin for 16 weeks. In Fgf21−/− mice, HFD alone enhanced weight gain (1.7-fold) compared with WT mice fed the same diet (Supplemental Figure 2A). Both genotypes showed increased weight gain compared with chow-fed mice. The addition of naringenin to the HFD completely prevented diet-induced weight gain in both HFD-fed Fgf21−/− and WT mice to levels not different from chow-fed mice. Consistent with previous reports (36, 41), chow-fed Fgf21−/− mice tended to be heavier than WT mice, a trend that persisted in naringenin-fed mice. No significant differences in caloric intake were observed among any of the groups (Supplemental Figure 2B). In Fgf21−/− mice, immunodetectable FGF21 in plasma was below the lowest assay standard, and hepatic Fgf21 mRNA was undetectable in all dietary groups (data not shown). Whole-body micro-CT imaging revealed that in chow-fed WT mice, the volume of adipose tissue (red) in the sc depot was approximately 2-fold higher than in the visceral depot (Figure 1). A similar relationship was observed in chow-fed Fgf21−/− mice, although adipose tissue volume in each depot was significantly elevated (2- to 3-fold) relative to WT mice (Figure 1, A–C). In both genotypes, the HFD increased adipose tissue volume in the visceral depot to a greater extent than the sc depot (7.3-fold vs 3.9-fold, respectively) (Figure 1, B and C). However, in Fgf21−/− mice, the HFD induced a significantly greater volume of both visceral adipose tissue (2-fold) and sc adipose tissue (1.8-fold) compared with HFD-fed WT mice (Figure 1, B and C). In contrast, naringenin supplementation completely prevented the visceral and sc adipose tissue accumulation in both genotypes (Figure 1). Although the adipose tissue volume in both depots remained higher (∼2-fold) in naringenin-treated Fgf21−/− mice, compared with naringenin-treated WT mice, the absolute naringenin-induced decrease in adipose tissue volume was 1.8-fold greater in Fgf21−/− mice. Thus, naringenin prevents HFD-induced visceral and sc adipose tissue accumulation, even in HFD-fed Fgf21−/− mice, a model more susceptible to the development of diet-induced obesity.
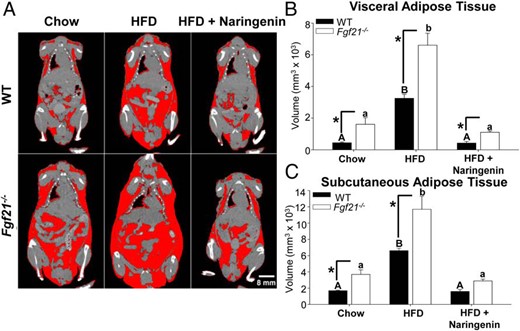
Visceral and sc adipose tissue volume calculated by micro-CT imaging of WT and Fgf21−/− mice. A subset of male WT and Fgf21−/− mice were fed a chow diet, a HFD, or a HFD supplemented with 3% naringenin for 8 weeks (n = 4–6/group). A, Whole-body composition analysis was conducted by micro-CT imaging. Adipose tissue is highlighted in red. Note that the apparent presence of a small amount of adipose tissue at air/tissue interfaces (eg, lung/heart) is an artifact caused by averaging the x-ray attenuation coefficient of air and soft tissue. Visceral (B) and sc (C) adipose tissue volume (cubic millimeters × 103) was calculated from micro-CT images. Values are the mean ± SEM. Different upper-case letters indicate statistical significance among WT animals (P < .05). Different lower-case letters indicate statistical significance among Fgf21−/− mice (P < .05). *, Statistical significance between genotypes (WT vs Fgf21−/−) fed the same diet (P < .05).
Exaggerated adipocyte hypertrophy and adipose tissue accumulation in HFD-fed Fgf21−/− mice is prevented by naringenin
FGF21 deficiency significantly increased mean epididymal adipocyte diameter in chow- and HFD-fed mice (>1.3-fold for both), compared with WT mice (Supplemental Figure 2C). In contrast, naringenin significantly attenuated adipocyte diameter in both WT and Fgf21−/− mice (−104% and −122%, respectively). The HFD shifted the adipocyte size distribution in both WT and Fgf21−/− mice, such that a greater percentage of larger adipocytes accumulated in epididymal fat (Figure 2, A and B). However, the distribution was shifted toward larger adipocytes in HFD-fed Fgf21−/− mice compared with their WT counterparts. Naringenin supplementation completely normalized the adipocyte diameter distribution in both genotypes (Figure 2, A and B). The increase in the number of adipocytes from HFD-fed Fgf21−/− mice (3.2-fold) was significantly greater than in HFD-fed WT mice (2-fold) (Figure 2C). This demonstrates that the increased epididymal fat pad weight in HFD-fed Fgf21−/− mice was due to a greater number of larger adipocytes (Figure 2, A–C). Although adipocyte number remained elevated, accounting for the increased fat pad weight in naringenin-treated Fgf21−/− mice, naringenin normalized adipocyte diameter in both genotypes (Supplemental Figure 2C).
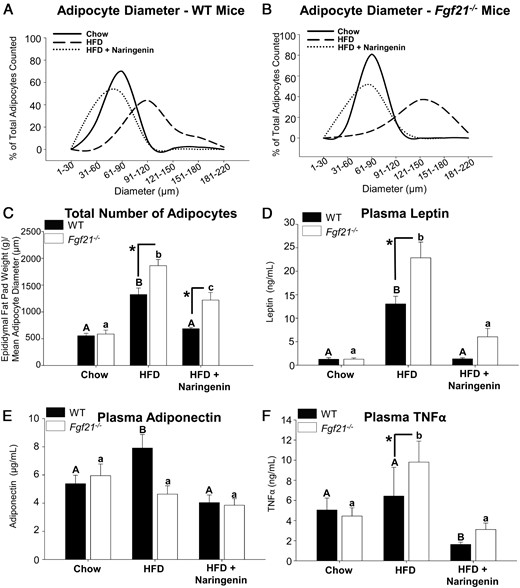
Adipocyte characteristics in HFD-fed WT and Fgf21−/− mice treated with naringenin. Male WT and Fgf21−/− mice were fed a chow diet, a HFD, or a HFD supplemented with 3% naringenin for 16 weeks (n = 6–7/group). A and B, Adipocyte diameter distribution. C, Quantitation of the total number of adipocytes. Plasma concentrations of leptin (D), adiponectin (E), and TNFα (F) are shown. Values are the mean ± SEM. Different upper-case letters indicate statistical significance among WT animals (P < .05). Different lower-case letters indicate statistical significance among Fgf21−/−mice (P < .05). *, Statistical significance between genotypes (WT vs Fgf21−/−) fed the same diet (P < .05).
Plasma leptin levels were significantly increased in HFD-fed Fgf21−/− mice (17-fold) compared with the increase (9.3-fold) in HFD-fed WT mice, consistent with the increased adiposity in HFD-fed Fgf21−/− mice (Figure 2D). In both genotypes, naringenin markedly reduced circulating leptin levels, although levels remained higher in Fgf21−/− mice. Plasma adiponectin was increased approximately 25% in HFD-fed WT mice but not in HFD-fed Fgf21−/− mice (Figure 2E), consistent with increased adiposity in the latter mice and with a report that FGF21 is a potent regulator of adiponectin secretion (42). Naringenin induced normal plasma levels of adiponectin in HFD-fed mice, independent of genotype (Figure 2E). Enhanced ectopic lipid accumulation promotes systemic inflammation due to secretion of proinflammatory cytokines from WAT (43). Therefore, the significant increase in plasma TNFα in HFD-fed Fgf21−/− mice is consistent with increased adiposity (Figure 2F). Naringenin treatment suppressed plasma TNFα, independent of genotype (Figure 2F). Plasma levels of the related FGF15 or IGF-1 were unaffected by diet or genotype (data not shown).
Gene profiling of WAT reveals naringenin does not significantly target genes regulating lipid metabolism
The increased adiposity in HFD-fed Fgf21−/− mice and its prevention by naringenin led us to explore the expression of genes that regulate lipid metabolism in WAT. To evaluate fatty acid oxidation, we examined Pgc1a and Cpt1a. In both genotypes, Pgc1a expression was similar; its expression was attenuated approximately 65% by the HFD, whereas expression was completely restored by naringenin (Figure 3A). Cpt1a expression was also similar between genotypes, the HFD reduced Cpt1a expression to a similar extent in WT and Fgf21−/− mice, and naringenin had no further effect (Figure 3B). In addition to its regulation of oxidative metabolism, Pgc1α regulates thermogenesis (44). Concomitant with decreased Pgc1a in HFD-fed WT mice compared with chow-fed WT mice, uncoupling protein 1 (Ucp1) expression decreased approximately 70%, whereas naringenin increased Ucp1 mRNA 3-fold. In contrast, WAT Ucp1 mRNA in chow-fed Fgf21−/− mice was not different from WT, and neither the HFD nor naringenin affected its expression (Figure 3C). Because both adipose TG lipase (Pnpla2) and hormone-sensitive lipase (Lipe) can liberate FAs, which may indirectly activate a PPARα transcription program, we assessed their mRNA abundance (45, 46). Lipe was lower in HFD-fed Fgf21−/− mice compared with HFD-fed WT mice, consistent with increased adiposity in HFD-fed Fgf21−/− mice. Naringenin treatment increased Pnpla2 and Lipe expression in both genotypes, suggesting that their up-regulation was not dependent on FGF21 (Figure 3, D and E). The nuclear hormone receptor Ppara was suppressed in HFD-fed Fgf21−/− mice compared with HFD-fed WT mice, consistent with increased adiposity in HFD-fed Fgf21−/− mice (Figure 3F). However, levels of Ppara mRNA in naringenin-treated mice were not different between genotypes, nor were they different from HFD-fed mice, suggesting that differences in Ppara expression do not play a role in the decreased adiposity induced by naringenin.
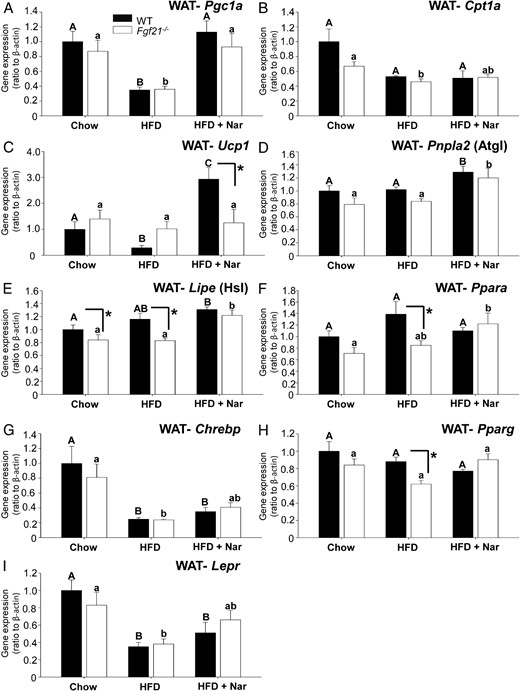
Gene expression profiling in WAT of WT and Fgf21−/− mice. mRNA abundance was measured in epidydmal adipose tissue depots collected from male WT and Fgf21−/− mice fed a chow diet, a HFD, or a HFD supplemented with 3% naringenin (Nar) for 16 weeks (n = 6–7/group). Values are the mean ± SEM (n = 6–7/group) and are normalized to Actb (β-actin). Different upper-case letters indicate statistical significance among WT animals (P < .05). Different lower-case letters indicate statistical significance among Fgf21−/−mice (P < .05). *, Statistical significance between genotypes (WT vs Fgf21−/−) fed the same diet (P < .05).
To provide insight into the effect of naringenin on lipogenesis, we evaluated WAT expression patterns of carbohydrate-responsive element-binding protein (Chrebp) and Pparg. Levels of Chrebp were modestly affected by diet (Figure 3G). However, there were no differences between genotypes and thus did not explain the increased adiposity or the naringenin-induced attenuation of adipose tissue in Fgf21−/− mice. Lower levels of Pparg mRNA abundance were observed in HFD-fed Fgf21−/− mice compared with HFD-fed WT mice, consistent with increased adiposity observed in Fgf21−/− mice; however, no differences were observed with naringenin treatment (Figure 3H). The WAT leptin receptor (Lepr) expression was significantly decreased (>60%) by HFD feeding and was partially restored by naringenin, independent of genotype (Figure 2I). In both genotypes, the HFD decreased WAT Klb (β-Klotho) (−45%) and naringenin did not further affect its expression. Fgfr1 and 2 mRNA were unchanged in WT mice. In HFD-fed Fgf21−/− mice, Fgfr2 expression was lower compared with HFD-fed WT mice, and both Fgfr1 and Fgfr2 were increased by the addition of naringenin (Supplemental Figure 3).
Naringenin prevents dyslipidemia and improves glucose metabolism in Lepob/ob mice independent of changes in weight or adiposity
In both WT and Fgf21−/− mouse models, naringenin significantly reduced diet-induced weight gain. To determine whether prevention of weight gain or obesity was a primary requirement for the metabolic protection observed in naringenin-treated animals, we performed similar studies in Lepob/ob mice, a genetic model characterized by severe obesity and insulin resistance. Male Lepob/ob mice were fed a low-fat semisynthetic diet ± 3% naringenin for 4 weeks. As observed previously, the Lepob/ob mice were hyperphagic compared with C57BL/6 controls (47). However, food intake was not affected by the addition of naringenin (data not shown). In this model, body weight and the adiposity index were unaffected by naringenin treatment (Figure 4, A and B). The Lepob/ob mice have steatotic livers, even in the absence of high-fat feeding. Liver TG was 10-fold greater than for C57BL/6 mice fed the same diet (data not shown). Naringenin significantly reduced liver TG by 25%, which coincided with a decrease in plasma TG concentrations of 75% (Figure 4, C and D). Hyperinsulinemia and modest hyperglycemia were observed in the Lepob/ob mice, which were significantly reduced with naringenin by 50% and 25%, respectively (Figure 4, E and F). Lepob/ob mice demonstrated significant impairment in glucose tolerance. Naringenin supplementation enhanced glucose tolerance as indicated by a significant reduction in the GTT area under the curve (AUC) (Figure 4, G and H). Therefore, reduced body weight and decreased adiposity were not the primary mechanisms for the naringenin-induced improvements in metabolic indices in WT and Fgf21−/− mice.
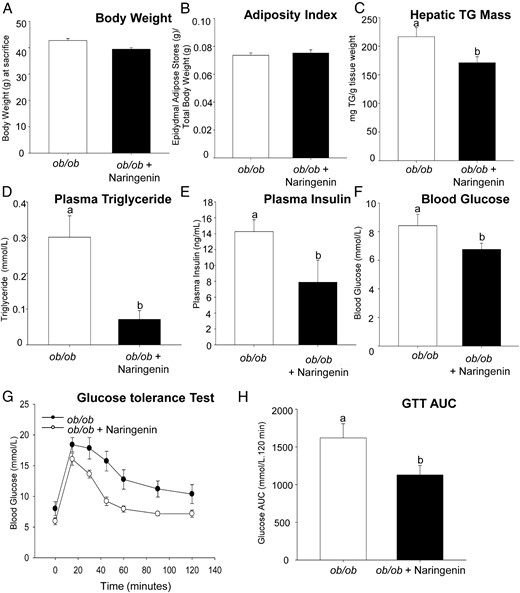
Naringenin-treatment of Lepob/ob mice improves glucose tolerance, dyslipidemia, and hepatic TG accumulation independent of any effect on body weight and adiposity. Male Lepob/ob mice were fed a low-fat semisynthetic diet ± naringenin (3%) for 4 weeks (n = 8/group). Body weight was measured biweekly (A). Adiposity Index was calculated as the weight of epididymal adipose stores/total body weight (B). Hepatic TG mass (C) and plasma TG concentrations (D) were determined in mice fasted for 6 hours. Plasma insulin (E) and blood glucose (F) were determined in mice after a 6-hour fast. A GTT was performed by gavage of 20% glucose (1 g/kg body weight) (G). The GTT AUC was calculated (H). Values are the mean ± SEM (n = 8/group). Different letters indicate statistical significance (P < .05).
Ectopic lipid accumulation in HFD-fed Fgf21−/− mice is prevented by naringenin
In our previous studies, naringenin significantly improved hepatic lipid and lipoprotein metabolism (11, 12). Therefore, we evaluated the requirement of FGF21 in mediating these effects. In chow-fed WT and Fgf21−/− mice, no differences were observed in hepatic TG mass; however, the absence of FGF21 exacerbated HFD-diet induced hepatic TG accumulation (by 3-fold) compared with HFD-fed WT mice (Figure 5A). Naringenin completely prevented the increase in hepatic TG (>96%) such that concentrations in treated mice were not different between genotypes. The absolute reduction in hepatic lipids induced by naringenin was significantly greater in HFD-fed Fgf21−/− mice compared with HFD-fed WT mice (Figure 5A). Intramyocellular lipids are associated with insulin resistance in vivo (12). The HFD significantly increased TG accumulation in quadriceps muscle of WT mice 1.6-fold, whereas quadriceps TG in Fgf21−/− mice fed the HFD markedly increased 3.2-fold, compared with chow-fed mice (Figure 5B). Although muscle TG was reduced greater than 90% by naringenin in both genotypes, levels remained significantly higher in Fgf21−/− mice compared with WT mice (Figure 5B). The HFD did not increase plasma TGs in either genotype (Figure 5C). Naringenin reduced plasma TGs in HFD-fed WT mice (−30%). In HFD-fed Fgf21−/− mice, naringenin had no effect on plasma TGs, suggesting that the decrease in tissue TGs was unrelated to plasma TG levels (Figure 5, A–C). Plasma FFA concentrations were unchanged by any dietary group or genotype (Figure 5D).
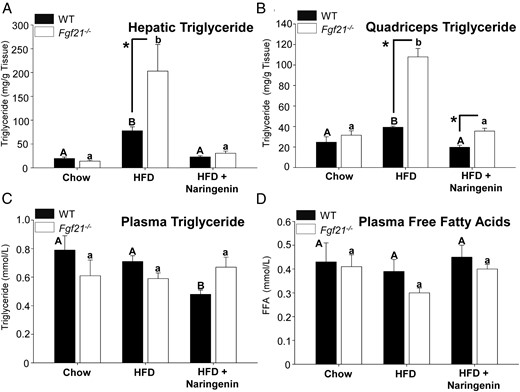
Prevention of hepatic steatosis and ectopic lipid accumulation in HFD-treated WT and Fgf21−/− mice supplemented with naringenin. Male WT and Fgf21−/− mice were fed a chow diet, a HFD, or a HFD supplemented with 3% naringenin for 16 weeks (n = 6–7/group). Hepatic TG (milligrams per gram of tissue weight) (A), quadriceps TG concentration (milligrams per gram of tissue weight) (B), plasma TG (C), plasma FFAs (D) are shown. Values are the mean ± SEM. Different upper-case letters indicate statistical significance among WT animals (P < .05). Different lower-case letters indicate statistical significance among Fgf21−/− mice (P < .05). *, Statistical significance between genotypes (WT vs Fgf21−/−) fed the same diet (P < .05).
Naringenin reduces gene expression of hepatic lipogenic genes and up-regulates hepatic FA oxidation genes, independent of FGF21
To explore the HFD-induced increase in hepatic TGs and its prevention by naringenin in both genotypes, we evaluated the FA oxidation genes Pgc1a and Cpt1a. Expression of Pgc1a was attenuated in HFD-fed Fgf21−/− mice to a greater extent (−58%) than in HFD-fed WT mice (−36%), compared with chow-fed controls (Figure 6A). Naringenin supplementation increased Pgc1a expression greater than 30%, in both genotypes. The HFD suppressed Cpt1a expression significantly (70%–80%) in both genotypes (Figure 6B). Naringenin supplementation increased Cpt1a mRNA to similar levels in both genotypes. Acox1 and Ppara mRNAs were unaffected by diet or genotype (Figure 6, C and D). The expression of genes involved in hepatic lipogenesis were also examined. Expression of sterol regulatory element binding factor 1c (Srebf1c) was significantly increased (∼2.5-fold) in both HFD-fed WT and Fgf21−/− mice (Figure 6E), whereas naringenin normalized Srebf1c expression in both genotypes. The expression of acetyl CoA carboxylase (Acc) 1 and Acc2, downstream targets of SREBP-1c, were significantly increased 1.7-fold by the HFD in WT mice but not in HFD-fed Fgf21−/− mice (Figure 6, F and G). However, naringenin normalized Acc1 and Acc2 expression in both genotypes. HFD consumption increased Scd1 expression in HFD-fed WT mice (2.3-fold) and in Fgf21−/− mice (1.5-fold) (Figure 6H). Scd1 expression was normalized by naringenin in both genotypes. Pparg mRNA was unaffected by diet or genotype (Figure 6I). HFD feeding did not affect Lepr expression in either genotype. Naringenin significantly increased Lepr expression in HFD-fed WT mice (∼2-fold) but not in HFD-fed Fgf21−/− mice (Figure 6J). Hepatic expression of Klb and Fgfr1 were reduced by the HFD in Fgf21−/− mice, and this was unaffected by naringenin addition. Fgfr2 was unaffected by genotype or by naringenin in HFD-fed mice (Supplemental Figure 4).
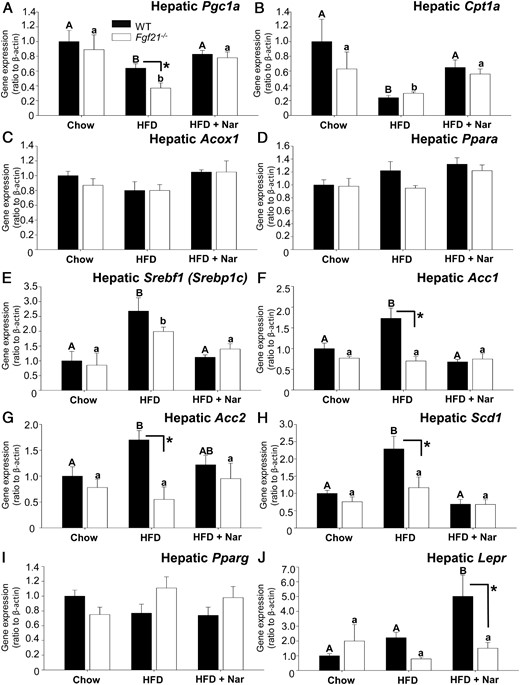
Gene expression profiling in liver of WT and Fgf21−/− mice. mRNA abundance was measured in liver collected from male WT and Fgf21−/− mice fed a chow diet, a HFD, or a HFD supplemented with 3% naringenin (Nar) for 16 weeks (n = 6–7/group). Data are given as mean ± SEM (n = 6–7/group) and are normalized to Actb (β-actin). Different upper-case letters indicate statistical significance among WT animals (P < .05). Different lower-case letters indicate statistical significance among Fgf21−/− mice (P < .05). *, Statistical significance between genotypes (WT vs Fgf21−/− fed the same diet (P < .05).
Naringenin prevents hyperinsulinemia and improves glucose homeostasis in both HFD-fed WT and Fgf21−/− mice
As recently reported in mice fed a HFD or a ketogenic diet, deletion of Fgf21 elevated plasma insulin (36, 48). In the present study, the HFD increased fasting plasma insulin in Fgf21−/− mice by 7.5-fold, which was significantly greater than the 4-fold increase observed for HFD-fed WT mice, as compared with chow-fed controls (Figure 7A). This implies that HFD-fed Fgf21−/− mice require significantly more insulin to maintain plasma glucose at levels similar to those in HFD-fed WT mice (Figure 7B). Naringenin supplementation to the HFD markedly attenuated plasma insulin in both WT (−75%) and Fgf21−/− mice (−88%) to levels not different between genotype and not different from chow-fed mice (Figure 7A). HFD-fed Fgf21−/− mice demonstrated an impaired response to exogenous insulin compared with HFD-fed WT mice, although the difference in absolute glucose AUC was not statistically significant (Figure 7, C, E, and G). Sensitivity to exogenous insulin was significantly improved in HFD-fed Fgf21−/− mice treated with naringenin (Figure 7, E and G). Insulin tolerance in WT mice was unaffected by any treatment group (Figure 7, C and G).
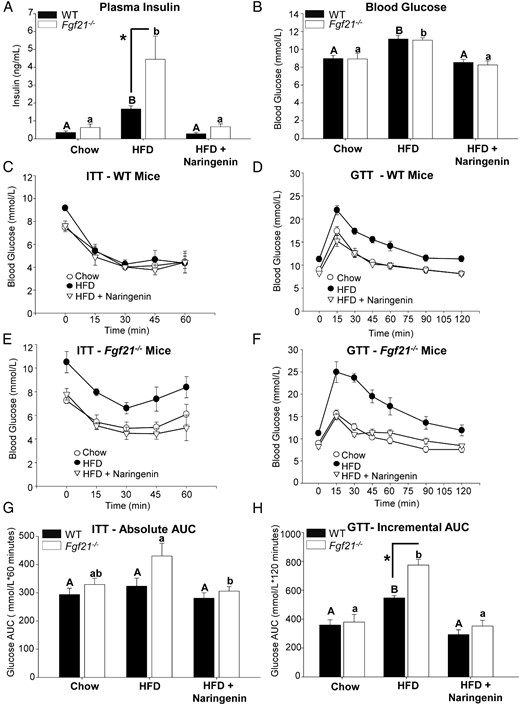
Naringenin prevents hyperinsulinemia and improves glucose tolerance and insulin sensitivity in HFD-fed WT and Fgf21−/− mice. Male WT and Fgf21−/− mice were fed a chow diet, a HFD, or a HFD diet supplemented with 3% naringenin for 16 weeks (n = 6–7/group). A, Plasma insulin (nanograms per milliliter). B, Blood glucose (millimoles per liter). C and E, ITTs were performed in nonfasted mice by ip injection of insulin (0.6 IU/kg). G, Absolute plasma glucose AUC in millimoles per liter × 60 minutes during the ITT. D and F, GTTs were performed after a 4-hour fast by oral gavage of 20% glucose (1 g/kg body weight). H, Incremental plasma glucose AUC in millimoles per liter × 120 minutes during the GTT. Values are the mean ± SEM. Different upper-case letters indicate statistical significance among WT animals (P < .05). Different lower-case letters indicate statistical significance among Fgf21−/− mice (P < .05). *, Statistical significance between genotypes (WT vs Fgf21−/−) fed the same diet (P < .05).
A mild, yet significant, hyperglycemia (11 mmol/L) developed in both HFD-fed WT and Fgf21−/− mice, compared with chow-fed mice (Figure 7B). Naringenin completely prevented hyperglycemia (8 mmol/L) in both genotypes. During a GTT, both HFD-fed genotypes demonstrated an exaggerated plasma glucose excursion, compared with chow-fed controls (Figure 7, D and F). Glucose intolerance in HFD-fed Fgf21−/− mice was significantly greater, as depicted by an increased glucose incremental AUC (Figure 7, F and F). Naringenin supplementation to the HFD in both genotypes normalized the glucose excursion curves, such that the incremental AUCs were similar to chow-fed mice (Figure 7, D, F, and H).
Discussion
Obesity, dyslipidemia, and type 2 diabetes are an emerging epidemic poised to place significant strain on global health resources (49). Increased visceral obesity has been linked to greater plasma concentrations of FFAs (50). However, due to its anatomical location, it has also been proposed that very few circulating FAs derived from visceral adipose tissue depots and released into the portal vein escape metabolism by the liver, thereby limiting direct contact with other tissues (51, 52). In this context, maintaining hepatic insulin sensitivity and reducing hyperinsulinemia-mediated de novo lipogenesis and the hepatic overproduction of TG-rich lipoproteins may prevent lipid deposition within peripheral tissues. It has been proposed that accretion of lipid metabolites in muscle activates signaling cascades leading to insulin resistance (53), which contributes to decreased glucose uptake and use (54). Therefore, therapeutic interventions that reduce hyperinsulinemia and prevent the overproduction of apolipoprotein B100-containing lipoproteins have the potential to reduce ectopic lipid accumulation and prevent metabolic dysregulation in insulin-resistant states. Previously we described naringenin to have potent lipid lowering properties in Ldlr−/− mice, which was associated with a significant up-regulation of FGF21 (11).
FGF21 plays an important role in the regulation of glucose, lipid, and energy homeostasis and has therapeutic potential (34, 55). To further elucidate the molecular mechanisms mediating naringenin's robust glucose and lipid lowering, we assessed the impact of FGF21 deficiency on the ability of naringenin to achieve metabolic protection. HFD-fed Fgf21−/− mice accumulated significantly more adipose tissue compared with their WT counterparts. Conversely, naringenin markedly attenuated HFD-induced fat accumulation in both WT and Fgf21−/− mice. The HFD amplified hepatic steatosis in Fgf21−/− mice, compared with WT animals. In contrast, naringenin completely normalized hepatic lipid accumulation, independent of genotype, through similar decreases in the hepatic expression of genes involved in lipogenesis and increases in the expression of those involved in FA oxidation. In Fgf21−/− mice, the HFD intensified hyperinsulinemia and impaired glucose tolerance relative to HFD-fed WT mice. Naringenin normalized plasma insulin, restored glucose homeostasis, and improved insulin sensitivity, even in the absence of FGF21. Although a HFD amplifies the metabolic dysregulation in Fgf21−/− mice, the ability of naringenin to attenuate adiposity, correct hepatic steatosis, and normalize glucose intolerance is independent of FGF21.
The most prominent phenotype in HFD-fed Fgf21−/− mice was enhanced weight gain (170%) and adiposity in both visceral (200%) and sc (180%) fat depots, compared with HFD-fed WT controls, despite no difference in caloric consumption (36, 48). A similar difference in phenotype was observed upon feeding Fgf21−/− mice either a chow, ketogenic diet, or a HFD, although the adipose tissue increases were more modest (36, 41, 48). However, a third strain of Fgf21−/− mice fed a HFD were reported to be leaner as compared with WT mice (56), and the reasons for this discrepancy are currently unknown (56). In the present study, HFD-fed Fgf21−/− mice demonstrated an increased size and number of lipid-rich adipocytes in epididymal fat compared to HFD-fed WT mice. Moreover, naringenin significantly attenuated adipose tissue accumulation and normalized adipocyte hypertrophy and hyperplasia.
Consistent with increased adiposity in HFD-fed Fgf21−/− mice was the almost 2-fold increase in plasma leptin compared with HFD-fed WT mice. However, naringenin significantly reduced circulating leptin levels, although the reduction was greater in WT than in Fgf21−/− mice. These data suggest that naringenin may enhance leptin sensitivity, thereby contributing to reduced fat mass. Hepatic expression of Lepr, known to be stimulated by FGF21 (27), was significantly increased by naringenin in WT but not in Fgf21−/− mice, suggesting that up-regulation of Lepr is FGF21 dependent. The lack of a significant effect of naringenin on hepatic Lepr expression, together with higher plasma leptin, may contribute to the residual adiposity in naringenin-treated Fgf21−/− mice.
The HFD-induced increase in plasma adiponectin in WT mice, but not in Fgf21−/− mice, has been observed previously (42). Although adiponectin is required for the metabolic improvements of exogenous FGF21 treatment (42, 57), it is not clear from the present studies whether the normal plasma levels of adiponectin in naringenin-treated mice represent a direct effect of naringenin or are a consequence of normalized adipose tissue mass.
Gene expression analysis in WAT provided limited insight into the mechanism of protection from diet-induced obesity conferred by naringenin. In WAT, exogenous FGF21 is known to induce Pgc1a mRNA and protein as well as potently induce Ucp1 expression (44). The latter effect has been linked to the browning of WAT, increased energy expenditure, and reduced adipose tissue mass with FGF21 treatment (27, 31, 44). The present study was conducted at 23°C and not at thermoneutrality, suggesting a small stimulus for the browning of WAT. However, the WAT pattern of Pgc1a mRNA suppression by HFD and its restoration by naringenin were similar in both genotypes, suggesting the naringenin effect on Pgc1a was FGF21 independent. In addition, in both WT and Fgf21−/− mice, Cpt1a mRNA expression in WAT was suppressed by the HFD, and its expression was unaltered by naringenin. Ucp1 expression was markedly decreased by the HFD in WT mice and, unexpectedly, was not changed by HFD feeding in Fgf21−/− mice. Furthermore, naringenin markedly increased WAT Ucp1 expression in WT mice and thus could provide an explanation for reduced adiposity. However, Ucp1 expression was unaffected by naringenin in Fgf21−/− mice, confirming that Ucp1 expression in WAT is FGF21 dependent (58). Nevertheless, the naringenin-induced attenuation of adipose tissue in Fgf21−/− mice was as great as (if not greater than) observed in WT mice. Also, we demonstrated previously that mice housed under the same conditions and fed a Western diet supplemented with naringenin do not perform better on a cold challenge test, suggesting they do not productively stimulate thermogenesis (12). Collectively differences in WAT adipose tissue expression of Pgc1a, Cpt1a, or Ucp1 are unable to explain the marked protection from obesity in naringenin-treated Fgf21−/− mice.
In WAT, adipose TG lipase (Pnpla2) and hormone-sensitive lipase (Lipe) mRNA code for enzymes responsible for TG and diacylglycerol lipolysis, respectively. Their regulation is modulated by PPAR activation, and mRNA levels in WAT are induced in Fgf21-transgenic mice (16). In the present study, WAT expression of Lipe was reduced in HFD-fed Fgf21−/− mice, as were Ppara and Pparg, compared with HFD-fed WT mice. This difference provides a partial explanation for the increased adiposity in HFD-fed Fgf21−/− mice. However, naringenin increased the expression of Pnpla2 and Lipe in WAT of both genotypes, suggesting that naringenin can overcome the effect of FGF21 deficiency on the expression of these genes. It also suggests that mice fed naringenin are shifting from FA storage to FA use. However, it is unclear whether this effect is a direct effect of naringenin on WAT or secondary to effects at other sites.
To determine whether prevention of adipose tissue accumulation was required for naringenin to improve markers of lipid and glucose homeostasis, we used Lepob/ob mice fed a low-fat semisynthetic diet. In contrast to C57BL/6 mice, naringenin administration to Lepob/ob mice did not affect body weight or attenuate adiposity. This implies that correction of metabolic abnormalities by naringenin in this model is independent of any difference in adipose tissue stores. In the Lepob/ob mice, naringenin reduced hepatic TG by approximately 65 mg/g tissue, indicating that despite significant steatosis, naringenin can reduce hepatic TG accumulation. Naringenin treatment normalized plasma insulin and improved hyperglycemia and glucose tolerance, providing further evidence that the primary effect of naringenin is not the prevention of HFD-induced adiposity.
Another striking phenotype observed in HFD-fed Fgf21−/− mice was the exacerbated hepatic lipid accumulation, demonstrating the importance of FGF21 in regulating the hepatic response to increased dietary fat. These data are consistent with Fgf21−/− mice fed a ketogenic diet, in which hepatic TGs increased markedly (36), and with C57BL/6 mice injected with FGF21, which prevented the development of diet-induced hepatic steatosis (31). FGF21 induces hepatic expression of Pgc1a, a key transcriptional regulator of energy homeostasis, and causes corresponding increases in FA oxidation (28, 29). Others have reported that when fed a ketogenic diet, hepatic Pgc1a expression is significantly lower in Fgf21−/− mice (36). In the current studies, HFD-fed Fgf21−/− mice exhibited reduced hepatic Pgc1a expression compared with HFD-fed WT mice. However, no differences between genotypes were observed in Cpt1a, consistent with previous reports that hepatic Cpt1a mRNA is not regulated in FGF21-treated or FGF21 transgenic mice (16, 27). In the current studies, naringenin increased Pgc1a, and Cpt1a expression, even in the absence of FGF21. Previous studies in Ldlr−/− mice demonstrated that the naringenin-induced increases in hepatic expression of Pgc1a and Cpt1a were associated with increased fatty acid oxidation. The present data are consistent with the concept that naringenin decreases hepatic TG and stimulates FA oxidation through a mechanism that does not require FGF21 or increased activation of PPARα.
Hepatic Srebf1c expression, an important regulator of lipogenesis, was significantly increased by the HFD; however, no genotype difference was observed, despite substantially greater plasma insulin levels in HFD-fed Fgf21−/− mice, compared with WT. Others have shown that Fgf21−/− mice fed a ketogenic diet displayed enhanced processing of SREBP-1c to its active nuclear form, which would be anticipated to increase hepatic lipogenesis and likely contributed to increased hepatic lipid accumulation (36). In the current study, the increased HFD-induced hepatic TG in Fgf21−/− mice was unrelated to FGF21-mediated differences in Srebf1c expression; however, increased formation of nuclear SREBP-1c, through an undefined mechanism, remains a possibility. Of significance, naringenin suppressed Srebf1c expression and hepatic steatosis to a similar extent in HFD-fed WT and Fgf21−/− mice, indicating that this property of naringenin did not require FGF21.
HFD-fed Fgf21−/− mice developed significant hyperinsulinemia and glucose intolerance compared with WT controls. For the first time, we show that a HFD in Fgf21−/− mice exacerbates ectopic lipid accumulation in muscle, potentially contributing to impaired glucose tolerance and insulin sensitivity, thereby implicating FGF21 in the regulation of lipid metabolism in muscle and consistent with the concept that FGF21 is a potent sensitizer of insulin action (55). Despite the marked hyperinsulinemia in HFD-fed Fgf21−/− animals, naringenin treatment completely normalized plasma insulin and improved both insulin and glucose tolerance. In vitro studies in HepG2 hepatocytes show that naringenin is an insulin sensitizer through activation of phosphatidylinositol 3-kinase and MAPKerk signaling pathways, independent of the insulin receptor (6). Moreover, the significant attenuation of hepatic and muscle TG accumulation, along with reduced adipose tissue, likely contributed to the enhanced insulin sensitivity observed in naringenin-treated Fgf21−/− mice.
These studies demonstrate that naringenin does not require FGF21 to improve metabolic dysregulation in HFD-fed mice. However, there are similarities between exogenous FGF21 and naringenin treatment of mice, including the prevention of obesity and hepatic steatosis, and an insulin-sensitizing effect (12, 27, 31, 32). Furthermore, both FGF21 and naringenin activate MAPK signaling and increase ERK1/2 phosphorylation, in vivo and in vitro, respectively (5, 29). It is possible that naringenin compensates for FGF21 deficiency by activating similar downstream signaling cascades, leading to increased expression of Pgc1a and Cpt1a.
It is also possible that naringenin mediates its effects through another FGF molecule. FGF21 belongs to the hormone-like subgroup of FGFs that includes FGF19 (FGF15 in mice) and FGF23 (59). Of interest, FGF19 transgenic mice have decreased adiposity, enhanced insulin sensitivity, and lower plasma glucose, TG, and cholesterol levels (60), similar to FGF21 transgenic animals (34). Administration of recombinant FGF19 to Lepob/ob mice decreased body weight, improved glucose tolerance, and prevented hepatic TG accumulation (61). In the present study, plasma concentrations of FGF15 were not affected by the HFD, naringenin, or genotype, suggesting that the protective effects of naringenin do not involve activation of FGF15 and that FGF15 does not play a compensatory role in the absence of FGF21. However, in Fgf21−/− mice, naringenin increases β-Klotho (Klb) expression in the liver, which possibly increases FGF15 activity. Furthermore, even though naringenin does not have a major effect on the expression of FGF21 receptors, Fgfr1 and Fgfr2, in liver or adipose, it is possible that naringenin signals through the primary FGF21 receptor complex (FGFR1/β-Klotho), independent of FGF21, thereby achieving metabolic protection. Further studies are required to examine this hypothesis.
In conclusion, these studies provide in vivo evidence that in response to a HFD, FGF21 plays a key role regulating adiposity as well as glucose and lipid homeostasis. Furthermore, we show that the flavonoid naringenin can protect against metabolic perturbations induced by high-fat feeding in the presence or absence of FGF21. Therefore, naringenin does not require FGF21 to mediate is effects. Nevertheless, these studies raise the possibility that naringenin may share similar signaling pathways with FGF21.
Acknowledgments
We acknowledge Jane Edwards and Joy Dunmore-Buyze (Robarts Research Institute) for technical assistance and Dr Robert Hegele (Robarts Research Institute) for his insight and helpful suggestions.
Author contributions include the following: J.M.A., E.E.M., and M.W.H. conceptualized and designed the study and wrote the manuscript; J.M.A., E.E.M., A.C.B., B.G.S., D.E.T., S.S.C., C.G.S., and A.C.A. performed the experiments, and all authors participated in analyzing and interpreting the data and editing and reviewing the manuscript.
Current address for A.K.: Department of Chemistry, College of Arts and Sciences, Indiana University Bloomington, Bloomington, Indiana.
This work was supported by the Heart and Stroke Foundation of Ontario Grants T-7007 and PG-5967 (to M.W.H.) and the Department of Medicine (POEM), University of Western Ontario. J.M.A. was supported by a Heart and Stroke Foundation of Ontario Masters Award, E.E.M. was supported by a Canadian Institute of Health Research-Canada Graduate Scholarship Doctoral Award, and A.C.B. is supported by a Canadian Diabetes Association Doctoral Research Award. M.D. is a Career Investigator of the Heart and Stroke Foundation of Ontario.
Disclosure Summary: A.C.A. is employed by Eli Lilly and Company. At the time of this study, A.K. was an employee of Eli Lilly and Company. The other authors have nothing to declare.
Abbreviations
- AUC
area under the curve
- micro-CT
micro-computed tomography
- FA
fatty acid
- FFA
free fatty acid
- FGF
fibroblast growth factor
- FGFR
FGF receptor
- GTT
glucose tolerance test
- HFD
high-fat diet
- ITT
insulin tolerance test
- PPAR
peroxisome proliferator-activated receptor
- SREBP-1c
sterol response element binding protein 1c
- TG
triglyceride
- WAT
white adipose tissue
- WT
wild type.
References
Author notes
J.M.A. and E.E.M. contributed equally to this article.
