


Adults born preterm are at increased risk of impaired glucose tolerance and diabetes. Late gestation fetuses exposed to high blood glucose concentration also are at increased risk of impaired glucose tolerance as adults. Preterm babies commonly become hyperglycemic and are thus exposed to high blood glucose concentration at an equivalent stage of pancreatic maturation. It is not known whether preterm birth itself, or complications of prematurity, such as hyperglycemia, alter later pancreatic function. To distinguish these, we made singleton preterm lambs hyperglycemic (HYPER) for 12 days after birth with a dextrose infusion and compared them with vehicle-treated preterm and term controls and with HYPER lambs made normoglycemic with an insulin infusion. Preterm birth reduced β-cell mass, apparent by 4 weeks after term and persisting to adulthood (12 mo), and was associated with reduced insulin secretion at 4 months (juvenile) and reduced insulin mRNA expression in adulthood. Hyperglycemia in preterm lambs further down-regulated key pancreatic gene expression in adulthood. These findings indicate that reduced β-cell mass after preterm birth may be an important factor in increased risk of diabetes after preterm birth and may be exacerbated by postnatal hyperglycemia.
Preterm babies are at increased risk of type 2 diabetes in later life (1). They have decreased insulin sensitivity (SI) in childhood, with a compensatory increase in acute insulin secretion (2, 3), and evidence of insulin resistance (4). Young adults born preterm are more likely to require prescriptions for diabetes than term-born controls, with most of these being for insulin, indicating that there is impaired β-cell function after preterm birth (5). However, it is not known which factors associated with preterm birth are responsible for later impaired glucose homeostasis. Preterm birth may be a marker for an adverse fetal environment; for example, periconceptional undernutrition in sheep can cause both preterm birth (6) and insulin resistance in the offspring (7). Alternatively, premature exposure to the ex utero environment or complications associated with preterm birth may alter development of physiological systems in ways that predispose to disease risk (8).
Hyperglycemia is common in preterm babies, with 80% of extremely low birth weight (ELBW) babies experiencing high blood glucose concentrations (BGCs) (9). The etiology is multifactorial, including relative insulin resistance and immature processing of proinsulin to insulin (10), persistent endogenous glucose production (11), and an iatrogenic component due to a large iv glucose load (12). Neonatal hyperglycemia is associated with increased short-term mortality and morbidity, such as sepsis, retinopathy of prematurity and necrotizing enterocolitis (NEC) (13–16). We have replicated some of these findings in preterm lambs with experimentally induced hyperglycemia (17). However, there are no data on the long-term metabolic effects of hyperglycemia after preterm birth. Exposure of fetuses to hyperglycemia in late gestation results in decreased insulin secretion in response to secretagogues in fetal sheep (18) and in response to a glucose challenge in adult rat offspring (19), and offspring of women with diabetes have an increased rate of type 2 diabetes beyond that expected from genetic or environmental factors alone (20) which may be due to impaired insulin secretion (21). These data indicate that the pancreas in late gestation, at an equivalent stage of maturity to that of the preterm baby, is susceptible to altered development in response to prevailing glucose concentrations.
If early exposure to high BGC in preterm babies alters pancreatic development and contributes to an increased risk of type 2 diabetes in later life, it is possible that this could be reversed by neonatal insulin treatment, a common management for neonatal hyperglycemia (22), with benefits for long-term health. However, there are few data on the relative risks and benefits of this treatment (23, 24) and none on the long-term effects on later pancreatic function.
We, therefore, studied preterm lambs, to investigate the effect of: 1) preterm birth itself, 2) exposure to neonatal hyperglycemia, and 3) treatment of neonatal hyperglycemia with insulin, on insulin secretion, glucose tolerance, β-cell mass and expression of key genes involved in pancreatic development and insulin secretion in later life. Our findings suggest that preterm birth itself can have long-term effects on pancreatic β-cell mass and gene expression and also provide evidence that a complication of preterm birth, hyperglycemia, can exacerbate these long-term metabolic consequences.
Materials and Methods
Animals
The University of Auckland Animal Ethics Committee approved all experiments. Details of the animal paradigm have been described previously (17). Briefly, single-bearing time-mated ewes had labor induced with 2 im injections of 0.25 mg kg−1 dexamethasone sodium phosphate (Dexa 0.2; Southern Veterinary Supplies) 12 hours apart, commencing on day 135 with preterm lambs born on day 137. Preterm lambs were randomized to hyperglycemic (HYPER), preterm control (PremC), and insulin-treated (INS) groups. Term control (TermC) sheep were born spontaneously at 148 ± 2 days. Lambs were housed in individual pens with their mothers and within sight of others.
Vascular catheters were inserted on the day after birth as described previously (17) for infusion of dextrose (+/−insulin) (Walkmed Plus; REM Systems Ltd) or saline (Beeline; REM Systems Ltd.). Hyperglycemia was induced in HYPER and INS sheep with a continuous infusion of 50% dextrose containing 10 U mL−1 heparin for 12 days (17). The infusion rate was adjusted twice daily to maintain arterial BGC of 10–12 mmol L−1 (Yellow Springs Instruments 2300). In INS sheep, once hyperglycemia was achieved, an insulin infusion (Actrapid, Health Support Ltd) was commenced at 0.1 U kg−1 per h−1, and titrated to maintain BGC of 4–6 mmol L−1 comparable with concentrations in TermC and PremC (17). PremC and TermC sheep received heparinized 0.9% saline at a daily volume equivalent to that received by the HYPER sheep. PremC lambs had low mortality but moderate morbidity as reported previously (17). HYPER lambs had significantly increased morbidity and mortality compared with PremC, which was ameliorated by insulin treatment, although the INS group had a higher rate of hypoglycemia (17). At the end of the 12-day infusion period, catheters were removed from surviving lambs that were then observed for 1–2 days before being returned to pasture with their mothers. These surviving lambs make up the animals reported in this manuscript.
Intravenous glucose tolerance test (ivGTT) and hyperglycemic clamps (HGCs)
Healthy sheep were brought indoors 4 months (male [M]/female [F], TermC 8M/4F, PremC 6M/10F; HYPER 8M/6F, and INS 8M/4F) and 10 months (TermC 8M/4F; PremC 6M/9F; HYPER 6M/6F, and INS 7M/5F) after birth (not adjusted for prematurity), housed in individual pens, and fed concentrates. Differing numbers are due to mortality between assessments or to animals not being fit for assessment at a given time point. After a 2-day acclimatization period, indwelling catheters were inserted into both jugular veins under local anesthetic as described previously (7).
ivGTT and HGC were performed as described previously (7, 25) with minor modifications including a 100 mg kg−1 bolus of iv arginine after 135 minutes of steady state hyperglycemia (see Supplemental Materials and Methods). Arginine is a potent stimulant of insulin secretion, used in combination with an HGC to maximize insulin secretion. The HGC was performed at mean of 3.6 (SD 0.9) days after the ivGTT. HGC data from 6 sheep (TermC 2M; PremC 2F; HYPER 1M, and INS 1F) were excluded from analysis as the a priori criterion of a coefficient of variation (CV) for glucose concentration during the steady state period of less than or equal to 10% was not met.
Pancreatic tissue collection
Four weeks after term, at a similar postconceptional age but, therefore, different chronological ages, a randomly selected subgroup of sheep (TermC 3M/3F; PremC 2M/4F; HYPER 3M/5F, and INS 1M/4F) was killed with an overdose of pentobarbitone (0.25 mL kg−1). At 12 months of chronological age, not corrected for prematurity, remaining animals (TermC 9M/4F; PremC 5M/7F; HYPER 7M/6F, and INS 7M/6F) were killed by stunning with a captive bolt pistol followed by rapid exsanguination. Before postmortem at 4 weeks after term, lambs received 2 iv injections 24 hours apart of 100 mg kg−1 bromodeoxyuridine (BrdU) (Roche Diagnostics New Zealand Ltd), a synthetic analog of thymidine that is incorporated into proliferating cells. The cost of BrdU in adult animals at 12 months of age would have been prohibitive and an alternative method for determining proliferation was used (see below). At postmortem, the pancreas was rapidly dissected, weighed, and cut in half along the head-tail axis such that each half contained representation of all parts of the pancreas. Half was immediately frozen on dry ice and stored at −80°C for molecular biology analysis; the other half was placed in 4% paraformaldehyde (Scharlau) for immunohistochemical analysis. The carcass was weighed after removal of all body organs.
Immunohistochemistry
For details, please refer to Supplemental Materials and Methods for details. Fixed pancreata containing head, body, and tail from 5 animals in each group were sectioned with 5-μm thickness. Every 20th section, 100 μm apart, was selected for immunostaining (n = 6 per animal). Immunofluorescent staining was performed using: insulin and glucagon/somatostatin to determine β-cell and α/δ-cell area and number; insulin and BrdU (4 wk after term) or Ki67, a cellular protein marker of proliferation encoded by the MKI67 gene, (12 mo) to determine β-cell proliferation, and insulin and active-caspase 3 to determine β-cell apoptosis. 4′,6-diamidino-2-phenylindole (DAPI) was used as a nuclear stain.
Ten to 12 randomly selected fields of view (FOVs) (0.11 mm2) from each section were photographed at ×400 magnification on a fluorescence Olympus Inverted IX7I microscope (Olympus New Zealand Ltd) using imaging software (DP Controller 1.1.1.65; Olympus). The photographs were analyzed by automated image analysis (Metamorph image-analysis software, version 6.2.6; Molecular Devices) (26). The Metamorph script counted blue as DAPI stained nuclei; red stain surrounding the nuclei as insulin-positive β-cells, and green stain surrounding the nuclei as either glucagon/somatostatin positive α/δ-cells, active-caspase 3 positive apoptotic cells, or BrdU/Ki67-positive proliferating cells.
Hormone and enzyme analysis
Plasma ovine insulin concentrations were measured by specific RIA established and validated for maternal and fetal sheep plasma as described previously (27). The minimal detectable concentration was 0.03 ng mL−1, and the inter- and intraassay CVs were 11.1% and 11.0%, respectively.
The active forms of glucagon-like peptide (GLP)1 (GLP1 [7–36 amide] and GLP1 [7–37]) were quantified in 100 μL of diluted total pancreatic protein lysates by using GLP1 (Active) ELISA kit (EGLP-35K; Abacus ALS) following the manufacturer's instruction. The minimal detectable concentration was 2 pM. The intra- and interassay CVs were 5% and 7%, respectively. Using the standard samples, a linear-linear spline fit curve of absorbance vs concentration was plotted and the concentration of active forms of GLP1 in the pancreatic lysates was extrapolated from the standard curve.
Glucokinase enzyme activity in the total protein lysates was determined using a combination of ultra performance liquid chromatography (UPLC) and mass spectometry. Fifty milligrams of frozen powdered pancreata were homogenized in 0.5 mL of lysis buffer (see Supplemental Materials and Methods) to obtain total pancreatic protein lysates, and 20 μL of the total protein lysate were then combined with 170 μL of the reaction mixture (158 μL of 50 mmol/L filtered HEPES [pH 7.5], 10 μL of 10 mmol L−1 ATP, and 2 μL of 100 mmol L−113C6-D-glucose) and incubated at 37°C for 20 minutes. The same mixture, but without pancreatic lysate, was used as a blank. The reaction was stopped by incubating at 80°C for 5 minutes. A total of 10 μL of 10 μg mL−1 3-hydroxytyrosol was then added as the internal standard and mixed with the sample. Each sample then was transferred to a Nanosep 3K Omega centrifugation device (Pall Corp) and centrifuged at 14 000 rpm at 4°C for 15 minutes. Supernatants (containing only molecules with a molecular weight of <3000) were then transferred to UPLC vials for analysis and injected onto a UPLC mass spectrometer.
For quantitation purposes, standards of synthetic glucokinase enzyme concentrations (0.02–0.0001 enzyme units) were processed in the same way. A standard curve of known glucokinase enzyme concentration vs measured 13C6-D-glucose-6-phosphate to 3-hydroxytyrosol peak area ratio was plotted. The enzyme units in the total protein lysates was determined from area ratio of the 2 peaks using the standard curve. Refer to Supplemental Materials and Methods for additional details.
Molecular analysis
Total RNA was extracted from approximately 50 mg of ground frozen pancreatic tissue samples using TRIzol reagent (Invitrogen) according to the manufacturer's recommendations, and quantified using the Nanodrop. RNA integrity of the samples was assessed by running a 1% wt/vol agarose gel. cDNA was synthesized with 2.5 μg of RNA using the SuperScript VILO cDNA Synthesis kit (Invitrogen) as described previously (28).
Real-time PCR was performed using TaqMan Gene expression assay in the ABI Prism 7900HT Sequence Detector (Applied Biosystems) with the default cycle set as described previously (28). Ovine or porcine sequences were used for designing primers and probe where available (Supplemental Table 1). PCR amplicons were verified by running 2% wt/vol agarose gel and gel extracted and purified using QIAquick Gel extraction kit (QIAGEN, Bio-Strategy Ltd). The gel-extracted and purified PCR products were sequenced to confirm the identity of the amplicons.
Statistical analysis
Parametric data were analyzed by ANOVA, with Tukey correction for multiple comparisons. Nonparametric data were log-transformed to approximate a standard distribution if possible; else data were analyzed by Mann-Whitney U or the Median test as appropriate. Categorical data were analyzed by χ2 test. When data from 2 samples for 1 animal were available a mean of the data from the 2 samples was used. The 4 treatment groups were initially compared by ANOVA. Multiple regression analysis was then performed, with perinatal interventions (preterm birth, dextrose infusion, and insulin infusion) and sex as covariants. Repeated samples over time were analyzed by repeated measures ANOVA or factorial ANOVA with time as a variable if there were missing data.
This technique has been shown to correlate with SI from euglycemic hyperinsulinemic clamps (29).
Data from studies at 4 and 10 months were compared using a paired t test.
Data are presented as mean (SEM), mean (95% confidence interval [CI], or median [interquartile range] as appropriate). A P < .05 was taken as statistically significant.
mRNA data were analyzed as fold change in mRNA expression levels of target gene in the treatment group relative to its expression in the control group (32). The target gene expression was normalized with the BestKeeper index of 3 housekeeping genes (rpl19, 18S or cyclophillin A, and gapdh), selected from a panel of potential housekeeping genes as described previously (33). Data are expressed as fold change relative to the comparison group, normalized by the BestKeeper index and with 99% CIs.
Results
Preterm birth reduces β-cell mass
To investigate whether preterm birth affects long-term pancreatic development, we compared lambs born preterm (induced with glucocorticoid) with those born at term (TermC). We randomized preterm lambs to 12 days of a control saline infusion (PremC), dextrose-induced hyperglycemia (HYPER), or hyperglycemia treated with insulin to restore euglycemia (INS). We previously have reported the short-term morbidity, growth rates and mortality in these lambs (17). Baseline glucose concentrations on the day of birth in the lambs that went on to survive to adulthood and that are reported in this manuscript were not statistically different among groups but tended to be higher in TermC (TermC 8.7 [0.94] mmol L−1; PremC 5.8 [0.78] mmol L−1; HYPER 6.9 [1.7] mmol L−1, and INS 5.7 [0.67] mmol L−1; P = .08). Baseline plasma insulin concentrations were higher in TermC than in all preterm groups, which were not different from each other (TermC 3.7 [0.86] ng mL−1; PremC 0.42 [0.087] ng mL−1; HYPER 0.45 [0.082] ng mL−1, and INS 0.47 [0.10] ng mL−1; P < .001). During the infusion period, BGCs were not different between PremC and TermC (5.4 [0.2] vs 5.6 [0.2] mmol L−1). In HYPER lambs, BGCs were approximately twice those of PremC and TermC (10.4 [0.2] mmol L−1, P < .001); insulin treatment restored euglycemia with INS BGCs only slightly higher than PremC and TermC (P < .05) and significantly less than HYPER (INS 6.2 [0.2]) mmol L−1, P < .001). Insulin concentrations during the infusion period were significantly lower in PremC (0.96 [0.53–1.51] ng mL−1) than in any other group (P < .01: TermC, 1.53 [1.1–2.95] ng mL−1; HYPER, 2.83 [1.74–3.76] ng mL−1, and INS, 3.02 [1.13–9.18] ng mL−1). Insulin concentrations between INS and HYPER were not significantly different, but were greater in INS than in TermC (P < .05).
At 4 weeks after term, PremC and HYPER lambs had reduced absolute and relative β-cell mass compared with TermC lambs (Figures 1 and 2). HYPER lambs also had reduced β-cell number per FOV compared with TermC lambs. INS lambs had a reduced β-cell apoptosis to proliferation ratio compared with PremC and HYPER lambs (Figures 1 and 2). The percentage of small islets was not significantly different among groups (TermC 8.8 [0.7]%, PremC 10.2 [0.7]%, HYPER 8.6 [0.7]%, and INS 9.5 [0.7]%; P = .36). Multivariate regression analysis to investigate the independent effects of preterm birth, neonatal dextrose infusion, insulin infusion, and sex indicated that preterm birth was associated with reduced β-cell mass (β-coefficient [SE], −0.37 [0.09]), reduced β-cell mass relative to body weight (β-coefficient [SE], −0.002 [0.001]) and reduced numbers of β-cells (−9.55 [4.05]), but not with changes in β-cell apoptosis or proliferation. There was no effect of sex at this age.
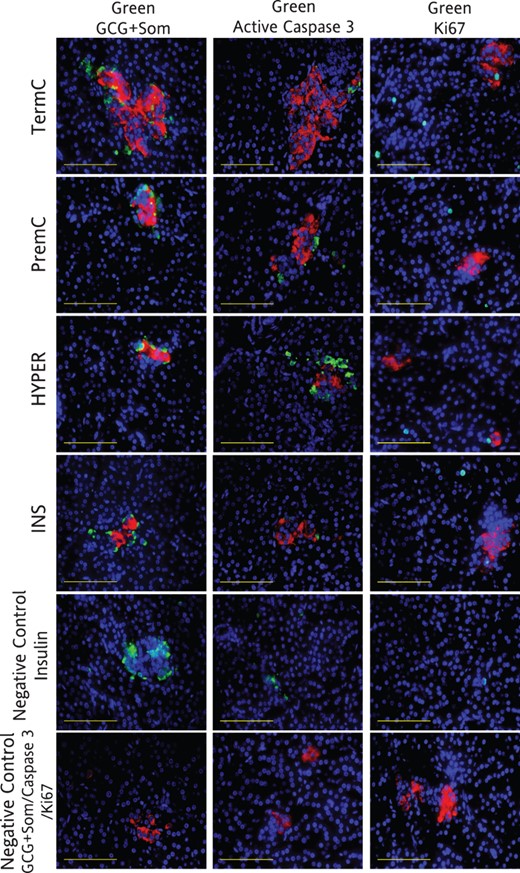
Representative photomicrographs of pancreatic immunofluorescent histochemistry at 4 weeks after term in TermC, PremC, HYPER, and INS sheep

Negative controls are no primary antibody controls for insulin, active caspase 3, and BrdU, respectively (for antibodies, see Table 2). All images have insulin (red, except negative controls) and DAPI (blue, DAPI staining is not shown in column 2). Column 1: green, active caspase 3; column 2: green, BrdU. Image magnified ×400. Scale bar, 100 μm.
Antibody Table
| Peptide/protein target | Antigen Sequence (if known) | Name of Antibody | Manufacturer, Catalog Number, and/or Name of Individual Providing the Antibody | Species Raised in; Monoclonal or Polyclonal | Dilution Used |
|---|---|---|---|---|---|
| Insulin | Antiinsulin | Sapphire Bioscience, ab6995 | Mouse; monoclonal (K36aC10) | 1:8000 (4 wk); 1:750 (12 mo) | |
| Glucagon | Antiglucagon | Sapphire Bioscience, ab18461 | Rabbit; polyclonal | 1:500 | |
| Somatostatin | Antisomatostatin | Abacus ALS, AB5494 | Rabbit; polyclonal | 1:250 | |
| Cells that have incorporated BrdU | Anti-BrdU | Roche Diagnostics, 11170376001 | Mouse; monoclonal | 1:200 | |
| Ki67 | Anti-Ki67 | Sapphire Bioscience, ab15580 | Rabbit; polyclonal | 1:100 | |
| Active + procaspase 3 | Antiactivated caspase 3 | Sapphire Bioscience, ab13847 | Rabbit; polyclonal | 1:100 (4 wk); 1:200 (12 mo) | |
| γ-Immunoglobins heavy and light chains | Antirabbit IgG (H + L) secondary antibody, Alexa Fluor 488 conjugate | Invitrogen, A-11034 | Goat; polyclonal | 5 μg/mL | |
| γ-Immunoglobins heavy and light chains | Antimouse IgG (H + L) secondary antibody, Alexa Fluor 594 conjugate | Invitrogen, A-11032 | Goat; polyclonal | 5 μg/mL |
β-Cell parameters in pancreata from sheep euthanized at 4 weeks after term
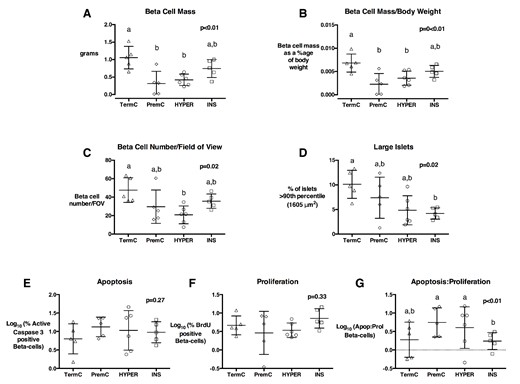
A, β-Cell mass; (B) β-cell mass adjusted for body weight; (C) β-cell number per FOV (D) percentage of large islets; (E) % apoptotic β-cells; (F) % proliferating β-cells, and (G) ratio of apoptotic: proliferating β-cells in TermC (n = 3M/2F), PremC (n = 2M/3F), HYPER (n = 3M/3F), and INS (n = 1M/4F) sheep at 4 weeks after term. Overall, P values are from an ANOVA, nonmatching letters indicate a significant difference (P < .05) among groups on post hoc analysis. Data are individual animal data with mean and SEM superimposed.
At 12 months of age, absolute and relative β-cell mass were approximately 65% lower in all preterm born sheep (PremC, HYPER, and INS) compared with TermC sheep, and β-cell number per FOV in PremC sheep was 56% lower than TermC sheep (Figures 3 and 4). All preterm-born sheep had approximately 70% fewer large islets compared with TermC sheep (Figures 3 and 4). The percentage of small islets was not significantly different among groups (TermC 9.6 [1.0]%, PremC 9.9 [1.1]%, HYPER 11.3 [1.1]%, and INS 12.0 [1.1]%; P = .33). PremC sheep had greater rates of β-cell apoptosis and lesser rates of β-cell proliferation than TermC sheep, resulting in a greater β-cell apoptosis to proliferation ratio (Figure 4). HYPER sheep also had greater β-cell apoptosis and a significantly greater β-cell apoptosis to proliferation ratio than TermC sheep, whereas INS sheep were not different from TermC. Multivariate regression analysis indicated that preterm birth was associated with reduced β-cell mass (β-coefficient [SE] −0.22 [0.02] g), number (−0.39 [0.04] log10 values), percentage of large islets (−3.8 [0.2]%) and β-cell proliferation (−2.3 [0.4]%) and with increased β-cell apoptosis (3.5 [0.8]%) and β-cell apoptosis to proliferation ratio (0.5 [0.1] log10 values). Neonatal dextrose infusion was independently associated with increased β-cell apoptosis (2.5 [0.8]%), but had no effect on β-cell proliferation and apoptosis to proliferation ratio. Insulin infusion was associated with reduced β-cell apoptosis and reduced β-cell apoptosis to proliferation ratio (−4.7 [0.8] %, and −0.3 [0.1] log10 values, respectively). There was no effect of sex when β-cell mass was adjusted for body weight.
Representative photomicrographs of pancreatic immunofluorescent histochemistry at 12 months of age in TermC, PremC, HYPER, and INS sheep
Negative controls are no primary antibody controls for insulin, glucagon plus somatostatin, active caspase 3, and Ki67, respectively. All images have insulin (red, except negative controls) and DAPI (blue). Column 1: green, glucagon (GCG) plus somatostatin (Som); column 2: green, active caspase 3; column 3: green, Ki67. Image magnified ×400. Scale bar, 100 μm.
Quantification of β-cell parameters in 12-month-old sheep
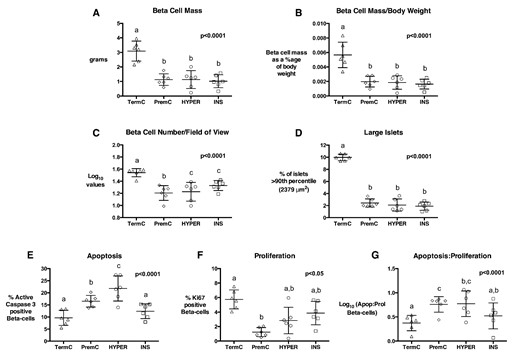
β-Cell mass (A), β-cell mass adjusted for body weight (B), β-cell number per FOV (C), percentage of large islets (D), % β-cells undergoing apoptosis (E), % proliferating β-cells (F), and β-cell apoptosis: proliferation ratio (G) in TermC (n = 3M/3F), PremC (n = 3M/3F), HYPER (n = 3M/3F), and INS (n = 3M/3F) sheep. Overall, P values are from an ANOVA, nonmatching letters indicate a significant difference (P < .05) among groups on post hoc analysis. Data are individual animal data with mean and SEM superimposed.
Preterm birth and neonatal hyperglycemia do not alter pancreatic GLP1 concentration
Incretins, which include the hormones glucose-dependent insulinotropic polypeptide and GLP1, have been shown to increase β-cell proliferation (34) and decrease β-cell apoptosis (35) in the INS-1 β-cell line. More recently, GLP1 also has been reported to be produced by pancreatic α-cells in vitro and in vivo (36), suggesting a possible paracrine action on β-cells (36). To investigate whether changes in pancreatic β-cell mass, apoptosis and proliferation were associated with changes in pancreatic GLP1 levels we determined pancreatic GLP1 concentration by ELISA. Pancreatic GLP1 concentration was not different among the preterm groups (PremC, HYPER, and INS) or between preterm groups and the TermC group at 4 weeks after term or 12 months of age (Supplemental Figure 1), nor between sexes.
Preterm birth and neonatal hyperglycemia lead to short-term increases in mRNA expression of key pancreatic genes, but this effect is reversed by young adulthood
To investigate potential mechanisms underlying changes in β-cell parameters after preterm birth, hyperglycemia and its treatment with insulin, we measured mRNA levels of pdx1, a transcription factor involved in β-cell development; igf1 and igf2, growth factors involved in β-cell development; glut2 (slc2a2), the β-cell glucose transporter that regulates glucose entry into the β-cell; glucokinase, the rate-limiting enzyme in β-cell glucose metabolism and the putative “glucose sensor,” and insulin. At 4 weeks after term, mRNA expression of insulin was lower, but that of pdx1, igf1, glucokinase, and glut2 was greater in PremC than TermC lambs (Table 1). HYPER lambs demonstrated a further up-regulation of mRNA expression of all these genes apart from glut2 compared with PremC. In INS lambs mRNA expression levels of all genes were significantly lower than in HYPER lambs, and similar to levels in PremC, apart from insulin, which was further up-regulated.
Pancreatic mRNA Expression Levels at 4 Weeks After Term (4 wk) and 12 Months of Age (12 mo) Relative to TermC (4 wk, 3M/3F; 12 mo, 9M/4F)
| Genes | PremC | Hyper | INS |
|---|---|---|---|
| pdx1 | |||
| 4 wk | 1.44 (1.03–2.01)a | 1.95 (1.93–1.97)b | 1.23 (1.19–1.27)a |
| 12 mo | 2.00 (0.68–5.87)a | 0.78 (0.24–2.51)b | 1.31 (0.43–4.00)ab |
| igf1 | |||
| 4 wk | 2.52 (1.32–4.81)a | 3.23 (2.53–4.13)b | 1.65 (1.07–2.54)a |
| 12 mo | 2.21 (0.92–5.29)a | 0.92 (0.35–2.44)b | 2.10 (0.70–6.29)ab |
| igf2 | |||
| 4 wk | 0.92 (0.79–1.06)a | 1.36 (1.33–1.39)b | 0.95 (0.88–1.03)a |
| 12 mo | 0.73 (0.64–0.84)a | 0.79 (0.57–1.08)ab | 0.92 (0.64–1.33)b |
| glut2 | |||
| 4 wk | 2.68 (2.31–3.10)a | 2.70 (2.43–2.99)a | 1.90 (1.47–2.45)b |
| 12 mo | 0.82 (0.42–1.63)a | 0.83 (0.44–1.57)a | 0.79 (0.43–1.46)a |
| glucokinase | |||
| 4 wk | 1.46 (1.17–1.81)a | 1.90 (1.88–1.92)b | 1.31 (0.95–1.81)a |
| 12 mo | 0.61 (0.41–0.92)a | 0.56 (0.33–0.82)b | 0.58 (0.36–0.94)ab |
| insulin | |||
| 4 wk | 0.83 (0.80–0.87)a | 1.37 (1.30–1.45)b | 1.89 (1.71–2.09)c |
| 12 mo | 0.69 (0.51–0.93)a | 0.70 (0.55–0.88)a | 0.60 (0.41–0.88)a |
Pancreatic mRNA expression levels in PremC (4 wk, 2M/4F; 12 mo, 5M/7F), HYPER (4 wk, 2M/4F; 12 mo, 7M/6F), and INS (4 wk, 1M/4F; 12 mo, 7M/6F) relative to levels in TermCs. Data are normalized with RPL19, 18S, Cyclophillin, and GAPDH and shown as fold change with 99% CIs (given in parenthesis). If CIs do not include 1, then mRNA expression levels are statistically different from TermC at the 1% level. Preterm groups not represented by same letter have significantly different mRNA expression levels.
The reduced mRNA expression of insulin in PremC sheep persisted to 12 months of age, at which time igf2 mRNA also was reduced compared with TermC. In contrast to the up-regulation 4 weeks after term, glucokinase mRNA was reduced at 12 months compared with TermC sheep (Table 1). In HYPER sheep, mRNA expression of pdx1, igf1, and glucokinase were further reduced compared with PremC sheep. Expression levels in INS sheep were similar to those in HYPER sheep. There was no statistical difference in mRNA expression between sexes at either age.
Pancreatic glucokinase activity was not different among groups at 4 weeks after term or 12 months of age
To determine whether changes in pancreatic glucokinase mRNA expression were reflected in altered enzyme activity, a UPLC-Mass spectrometry technique was developed to measure glucokinase enzyme activity in total pancreatic protein lysates. Four weeks after term, there was no difference in glucokinase activity among groups (Supplemental Figure 2). At 12 months of age, there was a trend towards reduced glucokinase activity in all the preterm born sheep compared with term born sheep (P < .1) (Supplemental Figure 2). There was no effect of sex at either age.
Preterm birth impairs pancreatic insulin secretory capacity but does not alter glucose tolerance by young adulthood
To determine whether the effects of preterm birth, neonatal hyperglycemia and its treatment with insulin on β-cell mass and pancreatic gene expression were reflected in altered regulation of the glucose-insulin axis, we undertook an ivGTT and HGC with arginine challenge at 4 months (juvenile) and 10 months (after puberty) of age. Baseline plasma glucose and insulin concentrations were similar in all groups at both ages (Figure 5 and Supplemental Table 2). In multivariate analysis, neonatal hyperglycemia was associated with increased baseline glucose concentrations at 10 months of age (Supplemental Table 2). There was no effect of preterm birth, neonatal hyperglycemia or its treatment with insulin on glucose or insulin AUC from the ivGTT at either 4 or 10 months of age (Figure 5 and Supplemental Table 2). F sex was associated with reduced insulin AUC and reduced insulin AUC: glucose AUC ratio (Supplemental Table 2).
GTT plasma glucose concentration (A), plasma insulin concentration (B), and insulin to glucose ratio (C) values at 4 months (left) and 10 months (right) of age
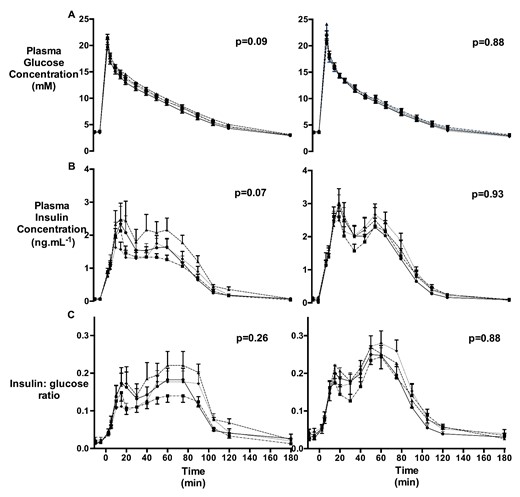
TermC (triangle; 4 mo: n = 8M/4F, 10 mo: n = 8M/4F), PremC (diamond; 4 mo: n = 6M/10F, 10 mo: n = 6M/9F), HYPER (circle; 4 mo: n = 8M/6F, 10 mo: n = 6M/6F), and INS (square; 4 mo: n = 8M/4F, 10 mo: n = 7M/5F). P values refer to the group effect. Data are mean with SEM.
SIR AUC tended to be reduced in PremC lambs at 4 months of age (P = .06) and in HYPER and INS sheep at 10 months of age (P = .09). There were no differences among the groups in BGC or plasma insulin concentration 5 minutes after the initial dextrose bolus of the HGC (Supplemental Table 3) and no differences in the first-phase insulin response AUC, SIR AUC, insulin response to the arginine bolus or in SI determined by the HGC (Figure 6 and Supplemental Table 3). In multivariate analysis, preterm birth was associated with decreased SIR AUC but increased SI at 4 months of age (Supplemental Table 3). Neonatal dextrose infusion was associated with increased FI and SIR AUC at 4 months but decreased SIR AUC at 10 months of age (Supplemental Table 3). F sex also was associated with reduced insulin secretion (Supplemental Table 3).
HGC blood glucose and plasma insulin concentrations
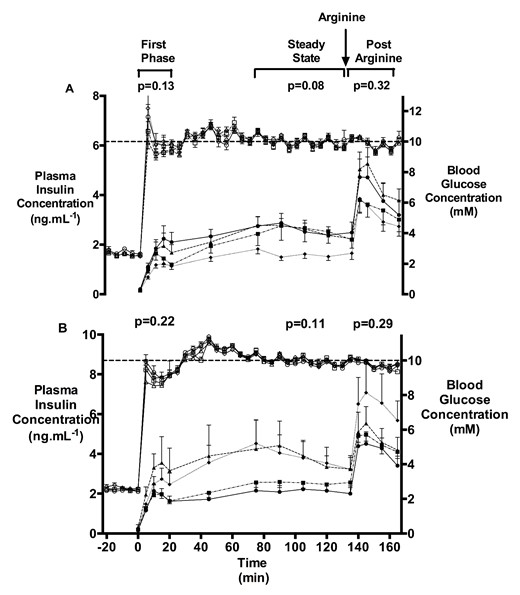
Blood glucose (open symbols) and plasma insulin concentrations (closed symbols) during a HGC and arginine challenge at 4 months (A) and 10 months (B) of age in TermC (triangle; 4 mo: n = 6M/4F, 10 mo: n = 8M/4F), PremC (diamond; 4 mo: n = 6M/8F, 10 mo: n = 6M/9F), HYPER (circle; 4 mo: n = 7M/5F, 10 mo: n = 6M/6F), and INS (square; 4 mo: n = 8M/3F, 10 mo: n = 7M/5F). Dotted line shows BGC of 10mM. Arrow indicates time of arginine administration. P values are the group effect on RM ANOVA. Data are mean with SEM.
SI decreased with age (15.9 [1.4] vs 13.3 [1.2] μmol·mL·kg−1·min−1·ng−1, P = .04), with no differences among the groups. There was no difference in disposition index (35.3 [2.7] vs 34.3 [3.3] μmol kg−1 min−1, P = .55) or SIR AUC (130.7 [10.4] vs 172.2 [17.7] ng mL min−1, P = .10) between 4 and 10 months of age. PremC sheep had an increase (P = .01), whereas HYPER sheep tended to have a reduction (P = .07) in SIR AUC from 4 to 10 months of age.
Discussion
The aim of this study was to determine whether preterm birth and its common complication, hyperglycemia, affect short- and long-term development of the pancreas. We have shown that, in sheep, preterm birth leads to a substantial reduction in β-cell mass by early adulthood and in altered insulin secretory profiles by the pancreas in response to glucose stimulation. These changes may be secondary to both altered β-cell turnover and β-cell responsiveness to glucose. It is known that preterm babies, even after only moderately preterm birth, have decreased SI in childhood (2) and in early adulthood (37, 38), and an increased incidence of diabetes in early adulthood (5). Insulin secretion in response to a glucose load in 30-year olds has been reported to be inversely associated with gestational age across late preterm and early term gestations (4). For insulin resistance to progress to type 2 diabetes, the compensatory increased insulin secretion by the pancreas must fail (39). Our data indicate that preterm birth leads to decreased β-cell mass by early adulthood. If the same is true in human infants born preterm, this would increase the risk of later type 2 diabetes by decreasing pancreatic β-cell reserve and, presumably, the ability of the pancreas to compensate for decreased peripheral SI.
Lambs born preterm had reduced β-cell mass, altered insulin secretion, and altered pancreatic mRNA expression compared with lambs born at term. Because all of the preterm lambs, and none of the term lambs, were exposed to antenatal glucocorticoids, it is unknown whether these changes were due to the effect of preterm birth itself, or the effect of antenatal glucocorticoid exposure. Of note, preterm lambs had lower blood glucose and insulin concentrations on the day of birth than term lambs, consistent with decreased energy stores and indicating that antenatal glucocorticoids did not result in perinatal hyperglycemia. Whether there are other effects of antenatal glucocorticoids on the pancreas is not known. In response to hyperglycemia, preterm lambs increased plasma insulin concentrations to levels similar to those in TermC.
Maternal exogenous glucocorticoid treatment has been associated with reduced plasma igf1 concentrations in sheep fetuses and offspring (40). In contrast, we found increased pancreatic igf1 expression levels in juvenile lambs, suggesting that the effects on the pancreas are not due to antenatal glucocorticoid exposure. Glucocorticoids regulate normal fetal pancreatic development in mice (41) and rats (42). Overexposure of the fetal pancreas to glucocorticoids reduces fetal β-cell mass in rodents (43) and reduces insulin secretion in later life in male sheep (44). A single dose of antenatal glucocorticoid has been shown to increase the plasma insulin and blood glucose response to a glucose challenge in sheep at 6 months and 1 year of age, without changing fetal growth (45). Offspring of mothers treated with antenatal glucocorticoids had a greater plasma insulin response and a lower plasma glucose response to a glucose challenge 30 years after birth compared with mothers treated with placebo (46). However, although antenatal glucocorticoids may alter the insulin-glucose axis, they also reduce mortality and significant morbidity not only in preterm babies (47), but also in preterm lambs (48), and it was necessary to use antenatal glucocorticoids to improve survival of the preterm lambs.
Furthermore, lambs in this study had preterm birth induced through exogenous glucocorticoid exposure, rather than exogenous glucocorticoids being administered because the mother is at risk of preterm birth due to other pathology. Although in all species studied to date birth is preceded by a fetal glucocorticoid surge (49), in the sheep, this glucocorticoid surge is an essential part of the onset of labor (50). In the clinical setting, preterm birth is a syndrome with multiple pathologies (eg, sepsis, placental vascular disease, congenital anomaly, and multiple pregnancy) leading to early delivery. Experimental studies cannot replicate this and are, therefore, not directly analogous to the clinical situation. On the other hand, experimental studies can control for variables and, in this study, we have shown that preterm birth induced by exogenous glucocorticoids in sheep leads to reduced adult β-cell mass.
Treatment of pregnant women at risk of preterm birth with antenatal glucocorticoids is now established clinical practice and most babies born preterm will have been exposed to glucocorticoids whereas term-born babies will not. Further research now is needed to determine whether indeed it is preterm birth itself or exposure to antenatal glucocorticoids that results in reduced β-cell mass so that appropriate strategies to protect the pancreas before, during, and after preterm birth can be investigated.
In addition to the effects of preterm birth, hyperglycemia, a common complication of extreme preterm birth, increased β-cell apoptosis and further exacerbated some of the effects of preterm birth on pancreatic mRNA expression. If the same is true in humans, then babies born extremely preterm who experience neonatal hyperglycemia may be at greater risk of type 2 diabetes in later life. Insulin treatment of the hyperglycemia reversed only some of the effects of hyperglycemia on β-cell mass, β-cell turnover and pancreatic mRNA expression and did not prevent reduced β-cell mass in adulthood, despite reducing β-cell apoptosis. Short-term insulin treatment previously has been shown to increase β-cell mass in newborn rats (51) and, clinically, insulin treatment improves β-cell function in newly diagnosed with type 2 persons with diabetes (52), possibly by reducing glucolipotoxicity (53). However, insulin treatment of hyperglycemia in the neonatal period in lambs (17) and extremely preterm babies increases the risk of hypoglycemia (24, 54), which has the potential to impair subsequent neurodevelopment (55). Although clinical studies are required both to investigate safer insulin administration techniques in preterm babies, and to determine the effect of insulin on neurodevelopment, studies also are needed to understand the effect of insulin treatment in preterm babies on β-cell function in later life. Alternative approaches to the management of hyperglycemia in preterm babies should also be investigated, such as increasing endogenous insulin production either through nutritional approaches (eg, increased amino acid intake) or through incretin-stimulated insulin production.
Incretins, which include the hormones glucose-dependent insulinotropic polypeptide and GLP1, have been shown to play an important role in stimulating postprandial insulin secretion (56, 57), and to increase β-cell proliferation (34) and decrease β-cell apoptosis (35) in the INS-1 β-cell line. Exendin 4, a GLP1 analog, when injected sc daily for 6 days starting on the day of birth to rat pups with intrauterine growth restriction induced through uteroplacental insufficiency, modifies changes in β-cell mass by normalizing pdx1 gene expression and increasing β-cell proliferation rate (58). These effects were sufficient to prevent the onset of diabetes that occurred in the vehicle-treated rat pups. GLP1 also has been reported to be produced by pancreatic α-cells in vitro and in vivo (36), suggesting a possible paracrine action of GLP1 on pancreatic β-cells (36). We did not find a difference in pancreatic GLP1 concentration, but were not able to measure gut release of GLP1 due to its very short half-life.
The effects of preterm birth and neonatal hyperglycemia on mRNA expression of key pancreatic genes and insulin secretion that were present after weaning had disappeared or even reversed by young adulthood. This pattern of pancreatic gene expression may underlie the switch from an initial increase in insulin secretion to a decrease over time that has been reported previously in growth restricted lambs (59), in hyperglycemic rat pups (19, 60), and in the human offspring of diabetic pregnancies (21, 61, 62). Studies in growth-restricted rats have demonstrated that changes in the epigenetic regulation of pdx1 gene expression are associated with later diabetes (63). We did not find long-term change in pdx1 gene expression but did see a significant down-regulation of glucokinase in early adulthood, consistent with a trend towards decreased enzyme activity using a novel mass spectrometric assay. Glucokinase is the putative glucose sensor of the β-cell and mutations in the glucokinase gene lead to impaired insulin secretion in maturity onset diabetes of the young (64). We recognize the fact that pdx1 mRNA levels were variable and that we have used whole pancreata and not isolated islets; however, fold changes in mRNA expression data were calculated at 99% CIs, which minimize the possibility of making a type 1 error. Nevertheless, it is possible that we have underestimated the magnitude of any β-cell-specific changes in mRNA levels as most of the genes investigated are islet-specific. Pancreatic integrity needed to be preserved to enable quantification of β-cell mass; the cost of sheep studies precluded the generation of 2 cohorts, 1 for quantification of β-cell mass and 1 for islet isolation. We considered that use of the ovine paradigm was very important for the following reasons: first, the timing of development of the pancreas is similar to the human (65–70), whereas in the rodent, several aspects take place during postnatal rather than in fetal life; secondly, it is recognized that development of the glucose-insulin axis is affected by multiple pregnancy (71, 72) necessitating study of a monotocous species, and, thirdly, we required animals that could be delivered significantly preterm, treated with iv infusions and then survive into adulthood.
We have shown that preterm birth was associated with postweaning insulin sensitivity, in contrast to the reduced SI observed in children born preterm (2). By young adulthood SI in lambs born preterm was similar to that in lambs born at term. Insulin resistance after preterm birth in humans has been described in young adulthood (4, 37, 73), but this finding is not universal (74). This discrepancy may be due to species related differences in pancreatic function, whole-body SI, and postnatal growth patterns.
There are limitations to this study, not least the differences between preterm sheep and preterm babies. Preterm lambs were able to demand feed from the ewe, although the amount of enteral feeding may have been influenced by factors such as infection and iv fluid intake. Preterm babies are dependent on nutritional supply from their carers, and are not able to demand feed early in life. Increased nutritional intake early in life may influence early growth velocity (75), epigenetic regulation of the pancreas (76) and later insulin resistance (77). When comparing outcomes after birth at preterm gestations with those after birth at term, the dilemma is whether to compare offspring at similar postnatal ages, ignoring the effect of differing gestation length and, therefore, differing postconceptional age, or to compare at similar postconceptional age but ignoring the effect of different postnatal age. In the clinical setting, the convention is to correct for gestation length and compare at similar postconceptional ages until the age of 2 years, with no correction for prematurity thereafter. We have taken a similar approach, assessing β-cell mass at 4 weeks corrected after term, but at 12 months chronological age, as sheep mature more rapidly than humans and 12 months is already young adulthood. The fact that the pattern of changes in β-cell mass was the same at both ages suggests that the effects are not due to differences in postnatal or postconceptional age but are secondary to the preterm birth.
These studies demonstrate that preterm birth in sheep results in a dramatic reduction in adult β-cell mass, and that hyperglycemia, a common complication of significantly preterm birth, also causes long-term changes in the glucose-insulin axis. These data, therefore, provide a possible mechanistic basis for the growing evidence from clinical studies that preterm birth may be associated with long-term changes in the glucose-insulin axis (1, 2, 4).
Acknowledgments
We thank Dr Anne Jaquiery, Pauline Alsweiler, Samantha Rossenrode, and Toni Mitchell for their assistance caring for the sheep and Satya Amirapu, Hui Hui Phua, and Chris Keven for their assistance with the laboratory work.
Present address for A.B.: Center for Research on Reproduction and Women's Health, Perelman School of Medicine, University of Pennsylvania, Philadelphia, PA 19104.
Present address for K.L.C.: Lunenfeld Tanenbaum Research Institute, Mount Sinai Hospital, Toronto, ON, Canada M5G 1X5.
Present address for D.M.S.: Biochemistry and Biomedical Sciences, Faculty of Health Sciences, McMaster University, Hamilton, ON, Canada L8N 3Z5.
This work was supported by grants from the Health Research Council of New Zealand, Auckland Medical Research Foundation, Gravida: National Centre for Growth and Development, Lottery Health, University of Auckland Doctoral Scholarship, and the Royal Australasian College of Physicians.
Disclosure Summary: The authors have nothing to disclose.
For News & Views see page 3494
Abbreviations
- AUC
area under the curve
- BGC
blood glucose concentration
- BrdU
bromodeoxyuridine
- CI
confidence interval
- CV
coefficient of variation
- DAPI
4′,6-diamidino-2-phenylindole
- ELBW
extremely low birth weight
- F
female
- FOV
field of view
- GLP
glucagon-like peptide
- HGC
hyperglycemic clamp
- HYPER
hyperglycemic
- INS
insulin treated
- ivGTT
iv glucose tolerance test
- M
male
- NEC
necrotizing enterocolitis
- PremC
preterm control
- SI
insulin sensitivity
- SIR
steady-state insulin secretion
- TermC
term control
- UPLC
ultra performance liquid chromatography.
References
Author notes
A.B. and F.H.B. contributed equally to this work.
