


Abstract
Population studies reporting contemporary long-term outcomes following catheter ablation of atrial fibrillation (AF) are sparse.
We evaluated long-term clinical outcomes following AF ablation and examined variation in outcomes by age, sex, and the presence of heart failure.
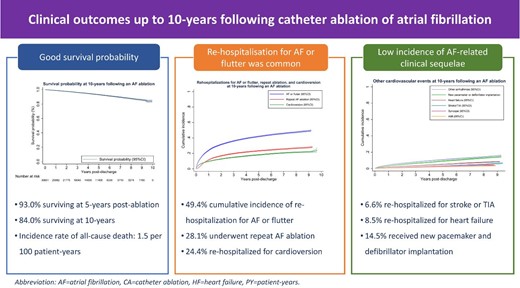
We identified 30 601 unique patients (mean age 62.7 ± 11.8 years, 30.0% female) undergoing AF ablation from 2008 to 2017 in Australia and New Zealand using nationwide hospitalization data. The primary outcomes were all-cause mortality and rehospitalizations for AF or flutter, repeat AF ablation, and cardioversion. Secondary outcomes were rehospitalizations for other cardiovascular events. During 124 858.7 person-years of follow-up, 1900 patients died (incidence rate 1.5/100 person-years) with a survival probability of 93.0% (95% confidence interval (CI) 92.6–93.4%) by 5 years and 84.0% (95% CI 82.4–85.5%) by 10 years. Rehospitalizations for AF or flutter (13.3/100 person-years), repeat ablation (5.9/100 person-years), and cardioversion (4.5/100 person-years) were common, with respective cumulative incidence of 49.4% (95% CI 48.4–50.4%), 28.1% (95% CI 27.2–29.0%), and 24.4% (95% CI 21.5–27.5%) at 10 years post-ablation. Rehospitalizations for stroke (0.7/100 person-years), heart failure (1.1/100 person-years), acute myocardial infarction (0.4/100 person-years), syncope (0.6/100 person-years), other arrhythmias (2.5/100 person-years), and new cardiac device implantation (2.0/100 person-years) occurred less frequently. Elderly patients and those with comorbid heart failure had worse survival but were less likely to undergo repeat ablation, while long-term outcomes were comparable between the sexes.
Patients undergoing AF ablations had good long-term survival, a low incidence of rehospitalizations for stroke or heart failure, and about half remained free of rehospitalizations for AF or flutter, including for repeat AF ablation, or cardioversion.
Introduction
Nearly one in four men and one in five women after the age of 40 will have atrial fibrillation (AF), the most common sustained heart rhythm disorder.1,2 Besides the high prevalence, AF is associated with a higher risk of adverse outcomes, including death, stroke, heart failure, and acute myocardial infarction.3 While medical therapy has low efficacy in restoring normal sinus rhythm,4 catheter ablation is a more effective option to terminate AF and improve symptoms.5,6 Moreover, AF patients with comorbid heart failure who undergo ablation experience a survival benefit in addition to symptoms relief when compared with medical therapy.7
Although the benefits of catheter ablation in maintaining sinus rhythm have been well established in clinical trials, long-term clinical sequelae of patients undergoing AF ablation in actual clinical practice are less well known. Published studies mostly report arrhythmia-free survival rate and are often derived from selected populations and experienced ablation centres,6,8,9 making their results less representative of outcomes in mainstream clinical practice. Furthermore, while the frequently used definition of arrhythmia occurrence (AF lasting >30 s)10 is useful in clinical trial settings, less is known about the incidence of clinically meaningful episodes such as those warranting hospitalization or requiring repeat ablation or cardioversion. Moreover, data are lacking about the risk of other equally important cardiovascular outcomes such as mortality, stroke, and heart failure, which is crucial for patients and clinicians seeking to better understand long-term outcomes of AF ablation. Population studies can provide unbiased estimates of these long-term outcomes, yet existing literature is sparse and limited by short follow-up time (up to 1 year)11–13 or a focus on specific populations.14–16
Accordingly, we used population-wide data to examine long-term outcomes of patients undergoing AF ablation in Australia and New Zealand (ANZ) from 2008 to 2017. Specifically, we evaluated the longitudinal risk of all-cause mortality, rehospitalizations for AF or flutter, repeat AF ablation, cardioversion, and other cardiovascular events, including hospitalizations for stroke or transient ischaemic attack (TIA) and heart failure. We also examined how the primary outcomes varied by age, sex, and the presence of comorbid heart failure as this subgroup of AF patients has been shown to experience survival benefits with catheter ablation compared with medical therapy.7
Methods
Data source
We used hospitalization data from all public and most (80%) private hospitals recorded in the Admitted Patient Collection (APC) from each state and territory in Australia and the equivalent New Zealand National Minimum Dataset (Hospital Events). Data were missing from private hospitals in New Zealand and the Australian states of South Australia, Tasmania, and Northern Territory, whose total population accounted for <10% of the total Australian population. A standard set of variables is recorded for each admission (both inpatient and outpatient visits), including patient demographic characteristics, the primary diagnosis and up to 50 secondary diagnoses, all procedures performed, and the patient's status at discharge. In both countries, diagnoses are coded using the International Classification of Diseases, 10th Revision, Australian Modification (ICD-10-AM), and procedures were coded using the Australian Classification of Health Interventions (ACHI). Accuracy of diagnosis and procedure coding is reported to exceed 85% when compared with medical records.17,18
In Australia, each encounter was linked with subsequent records within the APC and to each region's Birth, Death, and Marriages Registry by using probabilistic matching using multiple patient identifiers with reported accuracy exceeding 99%.19 In New Zealand, all patient records are linked nationally using a unique National Health Index number, and all deaths are recorded in the National Health Index Sociodemographic Profile. These linkages allowed the capture of rehospitalizations to any hospital within each region and all deaths occurring in hospital or in the community.
Study cohort
The use of administrative data to identify patients undergoing AF ablations has been described previously.20,21 In brief, we included patients aged ≥18 years hospitalized with a primary diagnosis of AF and a procedure code for catheter ablation from 2008 to 2017 and excluded those who (1) had secondary diagnoses of other arrhythmias to ensure that the ablation was solely for AF; (2) had a previous or current cardiac device implantation; (3) had open (surgical) ablation; and (4) were discharged against medical advice (see the supplementary material online, Table S1 for all ICD-10-AM and ACHI codes used to identify the study cohort). The identification of AF ablation in administrative data has been validated to be highly accurate (100% specificity and 87.3% sensitivity).22 For patients with multiple admissions during the study period, the first episode was considered the index hospitalization, with all subsequent events considered an outcome (rehospitalization for AF).
Study outcomes
The primary outcomes were (1) all-cause mortality and (2) rehospitalizations for atrial arrhythmias (AF or flutter), repeat AF ablation, and cardioversion. Secondary outcomes included relevant cardiovascular events, including hospitalizations for stroke or TIA, heart failure, acute myocardial infarction, syncope, arrhythmias other than AF or flutter (bradycardia and tachycardia, all types of heart block), and new cardiac device (pacemaker or defibrillator) implantation (see the Supplementary material online, Table S1 for more details).
Statistical analysis
We presented data as frequencies and percentages for categorical variables and mean ± standard deviation (SD) or median and interquartile range (IQR) for continuous variables. Differences between groups were evaluated using χ2 or Fisher's exact test for categorical variables and Student’s t-test or Mann–Whitney U test for continuous variables where appropriate. For patients who were rehospitalized multiple times, only the first episode was counted. Comorbidities were derived using the Condition Categories system, that groups selected secondary diagnoses from the index hospitalization and all diagnoses (both primary and secondary) from hospitalizations in the previous 12 months into 180 meaningful clinical conditions.23
To estimate the incidence rate, which reflects the number of new events that occurred in a given period, we divided the number of events by the patient time at risk and reported results as the number of events per 100 person-years (PY). Patients were considered at risk until they died, experienced a non-fatal outcome, or survived until the end of the study period (1 January 2018). We used the Kaplan–Meier method to estimate the survival probability and reported results as percentages with the respective 95% confidence interval (CI). For non-fatal outcomes, we estimated the cumulative incidence, which reflects the proportion of patients experiencing the event over a given period by using Fine and Gray's method of competing risk survival analysis (subdistribution hazard) with death being the competing event.24
To examine variation in outcomes by age, sex, and comorbid heart failure, we used Cox regression survival analysis to adjust for baseline differences in patient and procedural characteristics. Simple Cox regression analysis was used with the outcome of death, while for non-fatal outcomes, separate competing risk models using Fine and Gray's method were developed with death being the competing event.25 Results are reported as hazard ratio (HR) for mortality or subdistribution HR (sHR) for non-fatal outcomes with the corresponding 95% CI. Candidate variables considered for these models included patient demographic characteristics (age, sex, and presenting region), procedural characteristics (elective admission, ablation of both atria, and ablation in a private hospital), and various cardiovascular and non-cardiovascular comorbidities that may be associated with long-term outcomes.
All analyses were performed using Stata version 16.0 ( StataCorp LLC, College Station, TX) and a two-tailed P-value < 0.05 was considered statistically significant. This study was approved by the respective Human Research Ethics Committees of each state and territory in Australia. Data from New Zealand were obtained under a data user agreement with the New Zealand Ministry of Health. A waiver of informed consent was provided for the use of deidentified data.
Results
From 2008 to 2017, 45 398 patients were hospitalized with a primary diagnosis of AF and a procedure code for catheter ablation, of whom 30 601 unique patients met selection criteria and were included in the final study cohort (Figure 1).
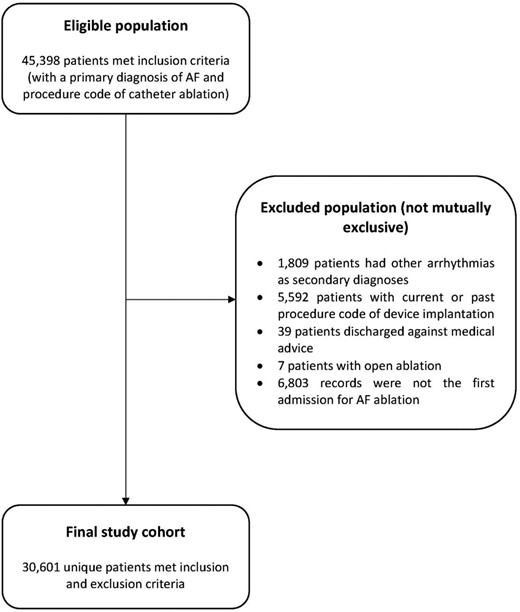
Patient selection flow diagram. AF, atrial fibrillation.
Cohort characteristics
The mean age was 62.7 (±11.8) years with 46.1% aged ≥65 years and the cohort was predominantly (70.0%) male (Table 1). The median length of stay was 1.0 day (IQR 1.0–2.0 days) and 94.0% of AF ablations were performed during an elective (planned) hospitalization. Nearly half of the study cohort (49.1%) had been hospitalized with a primary diagnosis of AF or flutter in the previous year, but rates of comorbidities were generally low, with hypertension (13.4%) and diabetes (10.1%) being the most common cardiac and non-cardiac comorbidities, respectively. The median estimated CHA2DS2-VASc score (thromboembolic risk score for AF patients in which a point each is given for the presence of congestive heart failure [C], hypertension [H], age 65-74 years old [A], diabetes [D], vascular disease (VASc) and female sex and 2 points each are given for age ≥75 years old and history of stroke [S]) was 1 (IQR 0–2) with 90.1% with a score ≤2.
Baseline characteristics of the study cohort
| All-cause mortality | Rehospitalizations for AF or flutter | ||||||
|---|---|---|---|---|---|---|---|
| Variables | Overall (N = 30 601) n (%) | Survived (N = 28 701) n (%) | Died (N = 1900) n (%) | P value | Not rehospitalized (N = 19 479) n (%) | Rehospitalized (N = 11 114) n (%) | P- value |
| Demographic characteristics | |||||||
| Age (mean ± SD) | 62.7 ± 11.8 | 62.0 ± 11.5 | 72.4 ± 10.8 | <0.001 | 63.3 ± 12.1 | 61.5 ± 11.0 | <0.001 |
| Age group | |||||||
| 18–34 | 642 (2.1) | 631 (2.2) | 11 (0.6) | <0.001 | 427 (2.2) | 215 (1.9) | <0.001 |
| 35–49 | 3316 (10.8) | 3261 (11.4) | 55 (2.9) | — | 1993 (10.2) | 1323 (11.9) | — |
| 50–64 | 12 540 (41.0) | 12 203 (42.5) | 337 (17.7) | — | 7536 (38.7) | 5002 (45.0) | — |
| 65–79 | 12 270 (40.1) | 11 278 (39.3) | 992 (52.2) | — | 8053 (41.3) | 4212 (37.9) | — |
| ≥80 | 1833 (6.0) | 1328 (4.6) | 505 (26.6) | — | 1470 (7.6) | 362 (3.3) | — |
| Female (%) | 9180 (30.0) | 8588 (29.9) | 592 (31.2) | 0.255 | 5825 (29.9) | 3351 (30.2) | 0.650 |
| Median length of stay (IQR) | 1.0 (1.0–2.0) | 1.0 (1.0–2.0) | 1.0 (1.0–3.0) | <0.001 | 1.0 (1.0–2.0) | 1.0 (1.0–2.0) | <0.001 |
| Presenting region | |||||||
| NZ | 2572 (8.4) | 2439 (8.5) | 133 (7.0) | <0.001 | 1700 (8.7) | 871 (7.8) | <0.001 |
| ACT/NSW | 8203 (26.8) | 7672 (26.7) | 531 (28.0) | — | 5226 (26.8) | 2974 (26.8) | — |
| SA/NT | 2130 (7.0) | 1932 (6.7) | 198 (10.4) | — | 1388 (7.1) | 741 (6.7) | — |
| QLD | 6152 (20.1) | 5765 (20.1) | 387 (20.4) | — | 3687 (18.9) | 2465 (22.2) | — |
| TAS | 0 (0.0) | 0 (0.0) | 0 (0.0) | — | 0 (0.0) | 0 (0.0) | — |
| VIC | 7433 (24.3) | 7035 (24.5) | 398 (21.0) | — | 5121 (26.3) | 2309 (20.8) | — |
| WA | 4111 (13.4) | 3858 (13.4) | 253 (13.3) | — | 2357 (12.1) | 1754 (15.8) | — |
| Elective (scheduled) procedure | 28 755 (94.0) | 27 089 (94.4) | 1666 (87.7) | <0.001 | 18 270 (93.8) | 10 478 (94.3) | 0.087 |
| Private hospital | 19 272 (63.0) | 18 208 (63.4) | 1064 (56.0) | <0.001 | 12 158 (62.4) | 7111 (64.0) | 0.006 |
| CHA2DS2-VASc scorea (median, IQR) | 1 (0-2) | 1 (0-1) | 2 (1-3) | <0.001 | 1 (0-2) | 1 (0-1) | <0.001 |
| 0 (n, %) | 13 012 (42.5) | 12 818 (44.7) | 194 (10.2) | <0.001 | 7916 (40.6) | 5095 (45.8) | <0.001 |
| 1 (n, %) | 9236 (30.2) | 8807 (30.7) | 429 (22.6) | — | 5803 (29.8) | 3430 (30.9) | — |
| ≥2 (n, %) | 8353 (27.3) | 7076 (24.7) | 1277 (67.2) | — | 5760 (29.6) | 2589 (23.3) | — |
| Cardiac history | |||||||
| Hypertension | 4098 (13.4) | 3518 (12.3) | 580 (30.5) | <0.001 | 2520 (12.9) | 1575 (14.2) | 0.002 |
| Heart failure | 3123 (10.2) | 2574 (9.0) | 549 (28.9) | <0.001 | 2046 (10.5) | 1073 (9.7) | 0.018 |
| Valvular and rheumatic heart disease | 1319 (4.3) | 1149 (4.0) | 170 (9.0) | <0.001 | 784 (4.0) | 535 (4.8) | 0.001 |
| Coronary artery disease | 3294 (10.8) | 2858 (10.0) | 436 (23.0) | <0.001 | 2136 (11.0) | 1155 (10.4) | 0.120 |
| Vascular disease | 514 (1.7) | 426 (1.5) | 88 (4.6) | <0.001 | 353 (1.8) | 161 (1.5) | 0.017 |
| History of hospitalization for AF or flutter | 15 035 (49.1) | 14 117 (49.9) | 918 (48.3) | 0.462 | 8861 (45.5) | 6171 (55.5) | <0.001 |
| Non-cardiac comorbidities | |||||||
| Diabetes mellitus | 3101 (10.1) | 2780 (9.7) | 321 (16.9) | <0.001 | 2221 (11.4) | 879 (7.9) | <0.001 |
| Chronic lung diseases | 1365 (4.5) | 1060 (3.7) | 305 (16.1) | <0.001 | 924 (4.7) | 439 (4.0) | 0.001 |
| Chronic kidney disease | 1072 (3.5) | 811 (2.8) | 261 (13.7) | <0.001 | 790 (4.1) | 281 (2.5) | <0.001 |
| Stroke or TIA | 425 (1.4) | 374 (1.3) | 51 (2.7) | <0.001 | 261 (1.3) | 164 (1.5) | 0.329 |
| Haematological disorders | 1369 (4.5) | 1086 (3.8) | 283 (14.9) | <0.001 | 863 (4.4) | 505 (4.5) | 0.644 |
| Pneumonia | 667 (2.2) | 511 (1.8) | 156 (8.2) | <0.001 | 477 (2.5) | 188 (1.7) | <0.001 |
| Musculoskeletal and connective tissue disorders | 2214 (7.2) | 1981 (6.9) | 233 (12.3) | <0.001 | 1379 (7.1) | 833 (7.5) | 0.177 |
| Dementia and senility | 55 (0.2) | 41 (0.1) | 14 (0.7) | <0.001 | 44 (0.2) | 11 (0.1) | 0.012 |
| Major cancer | 229 (0.8) | 148 (0.5) | 81 (4.3) | <0.001 | 182 (0.9) | 47 (0.4) | <0.001 |
| End-stage liver disease | 39 (0.1) | 30 (0.1) | 9 (0.5) | 0.001 | 27 (0.1) | 12 (0.1) | 0.470 |
| Drug or alcohol abuse, psychosis, or dependence | 458 (1.5) | 383 (1.3) | 75 (4.0) | <0.001 | 304 (1.6) | 153 (1.4) | 0.202 |
| Psychiatric disorders | 447 (1.5) | 376 (1.3) | 71 (3.7) | <0.001 | 291 (1.5) | 156 (1.4) | 0.527 |
| Neurological disorders and paralysis | 326 (1.1) | 275 (1.0) | 51 (2.7) | <0.001 | 211 (1.1) | 115 (1.0) | 0.691 |
| Skin ulcers | 99 (0.3) | 55 (0.2) | 44 (2.3) | <0.001 | 79 (0.4) | 20 (0.2) | 0.001 |
| Urinary tract disorders and incontinence | 1283 (4.2) | 1081 (3.8) | 202 (10.6) | <0.001 | 874 (4.5) | 408 (3.7) | 0.001 |
Major cancer includes metastatic cancer and acute leukaemia; lung, upper digestive tract, and other severe cancers; and lymphatic, head and neck, brain, and other major cancers. Drug-related disorders include drug or alcohol psychosis, drug or alcohol abuse with or without dependence.SD, standard deviation; IQR, interquartile range; NZ, New Zealand; ACT, Australian Capital Territory; NSW, New South Wales; SA, South Australia; NT, Northern Territory; QLD, Queensland; TAS, Tasmania; VIC, Victoria; WA, Western Australia; and TIA, transient ischaemic attack; aCHA2DS2-VASc score is a score used to evaluate risk of experiencing thromboembolic events of AF patients in which a point each is given for the presence of congestive heart failure (C), hypertension (H), age 6574 years old (A), diabetes (D), vascular disease (VASc) and female sex and two points each are given for age> = 75 years old and history of stroke (S). The total score ranges from 0 to 9 with the higher the score, the higher the risk.33
During 124 858.7 person-years of follow-up (median follow-up time of 3.8 years, IQR: 1.7–6.2 years), 1900 patients died. Compared with those who survived, deceased patients were older (72.4 vs. 62.0 years), less likely to have an elective index hospitalization (87.7% vs. 94.4%), and had a higher frequency of comorbidities such as hypertension (30.5% vs. 12.3%), heart failure (28.9% vs. 9.0%), coronary artery disease (23.0% vs. 10.0%), diabetes (16.9% vs. 9.7%), and a higher CHA2DS2-VASc score (median score of 2 vs. 1) (all P-values < 0.001).
A total of 30 593 patients survived the index hospitalizations, among whom 11 114 were rehospitalized for AF or flutter during follow-up. Rehospitalized patients were younger (61.5 vs. 63.3 years), had higher rate of hypertension (14.2% vs. 12.9%), and were more likely to be hospitalized for AF or flutter in the previous year (55.5% vs. 45.5%) compared with those not rehospitalized.
Long-term clinical outcomes following atrial fibrillation ablation
All-cause mortality
The overall incidence rate of all-cause death was 1.5/100 PY (Table 2 and Figure 2), which increased from 1.2/100 PY in the first year to 1.5/100 PY in 1–5 years and reached 2.0/100 PY at 5–10 years after the index ablation. This corresponded to a survival probability of 98.8% (95% CI 98.6–98.9%) at 1 year, 93.0% (95% CI 92.6–93.4%) at 5 years, and 84.0% (95% CI 82.4–85.5%) at 10-year, respectively.
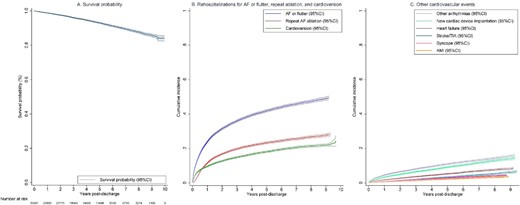
Long-term outcomes following catheter ablation of atrial fibrillation. (A) Survival probability following catheter ablation of atrial fibrillation. (B) Cumulative incidence of rehospitalizations for AF or flutter, and related procedures (repeat AF ablation and cardioversion). (C) Cumulative incidence of rehospitalizations for other cardiovascular events. AF, atrial fibrillation; AFL, atrial flutter; AMI, acute myocardial infarction; CI, confidence interval; and TIA, transient ischaemic attack.
Long-term outcomes of patients undergoing catheter ablation of atrial fibrillation
| Outcomes | Total number of patients N (incidence rate) | 1-year incidence rate N (incidence rate) | 1–5 years incidence rate N (incidence rate) | 5–10 years incidence rate N (incidence rate) | Cumulative incidence (95% CI) |
|---|---|---|---|---|---|
| Death | 1900 (1.5) | 348 (1.2) | 1069 (1.5) | 483 (2.0) | 16.0% (14.5%–17.6%) |
| Rehospitalizations for AF or flutter | 11 114 (13.3) | 6923 (29.0) | 3706 (7.8) | 485 (3.9) | 49.4% (48.4%–50.4%) |
| Acute AF/AFL rehospitalizations | 5148 (4.8) | 2760 (10.5) | 2029 (3.3) | 359 (2.0) | 24.8% (24.0%–25.7%) |
| Repeat AF ablation or cardioversion | |||||
| Repeat AF ablation | 6001 (5.9) | 3251 (12.2) | 2458 (4.2) | 292 (1.7) | 28.1% (27.2%–29.0%) |
| Cardioversion of AF/AFL | 4811 (4.5) | 2792 (10.6) | 1725 (2.8) | 294 (1.6) | 24.4% (21.5%–27.5%) |
| Rehospitalizations for other cardiovascular events | |||||
| Stroke/TIA | 883 (0.7) | 212 (0.8) | 495 (0.7) | 176 (0.8) | 6.6% (5.8%–7.5%) |
| Heart failure | 1385 (1.1) | 505 (1.8) | 674 (0.9) | 206 (0.9) | 8.5% (7.9%–9.2%) |
| Acute myocardial infarction | 549 (0.4) | 142 (0.5) | 305 (0.4) | 102 (0.4) | 3.7% (3.3%–4.2%) |
| Syncope | 716 (0.6) | 209 (0.7) | 400 (0.6) | 107 (0.5) | 4.3% (4.0%–4.7%) |
| Other arrhythmias (tachycardia and bradycardia, heart block) | 2858 (2.5) | 1304 (4.8) | 1246 (1.8) | 308 (1.5) | 15.9% (15.0%–16.7%) |
| New pacemaker or defibrillator implantation | 2393 (2.0) | 951 (3.4) | 1111 (1.6) | 331 (1.6) | 14.5% (13.6%–15.3%) |
AF, atrial fibrillation; AFL, atrial flutter; TIA, transient ischaemic attack; SVT, supraventricular tachycardia; and VT, ventricular tachycardia.
Rehospitalization for atrial fibrillation or flutter
A total of 11 114 patients experienced at least one acute (unplanned) or elective (planned) rehospitalization for AF or flutter (incidence rate 13.3/100 PY). The incidence rate peaked during the first year (29.0/100 PY) and rapidly declined to 7.8/100 PY and 3.9/100 PY at 1–5 years and 5–10 years post-ablation, respectively. The cumulative incidence of rehospitalizations for atrial arrhythmias was 23.8% (95% CI 23.4–24.3%) at 1-year, and 49.4% (95% CI 48.4–50.4%) at 10 years. Of these 11 114 patients, 5148 (46.3%) had an acute (unplanned) admission for AF or flutter with an overall incidence rate of 4.8/100 PY and a cumulative incidence of 24.8% (95% CI 24.0–25.7%).
Repeat atrial fibrillation ablation and cardioversion
Among the 11 114 patients rehospitalized for AF or flutter, a subset of 6001 patients underwent repeat AF ablation (incidence rate 5.9/100 PY) and 4811 patients received cardioversion (incidence rate 4.5/100 PY). The incidence rate for repeat ablation was highest in the first year (12.2/100 PY), and then decreased to 1.7/100 PY in years 5–10 post ablation. The 10-year cumulative incidence was 28.1%, (95% CI 27.2–29.0%). Similarly, there was a rapid decline in the incidence rate of cardioversion for AF or flutter from 10.6/100 PY in the first year to 1.6/100 PY in years 5–10 post-ablation with an overall cumulative incidence of 24.4% (95% CI 21.5–27.5%).
Rehospitalizations for other cardiovascular events
Overall, the incidence rates of other cardiovascular events were low. Specifically, rehospitalizations for stroke or TIA occurred at an incidence rate of 0.7/100 PY with a cumulative incidence of 6.6% (95% CI 5.8–7.5%). Similarly, the incidence rate for heart failure (1.1/100 PY) and acute myocardial infarction (0.4/100 PY) was low with a cumulative incidence of 8.5% (95% CI 7.9–9.2%) and 3.7% (95% CI 3.3–4.2%), respectively. Rehospitalizations for syncope occurred with an incidence rate of 0.6/100 PY with a cumulative incidence of 4.3% (95% CI 4.0–4.7%). The estimates for rehospitalizations for arrythmias other than AF or flutter were 2.5/100 PY and 15.9% (95% CI 15.0–16.7%) respectively. A total of 14.5% (13.6–15.3%) of patients received either a pacemaker or defibrillator (incidence rate of 2.0/100 PY) during the 10-year period. The cumulative incidence was higher among patients with comorbid heart failure (19.8%, 95% CI 17.6–22.0%) compared with those without (13.9%, 95% CI 13.0–14.8%).
Variation in primary outcomes by age, sex, and comorbid heart failure
The unadjusted analysis showed survival probability declined in elderly patients and those with comorbid heart failure but was comparable between sexes (Figure 3A). Long term cumulative incidence of rehospitalizations for AF or flutter was lower among patients ≥80 years but was comparable between subgroups regardless of sex or the presence of heart failure (Figure 3B). Similarly, cumulative incidence of repeat ablation was lowest in the oldest age group and comparable between sex but was lower in patients with comorbid heart failure compared with those without heart failure (Figure 3C).
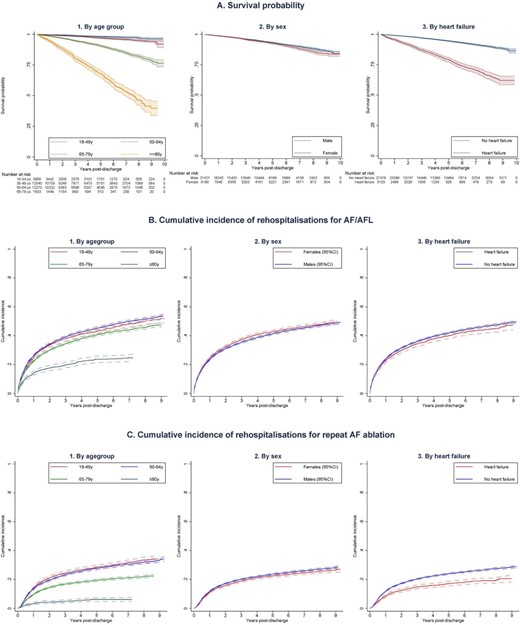
Long-term outcomes following catheter ablation of atrial fibrillation by age, sex, and comorbid heart failure. (A) Long-term survival probability following catheter ablation of atrial fibrillation based on (1) Age group. (2) Sex (3) The presence of comorbid heart failure. (B): Long-term risk of rehospitalizations for recurrent atrial arrhythmias (atrial fibrillation or flutter) following catheter ablation of atrial fibrillation based on (1) Age group, (2) Sex (3) The presence of comorbid heart failure. (C) Long-term risk of repeat AF ablation following catheter ablation of atrial fibrillation based on (1) Age group, (2) Sex, (3) The presence of comorbid heart failure. AF, atrial fibrillation; AFL, atrial flutter; and y, years old.
After adjusting for differences in other patient characteristics, female sex was associated with better survival (HR 0.83, 95% CI 0.75–0.92) while older age (HR for each decade increase in age: 2.40, 95% CI 2.28–2.52) and heart failure (HR 1.90, 95% CI 1.69–2.14) was associated with worse long-term survival (Supplementary material online, Figure S1). After accounting for the competing risk of death, older age was associated with lower adjusted hazard of rehospitalizations for AF or flutter (sHR 0.93, 95% CI 0.91–0.94) but higher hazard of repeat AF ablation (sHR 1.35, 95% CI 1.16–1.57). Female sex was associated with higher hazard of being rehospitalized for AF or flutter (sHR 1.06, 95% CI 1.02–1.11) but hazard of repeat ablation was similar between sex (sHR 0.95, 95% CI 0.69–1.31), while heart failure had no significant relationship with these outcomes (Supplementary material online, Figures S2 and S3).
Discussion
We found that patients undergoing AF ablations in ANZ had a good long-term clinical outcome with a high survival probability and a low incidence of clinical sequelae of AF such as rehospitalizations for stroke or TIA, heart failure, and acute myocardial infarction. Furthermore, about half of the patients did not experience rehospitalization for AF or flutter, including for repeat AF ablation or cardioversion. Collectively, these findings suggest a good prognosis after AF ablation but also suggest the need for additional measures to reduce the burden of AF as nearly 50% of patients required hospitalization for AF or flutter in the 10 years post-ablation.
Population studies play an important role in providing outcome data in clinical practice but existing studies primarily focus on short-term outcomes, typically up to 1 year post-ablation,11–13 while long-term outcome data mostly come from Asian countries14,15 or selected populations such as those who had cardioversion before ablation.16 Our study provided long-term outcomes from an unselected, contemporary cohort in ANZ, irrespective of age or payer. Our population was older than that in Korea and Taiwan (mean age of 51–57 years)14,15 but comparable with Denmark (mean age 65.5 years)16 and North America (60.0–65.3 years).11–13 Despite these differences, the incidence rate of death was consistent among studies (1.1/100 PY)14–16 but nearly double what is reported in large, multicentre clinical trials such as the Catheter Ablation vs. Antiarrhythmic Drug Therapy for Atrial Fibrillation (CABANA) trial (0.63/100 PY).6 Similarly, rates of rehospitalizations for stroke or TIA (0.5–0.7/100 patient-years)14–16 and heart failure (0.7–1.2/100 patient-years)14–16 were consistent among population studies but higher than those reported in the CABANA trial (0.01/100 PY for disabling stroke). Collectively, patients undergoing AF ablation in clinical practice appear to have a relatively low incidence of death and hospitalizations for stroke or heart failure, although the risks are greater than those reported in clinical trials.
We also extend the literature by reporting the longitudinal risk of hospitalization for recurrent AF or flutter and the need for repeat intervention-outcomes of critical importance that are frequently sought by patients and clinicians but rarely reported by other population studies.14–16 Although the definition of AF recurrence as an episode lasting >30 s is commonly used in clinical trials and recommended by management guidelines,10 measuring events that require hospital admission might better reflect the direct burden these patients face. Indeed, Terricabras and colleagues have shown that regardless of AF recurrence status, catheter ablation significantly reduces the AF burden and improves quality of life, suggesting that AF burden might be a more relevant outcome measure for patients undergoing AF ablation.26 Encouragingly, we found that just over 50% of patients were free of hospital admission for AF or flutter at 10 years post-ablation, and the incidence during the first year was only 23.8%, significantly lower than the 49.1% rate in the year preceding the ablation. Given the near 50% incidence of arrhythmia recurrence (defined as AF >30 s)10 at four years post-ablation reported in the CABANA trial,6 our finding (39.4% patients rehospitalized for AF or flutter at 4 years) suggests that 80% of these recurrences are likely severe enough to warrant rehospitalization. We also found that 28.1% of our patients required at least one repeat ablation, which is lower than the cumulative incidence (57.6%) reported in another population study.16 Nevertheless, the incidence rate of repeat AF ablation in our cohort was more than double that of the CABANA trial (5.9 vs. 2.6/100 patient-years),8 suggesting that in clinical practice, patients may require more frequent ablation to achieve outcomes comparable with the trial setting.
Another important observation is a comparable adjusted likelihood of repeat ablation in patients with heart failure despite the higher mortality risk in this subgroup. The literature has consistently shown better outcomes in heart failure patients undergoing AF ablations27 with the Catheter Ablation versus Standard Conventional Therapy in Patients with Left Ventricular Dysfunction and Atrial Fibrillation (CASTLE-AF) trial of AF ablation in those with severe heart failure (ejection fraction ≤35%) reporting a nearly 50% lower hazard of death compared with medical therapy.7 More importantly, this trial had a higher incidence of repeat ablation than that in our study (24.5% at 3.15 years vs. 14.8% at 3 years).7 This raises the possibility that AF ablation may be underutilized in patients with heart failure who might benefit most from the procedure.
Our findings provide important prognostic information for patients and clinicians who seek to be better informed about the long-term clinical outcomes of ablation. These data are reassuring as the incidence rates of untoward outcomes such as death, stroke or TIA, heart failure or acute myocardial infarction after ablation were relatively low. Nevertheless, nearly 50% of patients required hospitalization for AF or flutter and repeat ablation, suggesting that additional measures are required to minimize the AF burden. There are several strategies proven to minimize AF recurrence and improve ablation outcomes such as weight loss,28 reducing alcohol consumption,29 and optimal management of AF risk factors like comorbid hypertension, diabetes, and sleep apnoea.30 Systematic implementation of these strategies may further improve ablation outcomes, decrease the disease burden, and reduce the need of hospital admission or repeat procedures.
Several limitations should be considered when interpreting our results. First, we used routinely collected administrative data that are generally less granular than those collected specifically for research purposes. However, validation studies have shown good accuracy of coded data,17,18 linkages of health records,19 and identification of AF ablation in administrative data.22 Although the algorithm to identify AF ablation in administrative data may not capture all procedures as the sensitivity is not 100%, this approach has 100% specificity and has been widely used by other studies using hospitalization data.31,32 Second, we could not estimate the rate of atrial arrhythmia recurrence (defined as any atrial arrhythmia lasting >30 s10) as not all recurrences required hospital admission. Visits to the emergency department due to AF or flutter or other cardiovascular diseases after ablation that did not lead to hospitalization were also not counted. Instead, we focused on AF or flutter hospitalizations and other events that required hospital admission—events that are most concerning for patients and clinicians and have the greatest impact on health care resources. Third, patients undergoing AF ablation in Australia and New Zealand were relatively young and had low rates of comorbidities and therefore, our results may not reflect the outcomes of AF ablations in older and sicker patients. Fourth, this study did not seek to compare outcomes of patients undergoing ablation with those of patients who did not as many AF patients may present to general practitioners (not recorded in hospitalization data), while all AF ablations are performed in-hospital. Fifth, the inherent differences in study design and patient selection criteria must be considered when comparing our results with those in clinical trials.6,7 Nevertheless, such a comparison was helpful to better understand the outcomes of AF ablation in clinical practice. Finally, several variables that may influence long-term outcomes were not collected in these data sets and were therefore not adjusted for, such as type of AF, type of ablation energy or lesions performed, operator experience, cardiac function, and medications used.
Conclusions
Patients undergoing catheter ablation of atrial fibrillation have a good long-term prognosis with 84.0% surviving by 10 years and relatively low incidence of sequelae such as stroke and heart failure. Furthermore, about half of the patients remained free of rehospitalizations for AF or flutter, repeat ablation, or cardioversion. Nevertheless, additional measures such as weight loss, alcohol abstinence, and better management of comorbidities are necessary to reduce the residual burden of AF post-ablation.
Acknowledgements
The authors wish to thank the following Data-Linkage Units for their assistance and considerable in-kind support;
New South Wales & Australian Capital Territory: Centre for Health Record Linkage; South Australia and Northern Territory: SA-NT DataLink; Queensland: Statistical Services Branch; Queensland Department of Health; Tasmania: Tasmanian Data Linkage Unit; Victoria: Centre for Victorian Data Linkages, Victorian Department of Health; Western Australia: Data Linkage Branch, Western Australian Department of Health, and the involved data collections: Death Registrations and Hospital Morbidity Data Collection; and New Zealand: Ministry of Health.
Funding
National Heart Foundation of Australia (ID 101186).
Disclosures
L.N. was supported by the Hospital Research Foundation Postgraduate Scholarship and a Research Training Program Scholarship from The University of Queensland. I.R. was supported by the National Heart Foundation of Australia Future Leader Fellowships (ID 101 186). R.D. has received speaking honoraria from Medtronic. The remaining authors have no conflict of interest.
Conflict of interest: None beyond the stated disclosures.
Data availability
The data underlying this article were provided by a third party, including the Data Custodian Units of each state and territory in Australia, under ethics approval and the New Zealand Ministry of Health via a data user agreement. The data can be accessed upon request to the third party.
