


Abstract
Over the past decades, there have been improvements in the management of cardiovascular (CV) disease and risk factors. Long-term contemporary data on the population-level incidence of myocardial infarction (MI), heart failure (HF), and CV mortality in patients with peripheral artery disease (PAD) are sparse, which we aim to investigate in this study.
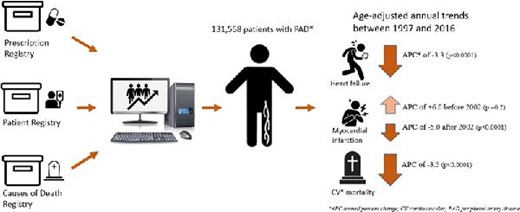
Danish nationwide registers were used to identify all patients aged ≥18 years, with first diagnosis of PAD between 1997 and 2016. Age-standardized incidence rates (IRs) per 1000 person-years were calculated to estimate trends of MI, HF, and CV mortality. The risk of MI, HF, and CV mortality was estimated by 1-year cumulative incidence with death as the competing risk. A total of 131 568 patients with PAD were identified [median age 70.67 (interquartile range, IQR, 61–78) years and 53.05% males]. The IRs showed increasing trends of MI until 2002, with an estimated annual percentage change (APC) of + 0.6 [95% confidence interval (CI) 3.3–16.1, P-value 0.2]. After the year 2002, MI incidence persistently decreased until the study end with an estimated APC of −5.0 (95% CI 3.7–6.3, P < 0.0001), HF declined with an estimated APC of −3.3 (95% CI 2.0–4.6, P < 0.0001); and CV mortality declined, with an APC of −3.5 (95% CI 3.0–4.0, P < 0.0001).
The incidence of MI (since 2002) and HF in patients with PAD has significantly decreased over time, together with a decline in CV mortality. Our results suggest that preventive strategies have overall improved, most likely due to improvements in the application of guidelines in clinical care.
Incidence of Myocardial infarction, Heart failure, and CV mortality in PAD
Introduction
Peripheral artery disease (PAD) is a chronic disease characterized by partial or complete obstruction of one or more of the peripheral arteries.1 Systemic atherosclerosis is considered the dominant cause of PAD and it is well established that PAD is independently associated with increased cardiovascular (CV) morbidity and mortality.2 Indeed, PAD shares common pathogenesis and risk factors with ischaemic heart disease and ∼42% of the patients with ischaemic heart disease have PAD.3,4 Furthermore, studies have reported an increased occurrence of adverse cardiac outcomes in PAD patients with ischaemic heart disease compared with those without it.4 Likewise, patients with PAD also share a variety of risk factors (e.g. atherosclerosis, smoking, hypertension, and diabetes) with heart failure (HF), which is a prevalent clinical syndrome with a high socioeconomic and healthcare burden.5,6 Studies have indicated that HF is prevalent in patients with PAD and is associated with increased morbidity and mortality.6,7 An early diagnosis and timely treatment and management of conventional CV risk factors in patients with PAD may contribute to a reduction in adverse outcomes and improvement in quality of life. Moreover, gaining insight into the PAD population with respect to prevalent CV diseases [e.g. myocardial infarction (MI) and HF] and planning future interventional studies is warranted to reduce healthcare utilization related to increased morbidity and death in these patients. In view of recent years’ advancements in the treatment and management of PAD and the traditional CV risk factors, we expect a decline in PAD-associated morbidity and mortality. The long-term contemporary data on trends in MI and HF incidence in patients with PAD are, however, limited. We, therefore, aim to estimate the age-standardized annual incidence of MI, HF, and CV death in all Danish citizens diagnosed with PAD over a 20-year period (1997–2016).
Methods
Data sources
All Danish citizens are assigned a permanent and unique personal identification number at birth or immigration, which is used to cross-link data across a number of national administrative and healthcare registers.8,9 These nationwide registers offer a unique possibility of conducting large-scale epidemiological studies of several endpoints with a minimum loss to follow-up. In this study, we used the Danish National Patient Registry {holding information on all inpatient and outpatient treatments [captured as International Classification of Diseases (ICD) codes] since 1978} to retrieve information on comorbidities, prior to the PAD diagnosis date.12 The Danish Register of Medicinal Product Statistics (National Prescription Registry) keeps information on all medicine prescribed and dispensed since 1995 according to the International Anatomical Therapeutic Chemical (ATC) classification system and was used to gain data related to pharmacotherapy.8,9 Furthermore, we used the Danish National Cause of Death Registry (established in 1970) to retrieve information on vital status. These Danish registers have previously been shown to be complete and accurate with a number of well-validated diagnoses codes.8–11
Study population
In this study, we included all Danish citizens aged ≥18 years with a first diagnosis of PAD (inpatient and outpatient) over a period of 20 years (1 January 1997 to 31 December 2016). Patients with a history of prevalent PAD, MI, and HF were excluded at baseline. Moreover, the study subjects were censored on death, migration, and the study end (31 December 2016). For the main analyses, we used the in-hospital diagnoses, which are known to have a high accuracy. We used the ‘ESC Guidelines on the Diagnosis and Treatment of Peripheral Arterial Diseases (2017)’ to define our PAD population, comprising all arterial diseases (ICD-10 diagnoses codes: DI70, DI701, DI702, DI708, DI709, DI738, DI739, DI742, DI743, DI744, DI745, DI748, and DI749) excluding the atherosclerotic disease of the coronary arteries, aorta, and intracranial arteries.
Pharmacotherapy and comorbidity
Dispensed prescriptions 180 days prior to the PAD diagnosis date were used to define baseline pharmacotherapy. The pharmacotherapy initiated after the diagnosis of PAD is not reflected in these numbers. Comorbidities were established based on diagnostic codes recorded in the National Patient Registry within 10 years of diagnosis of PAD. Hypertension was identified by hospital diagnoses for hypertension (ICD-10 codes I110–I115) or if the patient was treated with at least two of the following antihypertensive agents within a 90-day period after being diagnosed: alpha-adrenergic blockers, non-loop diuretics, β-blockers, vasodilators, calcium channel blockers, and renin–angiotensin system inhibitors. The respective ICD and ATC codes for all the examined comorbidities and the concomitant pharmacotherapies are presented in the supplementary table.
Outcomes
Incident MI and HF were outcomes of interest and defined by the ICD-10 diagnoses codes, i.e. I21, I42, I50, J81, and I110. CV mortality was defined by the ICD-10 diagnoses codes I00–I99.
Statistical analysis
Age-adjusted trends of PAD were estimated as incidence rates (IRs) per 1000 person-years. Age was categorized in the following age groups (years): 18–49, 50–59, 60–69, and > 70. The 1-year risks of MI, HF, and CV mortality were presented as cumulative incidence curves with death as competing risk with the 95% confidence interval (CI) using the Aalen–Johansen method. Risk-time (used to calculate cumulative incidence) covered the time since the PAD diagnosis date (index) until an outcome of MI, HF, or CV death occurred. Medians, frequencies, and percentages were presented for study subjects at baseline. The χ2-test was used to test the difference between categorical variables and the t-test or the Kruskal–Wallis test for differences between continuous variables. The level of statistical significance was set as P < 0.05. All the statistical analyses were performed with SAS statistical software version 9.4 (SAS Institute Inc., Cary, NC, USA), R statistics (R Core Team, 2016),12 and Joinpoint regression program reference (4.2.0.1 May 2015, National Cancer Institute, https://surveillance.cancer.gov/joinpoint/).
Ethics statement
This study was approved by the Danish Data Protection Agency (ref. 2007–58-0015, int. ref. GEH-2014–018), and data were made available in a way that individuals could not be identified. Approval from an ethics committee is not required for retrospective register-based studies in Denmark.
The study was conducted and reported in agreement with the recommendation of Strengthening the Reporting of Observational Studies in Epidemiology (STROBE).13
Results
A total of 131 568 patients had a first diagnosis of PAD between 1 January 1997 and 31 December 2016. The median age was 70.67 [interquartile range (IQR) 61–78] years, and 53.05% of the identified patients were male. A flowchart of the study population is shown in Figure 1 and baseline characteristics stratified by four year-groups with 5-year intervals among patients with PAD are presented in Table 1.
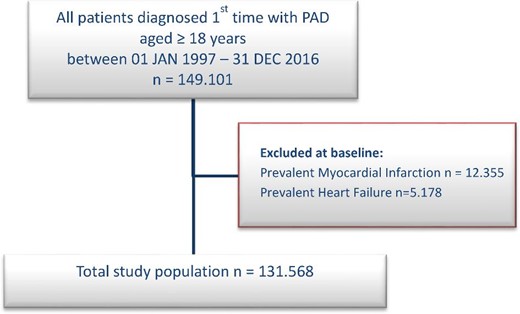
Flowchart of selection of the study population.
Baseline characteristics of the study population
| 1997–2000 | 2001–05 | 2006–10 | 2011–16 | |
|---|---|---|---|---|
| n = 35 078 | n = 33 362 | n = 32 356 | n = 30 772 | |
| Patient characteristics | ||||
| Age, median (IQR) | 70.40–68.84 (61–77) | 70.75–69.52 (61–78) | 70.79–69.93 (62–79) | 70.74–70.10 (62–78) |
| Male (%) | 18,687 (53.27) | 17,249 (51.70) | 16,969 (52.44) | 16,380 (53.23) |
| Comorbidities | ||||
| Ischaemic heart disease (%) | 6,036 (17.21) | 6,257 (18.75) | 5,732 (17.72) | 4,968 (16.14) |
| Chronic kidney disease (%) | 1,416 (4.04) | 1,736 (5.20) | 1,852 (5.72) | 2,140 (6.95) |
| Hypertension (%) | 3,931 (11.21) | 6,890 (20.65) | 9,789 (30.25) | 11,589 (37.66) |
| Pulmonary embolism (%) | 214 (0.61) | 319 (0.96) | 377 (1.17) | 504 (1.64) |
| DVT (%) | 756 (2.16) | 1,058 (3.17) | 1,133 (3.50) | 1,255 (4.08) |
| Bleeding (%) | 2,510 (7.16) | 3,771 (11.30) | 4,243 (13.11) | 4,270 (13.88) |
| Diabetes (%) | 5,061 (14.43) | 5,574 (16.71) | 5,367 (16.59) | 5,831 (18.95) |
| Concomitant medication | ||||
| Warfarin (%) | 1,742 (4.97) | 1,928 (5.78) | 2,395 (7.40) | 2,534 (8.23) |
| DOACs | 0 (0.00) | 0 (0.00) | 7 (0.02) | 765 (2.49) |
| Heparin (%) | 18 (0.05) | 32 (0.10) | 128 (0.40) | 214 (0.70) |
| Clopidogrel (%) | 40 (0.11) | 507 (1.52) | 1,033 (3.19) | 2,456 (7.98) |
| ASA(%) | 10,839 (30.90) | 12,916 (38.71) | 15,680 (48.46) | 13,354 (43.40) |
| NSAIDs (%) | 7,541 (21.50) | 8,287 (24.84) | 7,010 (21.67) | 5,840 (18.98) |
| Diuretics (%) | 7,761 (22.12) | 10,255 (30.74) | 11,934 (36.88) | 10,499 (34.12) |
| β-Blockers (%) | 4,309 (12.28) | 6,519 (19.54) | 7,899 (24.41) | 8,191 (26.62) |
| CC blockers (%) | 7,289 (20.78) | 7,472 (22.40) | 8,757 (27.06) | 8,868 (28.82) |
| RAS blockers (%) | 6,483 (18.48) | 9,748 (29.22) | 13,358 (41.28) | 13,746 (44.67) |
| Loop diuretics (%) | 8,161 (23.27) | 6,972 (20.90) | 6,229 (19.25) | 5,622 (18.27) |
| Statins (%) | 2,305 (6.57) | 7,225 (21.66) | 15,150 (46.82) | 15,291 (49.69) |
| Glucose-lowering agents (%) | 5,212 (14.86) | 5,270 (15.80) | 5,277 (16.31) | 5,815 (18.90) |
Continuous variables are presented as means (with standard deviation values) and discrete variables as percentages (%).
CC blockers, calcium channel blockers; RAS blockers, renin–angiotensin-converting system blockers; ASA, acetylsalicylic acid; VKA, vitamin K antagonist; NSAID, non-steroid anti-inflammatory drug; DOAC, direct oral anticoagulant; DVT, deep venous thrombosis; and IQR, interquartile range.
As apparent in the baseline characteristics (Table 1), we observed an increase in prevalence of several comorbidities between 1997 and 2016, including chronic kidney disease (4.3% vs. 7.6%), hypertension (11.5% vs. 38.7%), bleeding (7.3% vs. 14.3%), and diabetes (14.8% vs. 19.8%).
During the course of the study, 11 911 (9.05%) patients with PAD developed MI and 8462 (6.43%) were diagnosed with HF. The age-standardized IRs per 1000 person-years showed increasing trends of MI until 2002, with an estimated annual percentage change (APC) of +0.6 (95% CI 3.3–16.1, P-value 0.2). After the year 2002, the IR decreased significantly and persisted until the study end with an estimated APC of −5.0 (95% CI 3.7–6.3, P < 0.0001) (Figure 2). The age-standardized IR for HF declined, with an estimated APC of −3.3 (95% CI 2.0–4.6, P < 0.0001) (Figure 2), and on similar lines a decrease in APC of −3.5 (95% CI 3.0–4.0, P < 0.0001) was observed for CV mortality in PAD patients (Figure 2).

Age-standardized incidence rates per 1000 person-years of myocardial infarction, heart failure, and cardiovascular mortality in patients with peripheral artery disease (y-axis) from 1997 to 2016 (x-axis). The figure shows a declining annual incidence rate of heart failure and cardiovascular mortality, whereas we observed an initial increase in incidence rates of MI until 2002, followed by a sustained decrease for the rest of the study period.
In addition, the 1-year cumulative incidence of MI in patients with PAD was 1.88% for the years 1997–2000, 2.12% for the years 2001–05, 1.59% for the years 2006–10, and 1.32% for the years 2011–16, respectively. The corresponding 1-year cumulative incidence of HF in patients with PAD was 1.71%, 1.48%, 1.25%, and 1.11% for the 1997–2000, 2001–05, 2006–10, and 2011–16 year-groups, respectively. Furthermore the 1-year cumulative incidence of CV mortality in patients with PAD was 12.0%, 9.41%, 8.75%, and 7.80% for the 1997–2000, 2001–05, 2006–10, and 2011–16 year-groups, respectively (Figure 3).
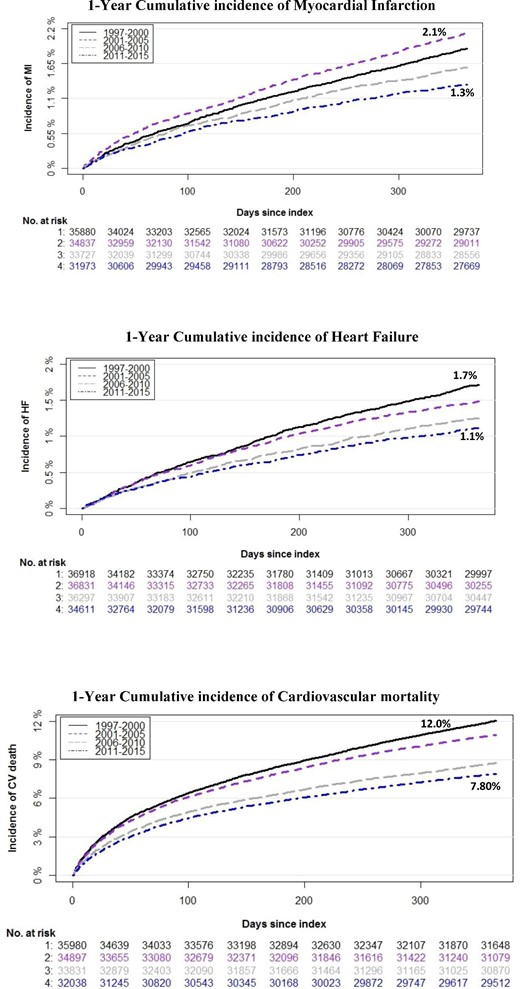
Cumulative incidence curves with death as competing risk and number of patients at risk within 1 year from first diagnosis of peripheral artery disease to development of myocardial infarction, heart failure, or cardiovascular mortality. The at-risk table represents the number of patients at risk of an event at a given time (i.e. each month for all four time periods).
Discussion
This nationwide register-based cohort study, including all patients with a first diagnosis of PAD in Denmark, examines 20 years of trends in the incidence of MI and HF between 1997 and 2016. During the study period, a significant decrease was observed in the age-adjusted incidence of MI and HF, alongside a decrease in CV mortality. The corresponding 1-year cumulative incidence showed decreasing trends of MI, HF, and CV mortality in patients with PAD.
PAD is a manifestation of systemic atherosclerosis that is associated with the presence of traditional CV risk factors, including diabetes mellitus, hypertension, dyslipidaemia, obesity, and tobacco consumption.1,2 Furthermore, along with endothelial dysfunction and a hypercoagulable state, studies have indicated heightened low-grade inflammation in PAD.14 Indeed, previous studies have shown that common inflammatory markers (IL-6, TNF-a, and fibrinogen) explain nearly 20% of the association of PAD and CV morbidity and mortality.15,16 Consequently, patients with PAD experience a multitude of problems, including frequent hospitalizations, adverse CV and limb complications, and a poor quality of life.2
Being the leading cause of mortality and serious morbidity, atherothrombotic diseases including PAD place a substantial healthcare and socioeconomic burden on society.17 Nonetheless, given the recent advances in the treatment and management of PAD and traditional CV risk factors, we expect a decline in PAD-associated morbidity and mortality. This is evident in recent population-based studies assessing temporal trends in the use of guideline-based cardioprotective medication in patients with PAD, which report an overall improvement in the use of these agents during the last decade.18 Indeed, subjects with a concurrent PAD and CV disease are more likely to receive antiplatelet therapy, statins, β-blockers, and angiotensin-converting enzyme inhibitors than patients with PAD alone. These findings are reflected in the results observed in the present study, where we find a significant decline in age-adjusted IRs of MI, HF, and CV mortality in PAD patients. Nonetheless, the current sum of data indicates an underrecognition and undertreatment of PAD, and a downward trend observed in this study may, in part, represent the more rigorous treatment given to these patients due to the presence of risk factors related to other CV diseases.19,20 As shown in Figure 1, there is a transient increase in incident MI between 1997 and 2002, followed by a marked decline that persists until 2016, i.e. the study end (Figure 1). This increase is presumably attributable to novel diagnostic criteria (introduced around year 2000) that included troponin as the primary diagnostic biomarker for diagnosing MI.21,22 This change of biomarker use has most likely amplified the detection rate of even smaller infarcts and thus predominantly increased the rates of MI, particularly that of non-ST segment elevation myocardial infarction (NSTEMI). A small register-based study from Olmsted County also reported similar trends in the general population with increasing incidence of NSTEMI until 2003, whereafter the IRs declined.23 In the present study, the persistent decline in MI rates in the PAD population (after a steep rise until year 2002) is most likely explained by improvements in strategies aimed at reducing traditional CV risk factors (e.g. smoking, physical activity, hypertension, dyslipidaemia, and diabetes), early initiation of cardioprotective drugs for primary and secondary prevention, and increased use of percutaneous coronary intervention (PCI) as the first choice of treatment.24,25 In addition, better use of antiplatelet therapy in patients undergoing PCI and awareness on detection of elevated troponins related to other reasons such as HF and atrial fibrillation could also explain this favourable decline.
In line with the decline in MI incidence, we also observed a marked decline in age-adjusted CV mortality rates and the cumulative incidence in patients with PAD during the study period (Figure 2). These temporal trends are consistent with the declining pattern that has been observed in CV mortality rates in the general population in past years.26,27 The trend towards lower mortality rates in this study likely mirrors a number of improvements in pre-, in-, and post-hospital management, e.g. more specialized CV departments, increased use of PCI, and a more aggressive secondary prevention therapy after discharge from the hospital.28,29 In addition, frequent use of more sensitive cardiac biomarkers that enable identification of even less severe cases of MI may also have contributed to lower CV mortality rates.30 Notably, a recent cohort study based on data from Danish registers as used in the present study estimated the age-adjusted mortality rates per 1000 person-years (IRs) and showed a decreasing trend varying from IR 19.3 (1997) to IR 13.9 (2016) with an estimated APC of 1.7% (95% CI 1.3–2.1, P < 0.0001) for the entire study period (1997–2016).18 Although the CV mortality and incidence of MI have markedly reduced, the prevalence of comorbidities has increased. With increasing life expectancy, higher survival rates, enhanced screening and diagnostics, and increased use of medication, it is expected that individuals with incident CVD (including those with PAD) will have increased prevalence of multimorbidity. This is also apparent in our results, where we see an increase from 1997 to 2016 in chronic kidney disease (4.3% vs. 7.6%), hypertension (11.5% vs. 38.7%), bleeding (7.3% vs. 14.3%), and diabetes (14.8% vs. 19.8%), which portends a rising burden. Correspondingly, we also see an increase in the use of cardioprotective medication between 1997 and 2016 in our study population (Table 1).
In this study, we also demonstrated a persistent decline in the age-adjusted IRs and the cumulative incidence of HF among PAD patients in the past two decades (Figure 3). HF is a common chronic clinical syndrome associated with a high comorbidity burden and adverse impact on quality of life.31 Despite the recent improvements in therapy, HF remains a major challenge with increased healthcare utilization. PAD and HF share many common risk factors, such as diabetes, atherosclerosis, hypertension, smoking, obesity, and inflammation.5,6 Studies have demonstrated that patients with PAD have nearly two-fold increased risk of HF.7 Contemporary data on patterns and trends of HF in PAD population are limited; however, a few studies have reported a reduction in incident HF in the general population without PAD.23,32 Consistent with the trends reported in the general population, we observed a similar decline in age-adjusted IRs and cumulative incidence of HF in patients diagnosed with PAD. Despite this moderate decline, the burden of HF is increasing, which is apparent in the observed rise in the concurrent comorbidities (Table 1). Nevertheless, earlier detection and improved preventive treatments of CV risk factors may have contributed to the overall reduction in the standardized incidence of HF.
Robust long-term data about contemporary population-level disease incidence play an important role in ensuring an efficient and effective treatment and management strategy. To the best of our knowledge, despite the well-known association and evidence on the prognostic implication of MI and HF in PAD, studies evaluating the long-term trends in incidence of MI, HF, and CV death in PAD patients in the past two decades are lacking. We therefore used the Danish national health and administrative registers to examine this important topic. The results from our study demonstrate an overall decreasing incidence of MI, HF, and CV mortality in patients with PAD across the study period but an increase in cardiometabolic risk factors. Although the drop in IRs is encouraging, this may portend a rising burden related to more prevalent HF and CV disease in the PAD population. More attention should be paid to patients in whom coexistence of MI and PAD as well as HF and PAD occurs, as they represent a vulnerable subgroup at a very high risk for adverse outcomes. Our findings also underline the importance of physician awareness and adherence to guidelines in accommodating comorbidities and managing PAD and warrant additional investigations to further examine the epidemiological underpinnings of the observed trends.
Strengths and limitations
The most noteworthy strength of this study is that it includes a large number of unselected patients from a real-world setting. Through a unique personal identification number that each citizen acquires at birth, Denmark's national healthcare system enables researchers to link data across numerous nationwide registries, including all inpatient and outpatient hospital contacts, all drug prescriptions, and data on death and causes of death. These data linkages provide a unique opportunity of conducting direct measurement of national disease incidence. Furthermore, completeness of follow-up and use of validated measures of exposure and outcome are also among some of the key strengths of this study. The Danish healthcare system is government financed and guarantees free-of-charge and equally accessible healthcare for all citizens, which contributes to reducing confounding by variables associated with societal class.
Nevertheless, there are also a number of limitations that must be acknowledged. First, the observational nature of the study only enables us to establish associations and does not represent cause-and-effect relationships. Moreover, the populations were identified by using diagnosis from the registers; although the registration of data in Danish registers is generally known to be accurate, there still may be some limitations regarding the PAD diagnoses, especially as PAD is underreported due to the often-asymptomatic nature of the disease. Hence, it is possible that some patients with asymptomatic PAD with no hospital record were not identified in this study. Also, we did not have access to data on a number of important parameters, including alcohol intake, tobacco consumption, obesity, and glucose and lipid levels. Finally, the Danish population is predominantly of Northern European descent, and generalizability of our findings to other ethnicities should be performed with caution.
Conclusions
In this nationwide study, we find a significant decline in the age-standardized incidence of MI, HF, and CV mortality in patients with PAD. Our findings suggest that preventive strategies have overall improved, most likely because of a combination of public health measures and improvement in clinical care. Results from this study may have implications for healthcare resource planning and future preventive strategies.
Funding
None declared.
Author contributions
S.K., T.S., H.D., and G.G. designed the study. S.K. performed the statistical analyses and wrote the initial draft of the paper. All authors contributed equally to interpretation of data, revised the paper for important intellectual content, and approved the final version of the paper.
Data availability
The data underlying this study were provided by ‘Danmark Statistik’ under licence/by permission. Data can be shared on request with permission of Danmark Statistik.
Conflict of interest: none declared.
