


Abstract
An increasing number of studies have shown that flight training alters the human brain structure; however, most studies have focused on gray matter, and the exploration of white matter structure has been largely neglected. This study aimed to investigate the changes in white matter structure induced by flight training and estimate the correlation between such changes and psychomotor and flight performance. Diffusion tensor imaging data were obtained from 25 flying cadets and 24 general college students. Data were collected in 2019 and 2022 and analyzed using automated fiber quantification. This study found no significant changes in the flight group in 2019. However, in 2022, the flight group exhibited significant alterations in the diffusion tensor imaging of the right anterior thalamic radiation, left cingulum cingulate, bilateral superior longitudinal fasciculus, and left arcuate fasciculus. These changes occurred within local nodes of the fiber tracts. In addition, we found that changes in fiber tracts in the 2022 flight group were correlated with the reaction time of the psychomotor test task and flight duration. These findings may help improve flight training programs and provide new ideas for the selection of excellent pilots.
Introduction
The act of flying presents a formidable challenge as pilots must continuously adjust the aircraft’s attitude by manipulating the control lever and elevator in response to instrument feedback. Processing the received cognitive information is crucial for determining the appropriate type and degree of motion control. Consequently, flight operations entail intricate psychomotor tasks, with the psychomotor ability of the pilot serving as a pivotal factor in ensuring flight safety. Previous research on helicopter pilots has demonstrated that their psychomotor abilities are influenced by factors such as task load, flight duration, and operational fatigue. Therefore, helicopter pilots must possess exceptional levels of psychomotor proficiency to perform diverse tasks during flights (McMahon and Newman 2015, 2018). In addition, studies have indicated an association between changes in white matter and variations in psychomotor ability (Bracht et al. 2012; Walther et al. 2012; Hyett et al. 2018). Simultaneously, several studies have demonstrated that the acquisition of new skills or the accumulation of experience in specific tasks can induce alterations in white matter integrity. For instance, complex visuomotor training has been shown to increase fractional anisotropy (FA) values in local white matter structures within the brain (Bengtsson et al. 2005; Scholz et al. 2009). Furthermore, investigations conducted on automobile drivers have demonstrated a positive correlation between the augmented FA values of white matter fiber tracts in brain regions associated with driving skills, such as cognition and visuomotor abilities, and the accumulation of driving experience (Megías et al. 2018). Therefore, the objective of this study was to investigate alterations in white matter integrity among pilots following extensive flight training.
In our previous study, we discovered increased connectivity between the default mode network and central executive network among pilots (Chen et al. 2019, 2020). Furthermore, there was an enhancement in the degree centrality values of the left middle frontal gyrus and left lingual gyrus (Chen et al. 2023), indicating significant changes in both brain function and structure after long-term flights compared with ordinary professionals. However, previous studies have primarily focused on functional magnetic resonance imaging (MRI), neglecting the examination of white matter structures. The white matter serves as a hub for nerve fibers in the brain and plays a crucial role in connecting various functional areas within the cerebral cortex through fiber tracts (Sporns et al. 2005). Diffusion tensor imaging (DTI) was employed to investigate the white matter changes. DTI technology enables us to capture information about white matter fiber tracts and other tissues by detecting the diffusion of water molecules within tissues. Therefore, DTI has been widely used to study white matter alterations (Conturo et al. 1999; Le Bihan 2003). One method is automated fiber quantification (AFQ; Yeatman et al. 2012), which employs deterministic fiber-tracking technology to automatically extract 20 major white matter fiber tracts from the entire brain. The fiber tract was precisely divided into 100 nodes, and DTI parameters were mapped to each node (Hua et al. 2008). Compared with alternative methods, AFQ allows for more accurate localization of specific areas where changes occur within the white matter fiber tracts. Currently, AFQ technology has been extensively applied to explore the integrity and degree of damage present in fiber tracts during neuroimaging studies related to various diseases, such as neuromyelitis optica spectrum disorder and Cushing’s disease (Hua et al. 2008; Yan et al. 2022).
This is the first study to investigate changes in white matter fiber tracts in pilots using AFQ. In this study, flying cadets were selected as research participants. Flying cadets are in the initial stage of becoming pilots and need to complete various flight training programs to meet the competency standards for flight tasks. Therefore, this study was conducted using flying cadets. We hypothesized that flight training would enhance the psychomotor performance of student pilots and result in changes in the white matter fiber tracts. The cadets were asked to complete a test task to assess their psychomotor abilities. In addition, 2 key milestones in flight training are typically considered: the time taken before achieving the first solo flight and obtaining a private pilot’s license (PPL; McLean et al. 2016). These milestones are often used as benchmarks for measuring cadets’ talent, proficiency, and flight skills (Koonce 1998). Therefore, we recorded each cadet’s flight duration until they reached these milestones to evaluate their flight ability, with shorter flight duration often indicate superior flying ability. Our aim was to demonstrate that changes observed in white matter fiber tracts after flight training can serve as a basis for developing more scientific flight training plans and provide brain imaging support for selecting future flying cadets.
Materials and methods
Participants and study design
The study protocol was approved by the Ethics Committee of the University of Electronic Science and Technology of China.
The participants were recruited from the Civil Aviation Flight College of China. All enrolled participants underwent MRI scans. After excluding individuals with a history of traumatic brain injury, substance-related disorders, or nervous system diseases, 25 male flying cadets and 24 male general students were included in the final analysis and divided into 2 groups: the flying cadet group and ground control group. Prior to participation, all participants provided written informed consent. Data collection occurred twice: initially in 2019, when all participants had just commenced their college education, followed by a second assessment in 2022, after an interval of 31 to 41 mo. During this period, in addition to a variety of regular courses, each cadet completed 40 h of simulated flight training, as well as various durations of actual flight training with a C172R, SR-20, or DA-42 aircraft. The ground control group completed only 3 yr of regular courses.
During the initial phase of data collection, we acquired high-resolution structural images (T1) and DTI data. In addition to obtaining the MRI data, psychomotor ability assessments were conducted in both groups during the second phase of data collection. We also recorded the flight duration of the cadets for the 2 key training objectives.
Data acquisition
All participants underwent MRI scans at the Magnetic Resonance Imaging Center of University of Electronic Science and Technology of China, using a 3-T MRI scanner (DISCOVERY MR 750, General Electric, USA) to acquire T1-weighted images with a 3D spoiled gradient echo pulse sequence (echo time = 1.976 ms; repetition time = 5.976 ms; matrix size = 256 × 256; number of slices = 154; flip angle = 9°; FOV = 256 × 256 × 154 mm; voxel size = 1 × 1 × 1 mm), as well as DWI data using a spin-echo EPI sequence in 64 diffusion directions (repetition time = 8500 ms; b-value = 1000 s/mm2; matrix size = 128 × 128; slice thickness = 2 mm and number of slices = 78; FOV = 256 × 256 mm).
Psychomotor ability was assessed using the psychology experiment building language (PEBL), which incorporates a computerized version of 94 psychometric tests (Mueller and Piper 2014). We adopted one of these tests called the “move to target” (Move) task, with a test duration of ~5 min. The task required the participants to move to the target within a time limit; if they did not move to the target in time, the target disappeared and was recorded as an error. When moving to the target, the target immediately appears elsewhere, and the cycle repeats. At the end of the first trial, after 30 targets, the mapping changes. This task measures hand–eye coordination and is used to assess the participants’ psychomotor abilities.
We recorded the time taken by the flying cadets to achieve the 2 key training objectives. The number of days from the first actual flight training to the first solo flight was recorded as the flight duration to first solo. The number of days from the first solo flight to obtaining the PPL was recorded as the flight duration to the PPL.
Image data preprocessing
Data preprocessing involves the following steps: (i) inspection of the collected MRI image data to assess data quality, including the resolution ratio, dimensional information, b-values, signal-to-noise ratio, and artifacts. Images that do not meet requirements are removed using MRICRON software; (ii) conversion of DICOM format image data to NIFTI format using the dcm2nii function in MRICRON software; (iii) eddy motion correction and gradient direction correction performed on the image data using FSL software to correct for head movement-induced deformation and eddy motion changes and adjust original gradient direction according to eddy motion correction; (iv) brain mask obtained to remove non-brain tissue and limit fiber tracking scope; (v) tensor calculations performed using dtifit function in FSL software to generate FA, mean diffusivity (MD), and other indicators (Jenkinson et al. 2012).
AFQ analysis
The process of fiber tract tracking and quantification by AFQ involves the following steps (Yeatman et al. 2012): (i) calibration of registration point coordinates for each participant’s T1 structural image data, (ii) conversion of preprocessed data to AFQ format, (iii) whole-brain fiber tract tracking for each participant with termination conditions based on thresholds of FA < 0.2 or turning angle < 30°, (iv) division of whole-brain fiber tracts using region of interest (ROI) defined by Wakana, where crossing 2 labeled ROIs defines a specific fiber tract (Wakana et al. 2007), (v) removal of outliers in the fiber tract while retaining only its central part between the 2 ROI definitions, and (vi) determination of center points for each node within a divided whole-brain fiber tract consisting of 100 nodes. Calculations are performed to obtain the average FA and MD values for each fiber tract and node.
Statistical analysis
Statistical analysis was performed using SPSS (version 26.0; IBM, Chicago, IL, USA). An independent sample t-test was used to compare the right-handedness rate between the flying and ground groups, whereas a chi-square test was employed to compare their ages. The independent sample t-test was used to compare the DTI parameters of the white matter fiber tracts between the flying and ground groups in 2019, and between the flying and ground groups in 2022. The paired sample was used to compare the DTI parameters of the white matter fiber tracts between the flying group in 2019 and 2022, and between the ground group in 2019 and 2022. Significance levels were set at P < 0.05, and false discovery rate corrections were applied for multiple comparisons.
Subsequently, a bivariate correlation analysis was performed to examine the relationship between the DTI parameters of the significantly different fiber tracts in the 2022 flying group with the psychomotor ability test results of flying cadets (total accuracy of Move, reaction time of Move) and flight duration for the cadets to reach the 2 key training objectives (flight duration to first solo, flight duration to PPL). All comparisons were conducted using a 2-tailed approach, with statistical significance set at P < 0.05.
Results
Basic information of the participants
As shown in Table 1, there were no statistically significant differences in age, gender, and right-handedness between the 2 groups (P < 0.05). In addition, there were no statistically significant differences in psychomotor ability test results between the 2 groups. Table 1 presents the flight durations required for cadets to achieve the 2 key training objectives.
Basic information of 2 groups.
| Flying cadet (n = 25) | Ground control (n = 24) | t-value (chi-square test) | P-value | |
|---|---|---|---|---|
| Age (yr)a | 18.84 ± 0.69 | 18.88 ± 0.85 | −0.159d | 0.88 |
| Gender (male) | 100% | 100% | ||
| Handedness (right)b | 96% | 92% | 0.40c | 0.53 |
| Move_total accuracy (%) | 0.94 ± 0.04 | 0.92 ± 0.05 | −1.452 | 0.153 |
| Move_reaction time (ms) | 1128.87 ± 114.96 | 1170.40 ± 124.59 | 1.184 | 0.242 |
| Flight duration to first solo (days) Flight duration to PPL (days) | 45.69 ± 17.51 116.31 ± 38.12 |
Notes: Data are presented as means ± standard deviations. aThe age of participants in 2019. bThe proportion of right-handed people in the participants. cTwo-tailed t-tests. dChi-square tests.
Results of the AFQ
Group differences in DTI parameters in 2019
There were no significant differences in the mean FA and MD of the 20 fiber tracts between the flying cadet and ground control groups in 2019. There were no significant differences in the FA and MD values of the 100 nodes within each fiber tract between the flying and the ground groups.
Group differences in DTI parameters in 2022
After comparing the average FA values of 20 fiber tracts between the flying cadet group in 2022 and the ground control group, it was found that the average FA values of the flying cadet group were significantly higher than those of the ground control group for the right anterior thalamic radiation (ATR), right superior longitudinal fasciculus (SLF), and left arcuate fasciculus (AF). There were no significant differences in the average FA values of the other fiber tracts (Table 2). When comparing the MD values for both groups across all 20 fiber tracts, it was found that, on average, flying cadets had significantly lower MD values than the ground control group for both the left SLF and left AF. No significant differences were observed in the MD values of the other fiber tracts (Table 3).
Comparison of mean FA between groups in 2022.
| Tract | G:F | Ground control (n = 24) | Flying cadet (n = 25) | t-value | P-value |
|---|---|---|---|---|---|
| ATR_L | 24:24 | 0.429 ± 0.025 | 0.437 ± 0.020 | −1.207 | 0.234 |
| ATR_R | 24:24 | 0.436 ± 0.023 | 0.450 ± 0.022 | −2.086 | 0.043a |
| CST_L | 24:24 | 0.605 ± 0.022 | 0.598 ± 0.021 | 1.184 | 0.243 |
| CST_R | 24:24 | 0.584 ± 0.022 | 0.585 ± 0.019 | −0.059 | 0.953 |
| CGC_L | 24:24 | 0.490 ± 0.032 | 0.508 ± 0.036 | −1.795 | 0.079 |
| CGC_R | 24:24 | 0.460 ± 0.035 | 0.450 ± 0.028 | 1.097 | 0.278 |
| CGH_L | 22:23 | 0.373 ± 0.039 | 0.368 ± 0.039 | 0.407 | 0.686 |
| CGH_R | 24:21 | 0.397 ± 0.044 | 0.387 ± 0.035 | 0.773 | 0.444 |
| CCF_P | 24:24 | 0.614 ± 0.042 | 0.599 ± 0.088 | 0.790 | 0.433 |
| CCF_A | 24:24 | 0.577 ± 0.024 | 0.581 ± 0.018 | −0.569 | 0.572 |
| IFOF_L | 24:24 | 0.474 ± 0.028 | 0.468 ± 0.019 | 0.851 | 0.399 |
| IFOF_R | 24:24 | 0.464 ± 0.035 | 0.462 ± 0.020 | 0.249 | 0.804 |
| ILF_L | 24:24 | 0.444 ± 0.027 | 0.432 ± 0.029 | 1.451 | 0.154 |
| ILF_R | 24:24 | 0.429 ± 0.022 | 0.421 ± 0.026 | 1.210 | 0.233 |
| SLF_L | 24:24 | 0.406 ± 0.046 | 0.422 ± 0.040 | −1.305 | 0.198 |
| SLF_R | 24:24 | 0.442 ± 0.034 | 0.469 ± 0.039 | −2.525 | 0.015a |
| UF_L | 24:24 | 0.418 ± 0.029 | 0.421 ± 0.028 | −0.341 | 0.734 |
| UF_R | 24:24 | 0.404 ± 0.027 | 0.405 ± 0.019 | −0.203 | 0.840 |
| AF_L | 24:22 | 0.467 ± 0.028 | 0.485 ± 0.027 | −2.173 | 0.035a |
| AF_R | 21:18 | 0.449 ± 0.033 | 0.430 ± 0.031 | 1.781 | 0.083 |
Notes: Data are presented as means ± standard deviations. G:F represents the number of participants who successfully traced each fiber tract in the flying cadet and ground control groups. aBold numbers indicate P-value < 0.05. Abbreviation: CST, corticospinal tract; CGH, cingulum hippocampus; CCF, corpus callosum forceps; IFOF, inferior fronto-occipital fasciculus; ILF, inferior longitudinal fasciculus; UF, uncinate fasciculus; L, left; R, right; P, posterior; A, anterior..
Comparison of mean MD between groups in 2022.
| Tract | G:F | Ground control (n = 24) | Flying cadet (n = 25) | t-value | P-value |
|---|---|---|---|---|---|
| ATR_L | 24:24 | 0.743 ± 0.022 | 0.738 ± 0.014 | 0.928 | 0.358 |
| ATR_R | 24:24 | 0.762 ± 0.027 | 0.759 ± 0.019 | 0.323 | 0.748 |
| CST_L | 24:24 | 0.745 ± 0.023 | 0.736 ± 0.015 | 1.603 | 0.116 |
| CST_R | 24:24 | 0.749 ± 0.027 | 0.739 ± 0.016 | 1.521 | 0.137 |
| CGC_L | 24:24 | 0.742 ± 0.020 | 0.740 ± 0.020 | 0.473 | 0.638 |
| CGC_R | 24:24 | 0.739 ± 0.021 | 0.742 ± 0.024 | −0.413 | 0.681 |
| CGH_L | 22:23 | 0.792 ± 0.026 | 0.790 ± 0.039 | 0.237 | 0.813 |
| CGH_R | 24:21 | 0.770 ± 0.039 | 0.766 ± 0.026 | 0.429 | 0.670 |
| CCF_P | 24:24 | 0.827 ± 0.051 | 0.837 ± 0.073 | −0.521 | 0.605 |
| CCF_A | 24:24 | 0.788 ± 0.015 | 0.786 ± 0.017 | 0.441 | 0.661 |
| IFOF_L | 24:24 | 0.778 ± 0.020 | 0.780 ± 0.017 | −0.279 | 0.782 |
| IFOF_R | 24:24 | 0.790 ± 0.018 | 0.795 ± 0.025 | −0.831 | 0.410 |
| ILF_L | 24:24 | 0.788 ± 0.022 | 0.790 ± 0.026 | −0.229 | 0.820 |
| ILF_R | 24:24 | 0.793 ± 0.027 | 0.787 ± 0.020 | 0.932 | 0.356 |
| SLF_L | 24:24 | 0.724 ± 0.020 | 0.710 ± 0.018 | 2.555 | 0.014a |
| SLF_R | 24:24 | 0.717 ± 0.023 | 0.706 ± 0.016 | 1.879 | 0.067 |
| UF_L | 24:24 | 0.760 ± 0.019 | 0.757 ± 0.021 | 0.449 | 0.656 |
| UF_R | 24:24 | 0.799 ± 0.021 | 0.797 ± 0.023 | 0.306 | 0.761 |
| AF_L | 24:22 | 0.723 ± 0.020 | 0.710 ± 0.019 | 2.280 | 0.028a |
| AF_R | 21:18 | 0.713 ± 0.017 | 0.707 ± 0.016 | 1.066 | 0.293 |
Notes: Data are presented as means ± standard deviations. G:F represents the number of participants who successfully traced each fiber tract in the flying cadet and ground control groups. aBold numbers indicate P-value < 0.05. Abbreviation: CST, corticospinal tract; CGH, cingulum hippocampus; CCF, corpus callosum forceps; IFOF, inferior fronto-occipital fasciculus; ILF, inferior longitudinal fasciculus; UF, uncinate fasciculus; L, left; R, right; P, posterior; A, anterior..
The point-by-point comparison of FA values at 100 nodes along each fiber tract between the 2 groups revealed that the FA values in the anterior part of the left cingulum cingulate (CGC) and the posterior part of the right SLF were significantly higher in the flying group than in the ground group (Table 4; Fig. 1). There were no significant differences in FA values among the other nodes along the fiber tracts. A point-by-point comparison of the MD values at 100 nodes along each fiber tract between the 2 groups revealed that the MD values in the anterior, middle, and posterior parts of the left SLF were significantly lower in the flying group than in the ground group (Table 5; Fig. 2). There were no significant differences in the MD values among the other nodes along the other fiber tracts.
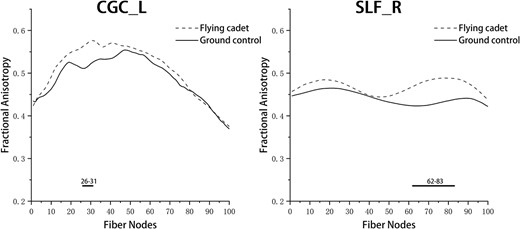
Pointwise comparison of FA between groups in 2022. Notes: The Y-axis represents the FA values. The X-axis represents the positions of the 100 nodes. The horizontal thick line represents nodes with statistically significant differences between the groups. Abbreviation: L, left; R, right.
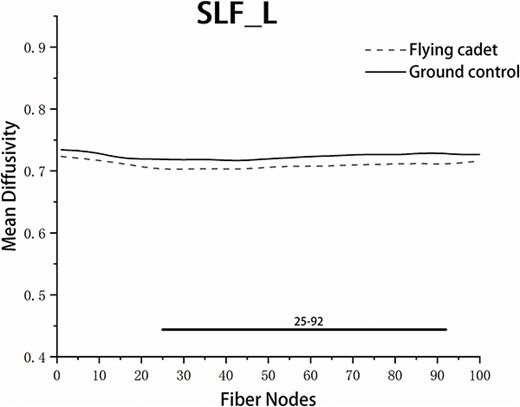
Pointwise comparison of MD between groups in 2022. Notes: The Y-axis represents the FA values. The X-axis represents the positions of the 100 nodes. The horizontal thick line represents nodes with statistically significant differences between the groups. Abbreviation: L, left.
Pointwise comparison of FA between groups in 2022.
| Tract | Fiber nodes | Ground control (n = 24) | Flying cadet (n = 25) | t-value | P-value |
|---|---|---|---|---|---|
| CGC_L | 26 to 31 | 0.517 ± 0.058 | 0.570 ± 0.053 | −3.365 | 0.002 |
| SLF_R | 62 to 83 | 0.429 ± 0.047 | 0.483 ± 0.067 | −3.254 | 0.002 |
| Tract | Fiber nodes | Ground control (n = 24) | Flying cadet (n = 25) | t-value | P-value |
|---|---|---|---|---|---|
| CGC_L | 26 to 31 | 0.517 ± 0.058 | 0.570 ± 0.053 | −3.365 | 0.002 |
| SLF_R | 62 to 83 | 0.429 ± 0.047 | 0.483 ± 0.067 | −3.254 | 0.002 |
Notes: Data are presented as means ± standard deviations. Abbreviation: L, left; R, right.
Pointwise comparison of MD between groups in 2022.
| Tract | Fiber nodes | Ground control (n = 24) | Flying cadet (n = 25) | t-value | P-value |
|---|---|---|---|---|---|
| SLF_L | 25 to 92 | 0.723 ± 0.020 | 0.707 ± 0.017 | 2.792 | 0.008 |
| Tract | Fiber nodes | Ground control (n = 24) | Flying cadet (n = 25) | t-value | P-value |
|---|---|---|---|---|---|
| SLF_L | 25 to 92 | 0.723 ± 0.020 | 0.707 ± 0.017 | 2.792 | 0.008 |
Notes: Data are presented as means ± standard deviations. Abbreviation: L, left.
Longitudinal comparison of DTI parameters between 2019 and 2022
The fiber tracts that showed significant differences between the 2022 flying cadet group and the ground control group were selected for longitudinal comparison between 2 time points in 2019 and 2022.
When comparing the mean FA values of the right ATR, right SLF, and left AF in the ground groups in 2019 and 2022, no significant changes were observed. However, when comparing the mean FA values of these same fiber tracts between the flying groups in 2019 and 2022, it was found that both right ATR and left AF exhibited significantly higher mean FA values in the 2022 flying group compared with those in the 2019 flying group, whereas no significant change was observed in mean FA values within the right SLF (Table 6).
Comparison of mean FA between the flying cadet groups in 2019 and 2022.
| Tract | Q:H | 2019 (n = 25) | 2022 (n = 25) | t-value | P-value |
|---|---|---|---|---|---|
| ATR_R | 25:24 | 0.436 ± 0.029 | 0.450 ± 0.022 | −2.820 | 0.010a |
| AF_L | 23:22 | 0.474 ± 0.033 | 0.485 ± 0.027 | −3.086 | 0.006a |
| Tract | Q:H | 2019 (n = 25) | 2022 (n = 25) | t-value | P-value |
|---|---|---|---|---|---|
| ATR_R | 25:24 | 0.436 ± 0.029 | 0.450 ± 0.022 | −2.820 | 0.010a |
| AF_L | 23:22 | 0.474 ± 0.033 | 0.485 ± 0.027 | −3.086 | 0.006a |
Notes: Data are presented as means ± standard deviations. Q:H represents the number of participants who successfully traced each fiber tract in the flying cadet groups in 2019 and 2022. aBold numbers indicate P-value < 0.05. Abbreviation: L, left; R, right.
The comparison of the mean MD values of the left SLF and left AF between the ground groups in 2019 and 2022, as well as the flying groups in 2019 and 2022, revealed no statistically significant alterations in the mean MD values of these 2 fiber tracts within both longitudinal comparisons.
Analysis of correlation
The bivariate correlation analysis, using the Pearson correlation coefficient, was conducted to examine the relationship between the FA and MD values of fiber tracts that exhibited significant differences in the flying cadet group in 2022 and the psychomotor ability test results, as well as the flight duration to the 2 key training objectives (Fig. 3). Negative correlations were found between reaction time of psychomotor ability test task “Move” and mean FA values in the right ATR (r = −0.422,P = 0.040). Negative correlations were found between flight duration to PPL and FA values in the left CGC (nodes 26 to 31; r = −0.538,P = 0.032). In addition, negative correlations were observed between flight duration to PPL and FA values in the right SLF (nodes 62 to 83; r = −0.527,P = 0.036), along with a significant negative correlation with reaction time of “Move” (r = −0.492, P = 0.015). No significant correlations were observed between the DTI parameters of the other fiber tracts and psychomotor abilities or flight duration.
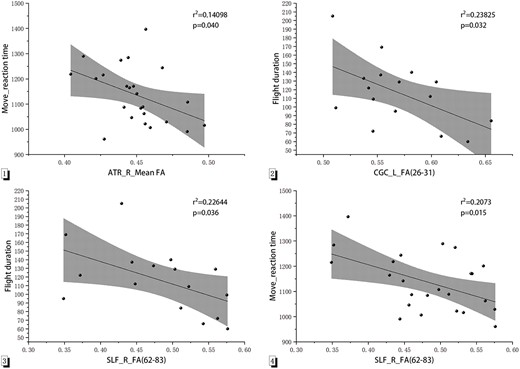
Correlation between psychomotor ability and flight duration with DTI parameters of each fiber tract. Notes: 1: The Y-axis represents the reaction time of the test task “Move” (ms). The X-axis represents the mean FA value of the entire ATR. 2: The Y-axis represents flight duration to the PPL (in days). The X-axis represents the FA value of the left CGC (nodes 26 to 31). 3: The Y-axis represents flight duration to the PPL (in days). The X-axis represents the FA value of the right SLF (nodes 62 to 83). 4: The Y-axis represents the reaction time of the test task “Move” (ms). The X-axis represents the FA value of the right SLF. Abbreviation: L, left; R, right.
Discussion
In this study, we used the AFQ technique to investigate differences in white matter fiber tracts between flying cadets and general college students. To ensure meaningful research results, we collected data from 2 groups of participants (flying and ground) using a before-after control method over a span of 2 yr (2019 and 2022) and analyzed them separately. The results showed no significant differences in DTI parameters between the flying and ground groups in 2019. However, the flight group in 2022 exhibited significantly higher mean FA values in the right ATR, right SLF, and left AF than the ground group. In addition, they had significantly lower mean MD values in the left SLF and left AF than the ground group. Furthermore, when comparing fiber tracts point-by-point between groups in 2022, the FA values were significantly higher in the flying group than in the ground group for both the anterior parts of the left CGC and posterior parts of the right SLF. Finally, the MD values were significantly lower in the anterior, middle, and posterior parts of the left SLF. In the subsequent correlation test, we found that the average FA values of the right ATR and the right posterior SLF of the 2022 flight group were negatively correlated with the reaction time of the Move task, and the FA values of the left anterior CGC and the right posterior SLF were negatively correlated with the flight duration to reach the PPL.
Among the DTI parameters, the FA value reflects the ratio of the anisotropic component of water molecules to the entire diffusion tensor, which indicates the sparsity and integrity of the fiber tracts to some extent (Beaulieu 2002; Alexander et al. 2007). The MD value reflects the degree of diffusion of water molecules in all directions, indicating their diffusion ability in tissues and the integrity of the myelin sheath to a certain extent (Le Bihan et al. 2001; Assaf and Pasternak 2008). Therefore, the increased FA and decreased MD values of certain fiber tracts in the flying group may indicate that the flying group exhibits better integrity of these fiber tracts than the ground group.
During flight training, the main subjects for flying cadets include take-off, landing, and air maneuvers. These training subjects require cadets to maintain focus at all times, monitor the display information of each instrument (wind direction or airspeed) while observing the external environment (ground reference points or runways), and ultimately achieve operational control of the aircraft’s attitude based on this (McLean et al. 2016). Furthermore, throughout extended periods of flight training, cadets must consistently recall prior training experiences in order to develop conditioned reflexes. These may be partially analogous to some functions of the altered white matter fiber tracts found in this study.
Among the fiber tracts with changes, the ATR is a white matter fiber tract that connects the thalamus and the prefrontal cortex. Studies have shown that the ATR can affect individuals’ reaction speeds in tasks requiring attention control, and a higher FA value of the ATR indicates better attention control ability (Mamiya et al. 2018). Alternatively, it has been suggested that the microstructure of ATR white matter is associated with performance on tasks assessing processing speed. Specifically, higher FA values in the ATR region have been linked to faster completion of processing speed tests that include psychomotor speed and visual search (Ferris et al. 2022). The CGC is a tract of white matter fibers located in the cingulate gyrus. It originates from the anterior part of the cingulate gyrus, crosses over to the corpus callosum, connects to the hippocampal gyrus, and extends to the temporal pole. Studies have shown that the FA values of the CGC correlate with individual executive function and performance in a divided attention task (Schermuly et al. 2010; Takahashi et al. 2010). Additionally, the left CGC is additionally implicated in overall memory and cognitive function, characterized by a low FA value and suboptimal performance on related testing tasks (Luo et al. 2019). The SLF is a white matter fiber tract connecting the parietal and prefrontal cortices, and is considered an integral part of the visuospatial attention network (Podwalski et al. 2022). Previous studies demonstrated that it plays a role in the persistence of visuospatial processing and attention (Thiebaut de Schotten et al. 2005; Parlatini et al. 2017). Furthermore, there is evidence suggesting a correlation between working memory performance and the structural integrity of white matter in the SLF (Samara et al. 2019). Additionally, utilizing AFQ technology for detailed examination of SLF has revealed that the structural integrity of white matter in the right SLF is associated with metacognitive abilities required for completing memory tasks (Zheng et al. 2021), which refers to the capacity for retrieving preceding cognitive processes (Fleming and Dolan 2012).
In this study, we used the Move task in PEBL to assess participants’ psychomotor abilities. This task primarily examined visuomotor coordination, akin to a tracking task. Previous research demonstrated that visuomotor coordination resembles the tasks performed by pilots during flight. The reaction speed and accuracy of completing visuomotor coordination tasks can reflect pilots’ psychomotor abilities (McMahon 2019). In our correlation analysis, we discovered that the mean FA values of the right ATR and FA values of the right SLF (nodes 62 to 83) in the 2022 flight group exhibited a negative correlation with reaction time on the Move task. Therefore, we propose that increased FA values in the ATR and SLF of individuals who fly may be associated with higher levels of psychomotor ability.
Meanwhile, in the correlation test, we also found that the FA value of the left CGC (nodes 26 to 31) and the FA value of the right SLF (nodes 62 to 83) were negatively correlated with flight duration to the PPL, indicating that an increased FA value may be associated with better flight ability. These findings align with previous studies on car drivers, which have shown that an increase in FA values in the right SLF and other white matter fiber tracts may be associated with driving experience, frequency, and skill (Megías et al. 2018).
This study has some limitations. First, we did not test the participants’ psychomotor ability at the time of the initial data collection in 2019; therefore, we were unable to compare changes in their psychomotor ability between the 2 time points. In addition, these findings need to be confirmed using a larger sample size.
Conclusion
In conclusion, this study is the first to evaluate alterations in white matter fiber tracts in the brain caused by flight training. Using the AFQ, we determined that flight training could lead to changes in white matter fiber tracts among flying cadets, and that these changes might be associated with higher flight and psychomotor performance. We hope that the results of this study will serve as a basis for developing more scientific flight training programs and for selecting flying cadets.
Acknowledgments
The authors would like to thank the Institute of Aviation Human Factors and Cognitive Neuroscience in Civil Aviation Flight University of China.
Author contributions
Xi Chen (Conceptualization, Data curation, Funding acquisition, Project administration, Resources, Supervision, Validation), Qi Chu (Data curation, Formal analysis, Investigation, Software, Validation, Visualization, Writing—original draft, Writing—review & editing), Qingbin Meng (Conceptualization, Data curation, Supervision, Validation, Writing—review & editing), Peiran Xu (Data curation, Validation, Writing—review & editing), and Shicong Zhang (Validation, Writing—review & editing). All authors contributed to this article.
Funding
The National Nature Science Foundation of China (no. U2033217); Sichuan Science and Technology Program (2023NSFSC1183); Foundation of General Program in Civil Aviation Flight University of China (FZ2020ZZ03); Institute of Aviation Human Factors and Cognitive Neuroscience (JG2022-17).
Conflict of interest statement. None declared.
Data availability
The data related to this study can be found in the online repository, and the name and enrollment number of the repository are available at: https://pan.baidu.com/s/1C0dLdo4xv9IODWSwXNzAlQ?pwd=9tjz.