


Abstract
Impairments in working memory (WM) are evident in both clinically diagnosed patients with mild cognitive decline and older adults at risk, as indicated by lower scores on neuropsychological tests. Examining the WM-related neural signatures in at-risk older adults becomes essential for timely intervention. WM functioning relies on dynamic brain activities, particularly within the frontoparietal system. However, it remains unclear whether the cognitive decline would be reflected in the decreased dynamic reconfiguration of brain coactivation states during WM tasks. We enrolled 47 older adults and assessed their cognitive function using the Montreal Cognitive Assessment. The temporal dynamics of brain coactivations during a WM task were investigated through graph-based time-frame modularity analysis. Four primary recurring states emerged: two task-positive states with positive activity in the frontoparietal system (dorsal attention and central executive); two task-negative states with positive activity in the default mode network accompanied by negative activity in the frontoparietal networks. Heightened WM load was associated with increased flexibility of the frontoparietal networks, but the cognitive decline was correlated with reduced capacity for neuroplastic changes in response to increased task demands. These findings advance our understanding of aberrant brain reconfiguration linked to cognitive decline, potentially aiding early identification of at-risk individuals.
Introduction
Cognitive decline is a prevalent concern among older adults, and its progression into clinically diagnosed diseases, such as dementia, is a significant challenge (Grady 2012). Age-related cognitive decline can impact various cognitive domains, including memory, attention, and executive functions. Working memory, as a fundamental cognitive ability essential for temporarily storing and manipulating information in a goal-directed manner, is among the cognitive functions most sensitive to decline in old age (Baddeley 2012). In alignment with this, deficits in WM are notably prevalent in progressive neurodegenerative disorders, including mild cognitive impairment (MCI) and Alzheimer’s disease (AD) (Wolk and Dickerson 2010). The Montreal Cognitive Assessment (MoCA) has been widely used to assess cognitive decline in the elderly and previous studies indicate that older adults recruited from the community, who fell below normative means on a standardized neuropsychological test (such as MoCA), exhibit a higher risk for future diagnosed cognitive impairment (Chen et al. 2016). The importance of early detection and intervention is underscored by the transition from normal aging to cognitive impairment and neurodegenerative diseases (Sperling et al. 2011). Detecting cognitive pathology via neuroimaging techniques may precede the onset of subjective memory complaints and clinical diagnosis by several years (Márquez and Yassa 2019). A widely used measure for the assessment of working memory function is the n-back task (Owen et al. 2005). It can be applied with functional magnetic resonance imaging (fMRI) to investigate working memory-related neural activity. Therefore, examining the WM-related neural signatures in preclinical yet at-risk older adults becomes imperative for a comprehensive understanding and timely intervention.
Resting-state fMRI emerges as a non-invasive neuroimaging technique, facilitating the measurement and mapping of brain activity. Resting-state fMRI are relatively easy to collect and do not depend on subject cooperation with task performance. It has been used widely in assessing changes in brain function related to cognitive impairment, such as the aberrations in the functional activity of different brain networks that normally occur in AD and MCI (Ibrahim et al. 2021). Extensive research employing resting-state fMRI studies has revealed that the human brain is organized into distinct functional networks. The default mode network prominently activates at rest (referred to as the task-negative network), contrasts with the frontoparietal network, activated during attention-demanding cognitive tasks (referred to as the task-positive networks) (Buckner et al. 2008; Raichle 2015). Recent investigations suggest a relationship between resting-state brain activity and cognitive impairment. Notably, functional connectivity of the default mode network was correlated with cognitive screening test scores and can be used to discriminate AD and MCI subjects from healthy controls (Ibrahim et al. 2021). Furthermore, resting-state fMRI studies have demonstrated alternations in brain regions within the frontoparietal system in individuals with MCI (Yang et al. 2023). Functional alternations in the dorsal frontoparietal network have shown promise as a sensitive marker to forecast the progression from MCI to AD (Qian et al. 2015). While resting-state fMRI is a promising way to explore the relationship between an individual’s spontaneous brain activity and behavior performance, task-based fMRI remains essential for delineating brain mechanisms related to specific domains of cognitive decline.
Task-based fMRI serves as a valuable tool for probing the neural substrates of WM and elevated brain activity during WM tasks has been observed in subjects at risk for AD (Yetkin et al. 2006; Aramadaka et al. 2023). However, conventional approaches to task-fMRI analysis often fall short of capturing the dynamic reorganization characteristics. A growing body of evidence underscores the brain’s dynamic nature, capable of flexibly integrating functions and allocating resources in response to diverse cognitive demands (Cole et al. 2013; Krienen et al. 2014; Cohen and D'Esposito 2016). In recent years, the exploration of large-scale network dynamics has spurred the development of various methods. As one of these methods, coactivation pattern analysis is a data-driven analytic technique that uses the spatial distribution and magnitude of activation at each time point of whole-brain data as input to a clustering analysis to identify recurring brain coactivation states. Specifically, this approach employs graph-based modular partitioning on a time-frame basis, dividing a single time point into a brain state and identifying recurrent dynamic brain state coactivation patterns during cognitive tasks (Medaglia et al. 2018). This allows for the observation of temporal dynamics, including transitions from state to state, time spent in states, and dwell time. Published studies utilizing this approach have examined rapid changes in brain coactivation patterns during working memory tasks in healthy young subjects. Their observations provide a valuable reference for characterizing potential abnormal cognitive functioning in neuropsychiatric disorders (Braun et al. 2015; Gu et al. 2021). Therefore, it is worthwhile to explore the dynamic reconfiguration in older subjects and investigate whether the observed dynamics in brain state-level analyses can offer novel insight into functional alternations related to cognitive decline.
In the present study, we treat the brain as a dynamic system with recurrent brain coactivation states, which are defined as the pattern of activation magnitudes across various brain areas, and the graph theory approach was applied to code the temporal relationships between them. Our focus centers on characterizing the dynamic network reconfiguration during a verbal WM task, with a specific emphasis on exploring the interplay between temporal dynamics and the risk of developing MCI, as assessed by the MoCA, in a cohort of community-dwelling older adults. We hypothesized that the cognitive decline in older adults at risk for MCI would be reflected in the decreased dynamic modulation of transient brain coactivation states in response to WM demands. The outcomes of this investigation have the potential to advance our understanding of aberrant temporal dynamic brain reconfiguration associated with working memory deficits in the elderly population. Moreover, these findings may carry implications for enriching prevention clinical trials designed to slow the progression of cognitive decline.
Materials and methods
Experimental design
A total of 47 healthy elderly subjects without any reported dementia-related diagnosis were enrolled. Participant demographic data are shown in Table 1. The study was approved by the Medical Ethics Committee of Shenzhen University (approval date: October 2022; approval number: PN-202200058). Written informed consent was obtained from all the participants before the experiment.
Participant characteristics.
| Mean | Standard deviation | Range | |
|---|---|---|---|
| Gender | 15 M/28 F | ||
| Age (year) | 63.37 | 4.47 | 55–80 |
| Education (year) | 10.08 | 3.18 | 4–15 |
| IADL | 23.91 | 0.29 | 23–24 |
| MoCA | |||
| Total | 22.26 | 3.65 | 16–29 |
| Visualspatial/executive | 3.35 | 1.00 | 1–5 |
| Naming | 2.23 | 0.68 | 1–3 |
| Attention | 4.95 | 1.20 | 2–6 |
| Language | 1.60 | 0.85 | 0–3 |
| Abstraction | 0.84 | 0.84 | 0–2 |
| Delayed recall | 2.65 | 1.34 | 0–5 |
| Orientation | 5.81 | 0.58 | 3–6 |
| global PSQI score | 6.28 | 3.47 | 0–16 |
IADL, instrumental activities of daily living scale; MoCA, Montreal Cognitive Assessment; PSQI, Pittsburgh Sleep Quality Index.
Subjects were recruited based on the following criteria: (i) right-handedness with normal vision and hearing, no severe physical activity impairment; (ii) absence of diagnosed psychiatric or neurological disorders, such as depression, dementia, Parkinson’s, or cerebral infarction; (iii) no use of medications related to neurological and mental conditions; (iv) no major physical illness, history of craniocerebral trauma, or history of severe alcohol or drug abuse; (v) absence of confirmed diagnosis of MCI. Cognitive function evaluation employed the Chinese version of the MoCA, administered by trained investigators. To account for variations in educational backgrounds, subjects with less than or equal to 12 years of education had one point added to their original MoCA scores, following established protocols (Nasreddine et al. 2005; Malek-Ahmadi et al. 2015). The MoCA encompasses various cognitive domains, including visuospatial/executive, naming, attention, language, abstraction, delayed recall, and orientation (Nasreddine et al. 2005). Recognized as a widely utilized method in cognitive impairment detection, MoCA has demonstrated superiority over other screening tools, such as the Mini-Mental State Examination (MMSE), particularly in MCI identification (Jia et al. 2021). Previous research has established that older adults with MoCA scores below 22 face an elevated risk of cognitive impairment (Chen et al. 2016). Consequently, participants with a MoCA score below 22 were deliberately included in this study to comprehensively explore the association between cognitive ability and brain activities. Besides, subjective sleep disturbance was assessed via participant completion of the Pittsburgh Sleep Quality Index (PSQI) (Buysse et al. 1989).
For each enrolled participant, an fMRI experiment was conducted within two weeks following the completion of clinical assessments. During fMRI scanning, participants engaged in a digit n-back WM task, which is widely used to investigate the neural substrates of WM (Yaple et al. 2019) (as illustrated in Fig. 1). The n-back task consisted of three runs featuring distinct WM load levels (0-, 1-, and 2-back), as indicated by an instruction cue preceding each run. The sequence of task runs was counterbalanced across all the subjects. Within each run, eight task blocks were interleaved with seven rest blocks. In each task block, ten randomly generated digits ranging from “0” to “9” were sequentially presented in the center of a black for 2000 ms, with an interstimulus interval (ISI) of 500–1,000 ms (pseudorandomized within each block). In the 0-back condition, the target was defined as the number “0.” In the 1- or 2-back condition, the target was a number presented in the preceding one or two trials. Each task block included three target stimuli with pseudorandomized occurrence. Participants were instructed to press a button with their left hand for target stimuli and their right hand for non-target stimuli. Rest blocks featured a white fixation cross at the center of a black screen for 15 s. All participants received detailed instructions and practice before the MRI scanning. Task performance was evaluated using response times (RT), accuracy (ACC), and d-prime, a measure of discriminative sensitivity (Haatveit et al. 2010). The d-prime score was computed using a z-score transformation of the difference between the percentage of correct responses (hit rate) and incorrect responses (false alarm rate). These behavioral measures were calculated for each condition of each subject.
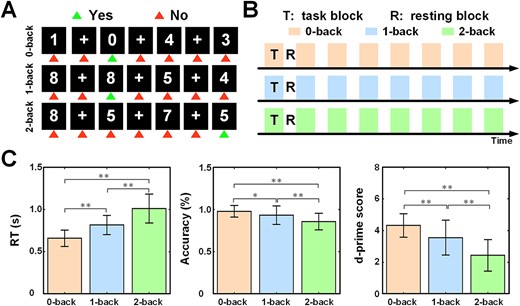
Digit n-back task and fMRI experimental design and task performance. (A) Sample trials of n-back task. In the 0-back task (first column), the number “0” should be identified as the target stimuli. In the 1-back task (second column), the first digit before the current one should be recalled. In the 2-back task (third column), the second digit before the current one should be recalled. (B) Three runs for each subject, corresponding to the three task conditions. Each task run included eight task blocks (T) and seven resting blocks (R). (C) Comparison among task conditions (*P < 0.05, **P < 0.005).
MRI data acquisition and preprocessing
All data were collected at the MRI Center of Shenzhen University. with a Siemens Prisma 3.0 T MRI scanner. In the beginning of each scanning procedure, one T1-weighted 3D plus sequence was obrained (TR = 2,300 ms, TE = 2.26 ms, FOV = 232 × 256 mm2, filp angle = 8°, voxel size = 1 × 1 × 1 mm3, slice number = 196). Functional data were obtained using a gradient echo echo-planar imaging pulse sequence (TR = 1000 ms, TE = 30 ms, FOV = 192 × 192 mm3, FA = 35°, voxel size = 2 × 2 × 2 mm3, slice number = 78).
fMRI Data preprocessing was performed using the Data Procession Assistant for Resting-State fMRI toolbox (Yan and Zang 2010) (DPARSF, http://rfmri.org/DPARSF), which is based on the Statistical Parametric Mapping 12 toolbox (SPM12, https://www.fil.ion.ucl.ac.uk/spm/) in MATLAB 2018a environment (https://www.mathworks.com/). Preprocessing of the functional images included common pipeline preprocessing steps. The first six volumes of each run were removed, followed by slice-timing correction and realignment. The subjects who had head movement larger than 2 mm translation or 2° of rotation in any direction were considered as excessive head movement during the scanning. Four subjects were excluded from the following analysis because of excessive head movements. Besides, each individual’s mean framewise displacement (FD) Jenkinson value was calculated and modeled as a covariate to regress out the head motion artifacts at the group-level analysis. Individual T1 images were co-registered with the functional images and segmented into gray matter, whiter matter (WM), and cerebrospinal fluid (CSF). The nuisance variables including the white matter signal, the cerebrospinal fluid signal, the secondary drift trend, Friston 24 head movement parameters (including six head movement parameters, six head movement parameters of the previous time point, and the squared terms of 12 corresponding parameters) were removed by regression. Functional images were normalized to Montreal Neurological Institute (MNI) space using the T1 anatomical to MNI warp and resampled as 3 × 3 × 3 mm3. Spatially smoothing with a 6 mm FWMH Gaussian kernel was applied and the time series were band-pass filtered (0.008–0.1 Hz).
Considering the reported brain atrophy associated with normal aging (Fujita et al. 2023), each subject’s total intracranial volume (TIV) was computed through voxel-based morphometry analysis (CAT12 toolbox, https://neuro-jena.github.io/cat/) and used as a covariate in subsequent statistical analysis.
Task activation analysis
First-level, single-subject was performed by adopting a general linear model (GLM) approach as implemented in SPM12. Each subject completed three run tasks and all runs were constructed as a GLM model for analysis. The neural activity was modeled by a box-car function representing activity sustained throughout task blocks. These functions were then convolved with a canonical hemodynamic responses function (HRF) to yield regressors that modeled the BOLD response for each task condition (0-back, 1-back, and 2-back). Six motion parameters estimated from rigid-body realignment as regressors of no interest and session-specific constant terms modeling the mean over scans of each run were also used in the design matrix. The GLM was fitted voxelwise into the filtered time series to generate individual activation maps for the 0-back, 1-back, and 2-back conditions. These individual activation maps were entered into the following second-level group analyses treating subjects as a random effect.
Brain coactivation states identification
The identification of brain states is a two-step process, first obtaining individual recurrent coactivation brain states at the subject level, followed by obtaining overall recurrent states at the group level.
Subject-level
Specifically, when conducting the subject-level analysis, the fMRI coactivation pattern at each time point was extracted to represent the brain state at the current acquisition and was defined as a network node. We only considered the coactivation patterns constrained to the gray matter using a common gray mask. The inverse of the Euclidean distance between each pair of network nodes (i.e. brain coactivation states) was calculated as a measure of similarity and defined as the weight of a network edge. Considering the delayed hemodynamic response function, for each task block, the first four TRs of each task block were deleted and four TRs were added from the following baseline block to make a concatenation of all task blocks (Liang et al. 2016). Then a time-by-time adjacency matrix AN × N was constructed for each run of each subject, where N equals the number of time points in the time series of each run and Aij represents the similarity of two brain coactivation states at the time I and time j.
Further, a community detection algorithm was applied to find recurring and common brain coactivation states using the adjacency matrix of each run. In this study, the network was divided into different communities (called brain coactivation states) using a novel data-driven clustering algorithm that finds the near-optimal partition of the network communities by maximizing the modularity quality function. The modularity quality function was defined as:
Aij denoted the similarity phase metric between nodes i and j, node i belonged to the community Ci, node j belonged to the community Cj, ki denoted the weighted sum of all edges connected to node i, kj denoted the weighted sum of all edges connected to node j, and γ was the structural resolution parameter. The modularity maximization detection was mainly based on the idea of the Louvain-greedy algorithm (Blondel et al. 2008), which was run in two steps to determine the optimal community partition results by the principle of local modularity increment maximization. Each community extracted using the above procedure contained multiple fMRI time frames (e.g. nodes) that showed similar patterns of coactivation. By averaging the normalized fMRI volumes across all time points assigned to the same community structure, the recurrent brain state maps of participants during each task run can be extracted.
During the modularity analysis, the choice of the structural resolution parameter γ can directly influence the temporal resolution of the dynamic sensitivity of brain coactivation states, with higher γ producing more brain coactivation states. The optimal value for γ is typically selected by defining a narrow range of values and evaluating the robustness of community partition results for different parameter values (Bassett et al. 2013). Here in the subject level, the range of γ values was set from 1 to 1.02 in increments of 0.0025 (Medaglia et al. 2018). For each γ value, the temporal adjacency matrix was optimized 100 times to determine a partition set that was most similar to the 100 consensus partitioning with the modularity. For each γ value, there was maximum modularity corresponding to the optimal community partitioning result, and it was important to choose an appropriate rather than a particular γ. By comparing the modularity with that of a zero-random network with a temporal adjacency matrix at the same value of γ, a higher modularity z-score indicated a stronger modularity structure for the community partitioning results of the network, which determined the proper resolution parameter γ at the individual level. The z-score of modularity was calculated as follows:
Qconsensus(γ) denoted the modularity corresponding to the result of consistent community partition identified after multiple optimizations of the network, mean(Qrandom(γ)) indicated the mean for the modularity of the random network, and std(Qrandom(γ)) represented the standard deviation of the modularity of the random network. The above procedure was performed for 0-back, 1-back, and 2-back conditions, respectively. The subject-level modularity z-score and the corresponding number of states for each γ value can be found in Supplementary Fig. S2. The maximum modularity z-score was obtained for all three conditions at γ = 1.0175. Therefore, the community segmentation results at γ = 1.0175 were selected for the identification of brain states at the subject level.
Group-level
The group-level brain coactivation states were calculated similarly to the individual-level calculations. At first, the brain state maps of all subjects under each task condition were concatenated to construct one brain state adjacency matrix, which was constructed with the reverse of the Euclidean distance between two subject-level recurrent brain coactivation states as edges and each brain state as a node. Here at the group level, the range of γ values was set from 1 to 1.20 in increments of 0.005 (Medaglia et al. 2018). Similarly, for each γ take value, the brain state adjacency matrix was optimized 100 times to determine a consistent brain state partition label and the corresponding modularity index. Then, after generating 100 randomly weighted networks by randomly assigning the weights in the brain state adjacency matrix, a modularity analysis was performed on the random network to obtain the distribution of the modularity index of the random network and to calculate the modularity z-score. The group-level modularity z-score and the corresponding number of states for each γ value can be found in Supplementary Fig. S3. As shown in the figure, when using the γ = 1.035 with maximum Q value, 36 states were obtained. However, too many states could affect the interpretability of the results. Hence, instead of using the γ with maximum Q value, we used 1.01 to generate a reasonable number of spatially distributed brain coactivation states with the appropriate number of brain coactivation states as reported in previous studies (Tognoli and Kelso 2014; Medaglia et al. 2018). Brain coactivation states assigned to the same group level were one-sample t-tested by voxels, and brain state values for voxels significant in the t-test were preserved for averaging, where significance was set at P < 0.005 (uncorrected), resulting in a map of recurrent brain state coactivation patterns at the group level. To delineate the contributions of distinct brain networks, we mapped the group-level coactivations of brain states derived from one-sample t-tests onto the 17 networks of the Yeo atlas (Yeo et al. 2011). For each brain state, we calculated the percentage of activations (positive or negative) belonging to different brain networks relative to the entire activated brain regions in that specific state.
Dynamic properties
Dynamic brain state features have spatio-temporal characteristics, which can reveal the dynamic information interaction of the brain activities. In this study, the following three dynamic brain state features were extracted for each run of each participant: (i) frequency of occurrence: the percentage of each dynamic brain state in all time points during each task run; (ii) mean dwell time: the average number of consecutive time points in which each brain state is present during each task run; (iii) the number of transitions from one state to another. Where the frequency of occurrence of dynamic brain coactivation states was calculated over the concatenated time series of all task blocks, the number of transitions and the mean dwell time of dynamic brain coactivation states were calculated for each task block and then the mean values were used.
Statistical analysis
Group-level analysis of task activation
The group-level brain activation map of each task condition was generated using a one-sample t-test with the inclusion of gender, age, educational level, mean FD, and TIV as covariates, and the significance level was set as P < 0.05 (FDR corrected). In order to extract which functional brain networks are involved during each task condition, we mapped the activations and deactivations derived from one-sample t-tests onto the 17 networks of Yeo atlas (Yeo et al. 2011) (as shown in Supplementary Fig. S1). Specifically, for each task condition, activations or deactivations are categorized within different brain networks, followed by the calculation of the coverage percentage relative to the total size of the network.
Comparison of dynamic properties of brain coactivation states
Each subject will have different dynamic brain state patterns during the completion of each task, thus different dynamic brain state features will be calculated. For the six brain coactivation states observed at the group level, not every subject exhibited all of them. This will lead to zero-inflated phenomena in the extracted dynamic features of brain coactivation states (including frequency of occurrence, mean dwell time, and number of transitions) (Lambert 1992). The commonly used one-way repeated measures analysis of variance (ANOVA) requires a balanced number of repeated measurements, a requirement unmet by the zero inflation in dynamic brain state features. Therefore, the present study used the Permutation with Zero-inflated Poisson Regression (PERM-ZIP) test proposed by Du et al. (2021) to compare differences in dynamic brain state features between WM load levels. The method was based on a statistical zero-inflated Poisson regression (ZIP) model. ZIP is a hybrid model consisting of a binomial process and a counting process (Yang et al. 2017), where the binomial process and the counting process typically estimate parameters using a logistic regression model and a logarithmic linear regression model, respectively. In general, the ZIP model was used to model the data for analysis by generating a set of parameters that included an intercept of the logistic regression model, coefficient of zero inflation pi, expectation, and variance.
To compare dynamic brain state features between different task levels (e.g. 2-back vs. 0-back), we can use the ZIP model to fit the data and obtain the corresponding ZIP parameters. Then, the ZIP parameters are tested for statistical differences between the two conditions by a permutation method. Specifically, we randomly divided the data of two conditions into two groups (43 participants in each condition after grouping), and such a random process was repeated 1,000 times. During each randomization permutation, we estimated the ZIP parameters of the two randomized groups and calculated the difference in ZIP parameters between the two randomized groups. Then, after 1,000 randomizations, a probability density distribution of the differences in the ZIP parameter was obtained. Finally, significance was determined by locating the position of the difference of the actual regression parameters on the probability density distribution of the ZIP parameter group differences. This procedure applies the ZIP (PERM-ZIP) method to rank each dynamic brain state feature (frequency of occurrence, mean dwell time, and number of transitions) separately.
Correlation analysis between dynamic properties and cognitive decline
For the dynamic characteristics of brain coactivation states that differed significantly between task conditions, Spearman non-parametric correlation analysis was performed to investigate their relationship with scores on cognitive performance (total score and domain-specific index scores of MoCA). Gender, age, education level, PSQI total score, mean FD, TIV, and WM task performance (d-prime score) were included as nuisance covariates.
Results
Demographic and behavioral performance
A total of 43 healthy elderly subjects were included in the final data analysis and participant characteristics are detailed in Table 1. To assess the effect of WM load on task performance, encompassing response time, accuracy, and d-prime scores, we employed a one-way repeated measures ANOVA. The results revealed a significant effect of WM load on RT, ACC, and d-prime scores (all P < 0.005; depicted in Fig. 1C). Subsequent pairwise multiple comparisons, corrected using the Bonferroni method, reflected a notable increase in reaction time alongside a significant decrease in accuracy and d-prime scores as the task difficulty increased.
Brain activation during the working memory task
Figure 2 shows group-level activation during each task condition contrasted with the rest condition. We delineated the activation and deactivation profiles across various subnetworks under distinct working memory load conditions, revealing both shared and widely distributed brain regions. Positive activation associated with the task is primarily observed in the dorsal and ventral attention networks, medial central executive network, and visual network. Conversely, task-induced negative activation predominantly engages the lateral-temporal and the ventral default mode networks. Compared to the 0-back condition, brain activation (positive or negative) in the higher WM-load conditions, namely 1-back and 2-back, exhibits a greater coverage percentage across different brain networks.
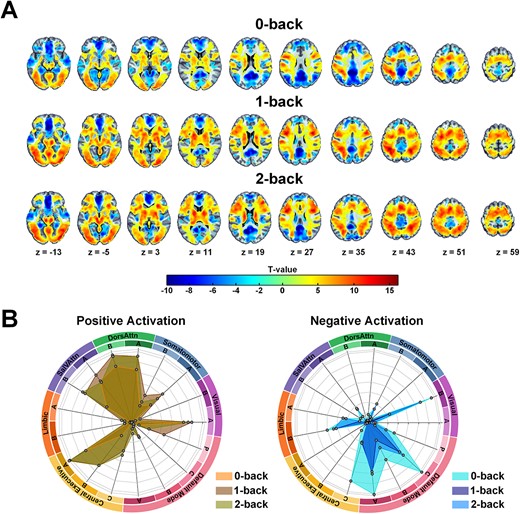
Group activation results for different levels of working memory load (0-back versus rest; 1-back versus rest; 2-back versus rest). A. One-sample t-test results displayed at P < 0.05 FDR correction for multiple comparisons. B. Spider plots depict the coverage percentage relative to the total size of different brain networks.
Dominant brain coactivation states during the working memory task
Using the fMRI data from this group of older adults engaged in the WM task, we initially identified individual-level brain coactivation states, ranging from 4 to 21 states. Subsequently, at the group level, a total of six distinct brain coactivation states were identified. Each brain state signifies a coherent pattern of activity across specific brain areas within a single time window. Details regarding the average frequency of occurrence and subject representation are depicted in Fig. 3. The frequency of State 1, State 2, State 3, and State 4 ranked in the top four, with 42.99%, 37.64%, 15.16%, and 2.43%, respectively. According to the spatial patterns of the identified brain states (as shown in Supplementary Fig. S4), the activated or deactivated regions associated with State 5 and State 6 display a comparatively scattered distribution with a smaller volume. As a result, only the four most prevalent brain states were considered as the final dominant states and utilized in subsequent analyses.
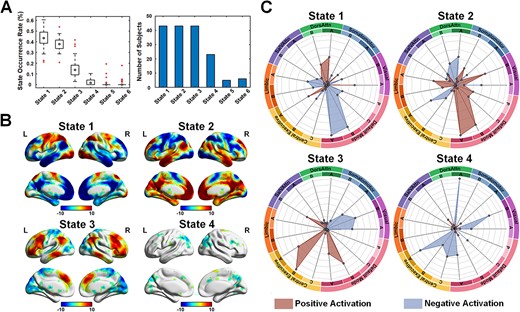
The identified brain states at the group level. (A) the state occurrence rate and the number of subjects exhibiting the specified state. (B) the recurrent brain states during the working memory task (threshold P < 0.005, uncorrected). (C) Spider plots show the percentage of involved brain networks for each state.
The four primary states exhibit distinctive activation and deactivation patterns, illustrated in Fig. 3 and Supplementary Fig. S4. In State 1, positive activity is observed in the DorsAttn, central executive (medial superior parietal), and central visual networks, accompanied by negative activity in the lateral-temporal and ventral default mode networks. State 2, as the first primary state, displays positive activity in the lateral-temporal and ventral default mode networks, coupled with negative activity in the DorsAttn network. State 3 displays positive activity in the medial central executive network and negative activity in the visual network. State 4 is characterized primarily by negative activity in the central executive and peripheral visual networks. Referring to the brain activation results depicted in Fig. 2B, States 1 and 3 are categorized as task-positive states due to their consistency with positive and negative activation during the task. Conversely, States 2 and 4 fall into the category of task-negative states as they exhibited negative activity in task-positive regions and positive activity in task-negative regions.
Dynamic properties of brain coactivation states
We calculated three indices to depict the temporal dynamic properties of the identified brain coactivation states from different perspectives. As shown in Fig. 4A, the state occurrence rate shows no significant differences between task conditions with different working memory loads. Regarding the mean dwell time, a WM load effect was observed for both State 1 and State 2 (Fig. 4B). Specifically, during the 2-back condition, the mean dwell time of State 1 was less than it was in both the 0-back (P < 0.001) and 1-back (P = 0.047) conditions. Additionally, the mean dwell time of State 2 during the 2-back condition was lower than that of the 0-back condition (P < 0.001). In the comparison of the number of transitions between the 2-back and the 0-back conditions (Fig. 4C), an increased number was observed for the transition from State 1 to State 2 (P = 0.033) and from State 2 to State 1 (P = 0.049). Conversely, a decreased number was observed for the transition from State 1 to State 1 (P = 0.019) and from State 2 to State 2 (P = 0.013).
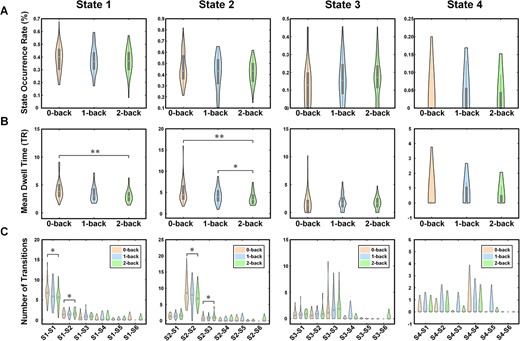
Differences in dynamic properties of brain states across three task conditions. *P < 0.05, **P < 0.005.
Cognitive decline-related effects
We conducted correlation analyses between clinical screening scores of cognitive function and dynamic properties exhibiting significant WM-load modulation effects (Table 2, Fig. 5).
Correlation between MoCA scores and dynamic properties of brain states.
| Mean dwell time | Number of transitions | |||||||||||
|---|---|---|---|---|---|---|---|---|---|---|---|---|
| State 1 | State 2 | State 1–State 1 | State 1–State 2 | State 2–State 1 | State 2–State 2 | |||||||
| R | P | R | P | R | P | R | P | R | P | R | P | |
| Total score | 0.270 | 0.116 | −0.058 | 0.742 | 0.325 | 0.057 | 0.187 | 0.281 | 0.194 | 0.265 | −0.124 | 0.478 |
| Visualspatial/executive | 0.295 | 0.086 | 0.184 | 0.290 | 0.426* | 0.011 | 0.367* | 0.030 | 0.397* | 0.018 | 0.116 | 0.508 |
| Naming | 0.115 | 0.510 | −0.180 | 0.301 | −0.034 | 0.846 | 0.173 | 0.321 | 0.138 | 0.428 | 0.004 | 0.982 |
| Attention | 0.307 | 0.073 | −0.003 | 0.986 | 0.348* | 0.041 | 0.128 | 0.465 | 0.066 | 0.705 | −0.276 | 0.109 |
| Language | 0.007 | 0.968 | 0.231 | 0.181 | −0.168 | 0.334 | −0.360* | 0.034 | −0.297 | 0.083 | 0.052 | 0.768 |
| Abstraction | 0.027 | 0.879 | −0.291 | 0.089 | 0.080 | 0.648 | 0.044 | 0.800 | 0.006 | 0.974 | −0.143 | 0.412 |
| Delayed recall | 0.026 | 0.883 | −0.092 | 0.598 | 0.182 | 0.294 | 0.155 | 0.345 | 0.184 | 0.290 | −0.059 | 0.738 |
| Orientation | 0.136 | 0.437 | 0.017 | 0.921 | 0.126 | 0.472 | −0.018 | 0.916 | −0.007 | 0.969 | −0.102 | 0.560 |
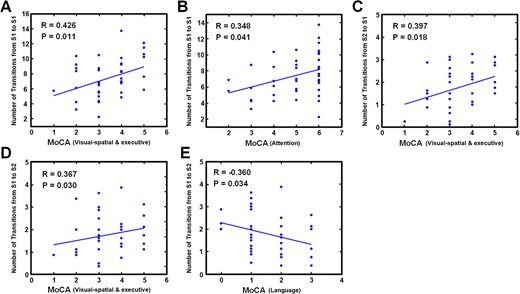
Correlation between MoCA score and temporal dynamics of brain state during 2-back condition.
Within the cognitive subdomains, results were mainly concentrated on the scores of visualspatial/executive, including the number of transitions from the primary task-positive State 1 to itself (R = 0.426 P = 0.011), from task-negative State 2 to State 1 (R = 0.397; P = 0.018), and from State 1 to State 2 (R = 0.367; P = 0.030). Additionally, a positive correlation was observed between the scores of attention and the number of transitions from State 1 to State 1 (R = 0.348; P = 0.041), and a negative correlation was observed between the scores of language and the number of transitions from State 1 to State 2 (R = −0.360; P = 0.034).
Discussion
To the best of our knowledge, this is the first study to determine the relationship between the dynamics of brain state reconfiguration during the working memory task and the risk of developing MCI in older adults before clinical diagnosis. Through a comprehensive exploration of temporally recurrent brain coactivation states based on coactivation patterns, we delved into the distinct patterns observed in community-dwelling older adults performing an n-back working memory task. This allowed us to establish associations between the dynamic characteristics of these brain states and the clinical scores obtained from cognitive screening tests. Our noteworthy findings unveiled four primary recurring brain coactivation states during the WM, each exhibiting unique coactivation patterns. Notably, State 1 and State 3, both categorized as task-positive, displayed coactivation in different networks within the frontoparietal system. Conversely, State 2 and State 4, identified as task-negative, exhibited positive activity in the default mode network and negative activity in the frontoparietal network. Our results demonstrated the increased dynamic flexibility of the frontoparietal systems in response to increased task difficulty in clinically unimpaired older adults. Additionally, cognitive function decline is accompanied by alternations in neuroplastic changes of the frontoparietal systems. This novel insight advances our understanding of the neural underpinnings of cognitive decline, emphasizing the pivotal role of brain state dynamics in such investigations.
The brain is a dynamic system, and cognitive function involves dynamically reconfiguring brain networks and engaging in complex and transient communication patterns. Diverse approaches for studying brain dynamics using neuroimaging data have emerged rapidly. Notably, dynamic functional network connectivity analysis, validated as a potent technique for exploring dynamic patterns, has gained prominence (Preti et al. 2017). There is a growing understanding that the information embedded in patterns of regional activity can be quite independent of information embedded in patterns of functional connectivity. Existing studies have demonstrated that activation patterns derived from the traditional GLM analysis do not necessarily align with patterns of weak or strong functional connectivity (Bassett et al. 2015). Furthermore, the temporal dynamics of an activity time trace might not correspond precisely to functional connectivity patterns (Siebenhühner et al. 2013). These findings collectively suggest that activity and connectivity offer distinct insights into the neural mechanisms involved in cognition. Graph theory offers distinct insights into the neural mechanisms function of the human brain, both during resting state and cognitive tasks (Sporns 2010). Expanding its application beyond traditional domains, graph theory can represent the temporal relationships between different brain coactivation states, defined as vectors of activation magnitudes across all brain regions. By applying graph theory to examine temporal transitions (network edges) between brain states (network nodes), we can cluster fMRI volumes (TRs) during WM into robust states based on their spatial activity patterns. This enables the observation of characteristics related to the temporal dynamics. Investigating the spatiotemporal characteristics of dynamic transient coactivation brain states contribute to a deeper understanding of the coordination underlying dynamic brain state reconfiguration. However, little research to date has focused on the spatiotemporal dynamic relationships emerging during both spontaneous and task-evoked activity.
Collectively, we observed four primary recurring brain coactivation states, each characterized by a distinct activation pattern across anatomically defined brain regions. The spatial congruence between the pattern of brain states and task-induced activation derived from traditional GLM analysis aids in elucidating the functional role of each brain state. States 2 and 4 can be categorized as task-negative, distinguished by positive activation in the default mode network that is typically active during rest. Numerous fMRI studies consistently reveal that various cognitive tasks lead to decreased activity in the default mode network, as observed from both a functional activation perspective (Pagnoni 2012) and functional interaction (Zhou et al. 2018). Besides, the default mode network is implicated in supporting tasks such as memory retrieval and semantic processing (Binder 2012; Spreng 2012) and plays a significant role in predicting WM performance (Amer et al. 2016). The occurrence of the default mode state during ongoing cognitive tasks may represent a transient shift in attention from task-related exteroceptive stimuli to task-irrelevant thought (Christoff et al. 2016). According to our results, the dwell time of task-negative State 2 and the transitioning probability of staying in State 2 gradually decreased with increasing cognitive task demands. This is consistent with observations in one published study (Gu et al. 2021) and could be explained by the possibility that as the brain allocates more resources to meet rising cognitive activity demands, fewer resources may be available for task-irrelevant thoughts (Christoff et al. 2009).
The effortful WM condition was characterized by a reconfiguration of frontoparietal networks (Braun et al. 2015), which demonstrates robust and consistent activation regardless of stimulus materials and paradigms (Rottschy et al. 2012). The DorsAttn network, anatomically referred to as the dorsal frontoparietal network, is prominently recognized for its involvement in the voluntary orienting of visuospatial attention (Vossel et al. 2014). Meanwhile, the central executive network, anatomically known as the lateral frontoparietal network, plays roles in sustained attention, complex problem-solving, and working memory (Menon 2011). In this study, two task-positive states, State 1 and State 3, were observed. State 1 features negative coactivation in the default mode network and positive activation in both the DorsAttn network and central executive network. State 3 displays positive coactivation in the central executive network, SalVattn Network, and default mode network, with negative coactivation in the Visual network. The mean dwell time of task-positive State 1 and the number of transitions of staying in State 1 decreased gradually with increasing cognitive task demands. But at the same time, the number of transitions from task-positive State 1 to task-negative State 2, and the number of transitions from State 2 to State 1 increased. A previous study involving healthy young subjects observed an increased occurrence rate of the task-positive state and the probability of transitioning from the task-negative state to the task-positive state, but the dwell time has not been evaluated (Gu et al. 2021). Additionally, apart from task-positive State 1, another recurrent task-positive State 3 was observed here, characterizing different frontoparietal networks. While statistical significance wasn’t achieved, there is a trend of increasing occurrence rate, dwell time, and transitions from State 1 or State 2 to State 3. Taks-positive State 3 involves the coactivation of the central executive network, responsible for controlling attention, selecting strategies, and manipulating information in WM (Funahashi 2017). An increase in the WM load makes the task more demanding of executive functions. Consequently, one way to interpret our results is the increased flexibility of the frontoparietal systems in response to increased task difficulty (Braun et al. 2015). Moreover, differences between our findings and those from studies involving younger subjects need to be validated by future investigations encompassing both age groups.
Neurocognitive research has prominently focused on establishing a connection between cognitive decline and disruptions in regional brain activity as well as functional connectivity. Cognitive symptoms observed in MCI are proposed to arise from suboptimal efficiency in both task-positive networks and the default mode network (Melrose et al. 2018). As mentioned above, our results demonstrated increased temporal flexibility of the frontoparietal systems in response to increased task difficulty. The influence of WM load on brain activity has been proposed as a reliable indicator for assessing cognitive functioning declines (Huang et al. 2021). According to the correlation analysis, subjects exhibiting cognitive decline (indicated by a lower score of visualspatial & executive and attention) demonstrated weaker dynamic transitions between State 1 and State 2 in the 2-back condition. These findings align with existing evidence that abnormalities in the frontoparietal cortices observed in task-fMRI studies are related to the visual and spatial executive subdomains of MoCA (Julayanont and Nasreddine 2017). However, the significant negative correlation observed between language scores and dynamic properties lacks a suitable explanation. Further investigations employing language tasks are needed. Collectively, our results indicate that older adults with cognitive decline exhibit a less pronounced capacity for functional neuroplastic changes in response to the demands of a high-difficulty WM task.
The findings of this study are subject to several methodological considerations. Firstly, the number of patients was limited and the statistical analysis results did not survive correction for multiple comparisons. This may limit the generalizability of our findings and need to be considered exploratory. Secondly, it is acknowledged that WM-related brain activity undergoes modulation with normal aging. While we attempted to mitigate the age effect by treating it as a nuisance covariate, future studies could extend their investigations by comparing different age groups. In addition to age, factors such as smoking and sleep can also influence the cognitive condition of the participants. We also employ the nuisance covariates regression to mitigate the impact of sleep quality on the results of correlation analysis, but smoking status could not be addressed due to a lack of assessment data. Thirdly, we used MoCA for the assessment of the current status of cognitive function. Subsequent studies might enhance the comprehensiveness of cognitive profiling by employing a more extensive neuropsychological battery and defining the high cognitive decline risk group through more rigorous diagnostic criteria. Furthermore, to establish causal links between the observed brain dynamic changes and Alzheimer’s disease (AD) development, longitudinal studies following “at-risk” subjects are imperative. Lastly, while our study utilized graph-theory-based brain-state analysis, recognizing the potential of other methods to offer complementary perspectives is crucial. Future endeavors could explore different approaches for evaluating brain state dynamics within the same dataset, enriching the understanding of the observed phenomena.
In summary, this study unveils alternations in the temporal dynamics of brain coactivation states in ostensibly cognitively healthy individuals with a higher risk of cognitive decline indicated by MoCA scores. This observation may be attributed to the decreased capacity for neuroplastic changes in response to the increased task demands. Our findings highlight a potential imaging biomarker of pathological aging.
Acknowledgments
We express our gratitude to all participants enrolled in this study.
Author contributions
Linling Li (Formal analysis, Investigation, Methodology, Project administration, Visualization, Writing—original draft, Writing—review and editing), Zaili Chen (Formal analysis, Project administration, Methodology, Visualization, Writing—original draft), Li Zhang (Conceptualization, Data curation, Methodology, Validation, Writing—review and editing), Min Zhang (Conceptualization, Investigation, Methodology, Validation), Honghai Liu (Resources, Supervision, Validation, Writing—review and editing), Donghui Wu (Project administration, Resources, Supervision), Ping Ren (Data curation, Formal analysis, Funding acquisition, Investigation, Methodology, Project administration, Validation, Writing—review and editing), and Zhiguo Zhang (Data curation, Formal analysis, Funding acquisition, Investigation, Methodology, Project administration, Supervision, Validation, Writing—review and editing).
Funding
This work was supported in part by the Natural Science Foundation of Guangdong Province, China (No. 2021A1515011152 and 2023A1515012911), the National Natural Science Foundation of China (No. 82272114), the Shenzhen-Hong Kong Institute of Brain Science-Shenzhen Fundamental Research Institutions (No. 2022SHIBS0003), the Shenzhen Science and Technology Innovation Commission fund (No. JCYJ20210324133208023).
Conflict of interest statement: None declared.
Data availability
The data that support the findings of this study are available from the corresponding author upon reasonable request.
References
Author notes
Linling Li and Zaili Chen contributed equally to this study.