


Abstract
Childhood experiences of low socioeconomic status are associated with alterations in neural function in the frontoparietal network and ventral visual stream, which may drive differences in working memory. However, the specific features of low socioeconomic status environments that contribute to these disparities remain poorly understood. Here, we examined experiences of cognitive deprivation (i.e. decreased variety and complexity of experience), as opposed to experiences of threat (i.e. violence exposure), as a potential mechanism through which family income contributes to alterations in neural activation during working memory. As part of a longitudinal study, 148 youth between aged 10 and 13 years completed a visuospatial working memory fMRI task. Early childhood low income, chronicity of low income in early childhood, and current income-to-needs were associated with task-related activation in the ventral visual stream and frontoparietal network. The association of family income with decreased activation in the lateral occipital cortex and intraparietal sulcus during working memory was mediated by experiences of cognitive deprivation. Surprisingly, however, family income and deprivation were not significantly related to working memory performance, and only deprivation was associated with academic achievement in this sample. Taken together, these findings suggest that early life low income and associated cognitive deprivation are important factors in neural function supporting working memory.
Introduction
Working memory (WM)—the ability to hold in mind and mentally manipulate information—is a component of executive function that demonstrates protracted development across childhood and adolescence (Miyake et al. 2000; Best et al. 2011; Ferguson et al. 2021). WM performance in childhood is supported by activation in regions of the frontoparietal network, including the middle frontal gyrus (MFG), intraparietal sulcus (IPS), and superior parietal cortex, as well as the dorsal anterior cingulate cortex (dACC), anterior insula, and precuneus (Satterthwaite et al. 2013; Kharitonova et al. 2015; Rosenberg et al. 2020). Greater activation in these regions is associated with age-related improvements in WM performance (Crone et al. 2006; Satterthwaite et al. 2013). Critically, numerous studies have demonstrated that, on average, children from lower socioeconomic status (SES) backgrounds perform worse on WM tasks than their high-SES peers (Noble et al. 2005, 2007; Farah et al. 2006; Lawson et al. 2018; Rosen et al. 2020). Differences in recruitment of regions in the frontoparietal network during WM tasks may underlie SES-related differences in WM performance (Finn et al. 2017; Sheridan et al. 2017; Rosen et al. 2018). These differences in WM and neural function may explain, in part, the well-established income-achievement gap (Best et al. 2011; Finn et al. 2017; Last et al. 2018; Rosen et al. 2020; Deer et al. 2020). We propose that specific types of more proximal environmental experiences that are more common among children growing up in low-SES households may influence the development of neural systems supporting higher-order cognitive capacities and underlie these SES-related differences in WM performance.
It is challenging to ascertain which aspects of a low-SES environment contribute to disparities in WM performance and neural function. Structural inequities increase the risk that children from low-SES backgrounds will be exposed to a wide variety of adverse experiences, including neighborhood violence, harsh punishment, family conflict, caregiver separation, low cognitive stimulation, and food insecurity, among many others (Evans 2004; McLaughlin et al. 2012; Johnson et al. 2016; Rosen et al. 2019). Experiences of childhood adversity can be organized into at least two dimensions that share common features: threat (i.e. experiencing harm or threat of harm) and deprivation (i.e. a reduction in expected cognitive and social experiences; McLaughlin, Sheridan, Lambert, 2014; McLaughlin et al. 2021; Sheridan and McLaughlin 2014). Experiences of threat and deprivation may have distinct influences on children’s emotional, cognitive, and neural development.
The dimensional model of adversity posits that experiences of deprivation influence the development of higher-order cognitive functions—including executive function and language—and the neural systems that support these abilities due to reductions in cognitive and social stimulation (Sheridan and McLaughlin 2014; McLaughlin et al. 2017). In contrast, experiences of threat are proposed to have primary influences on neural systems involved in emotional and salience processing, as well as fear learning (McLaughlin and Lambert 2017). Recent work from our research group and others supports the hypothesis that experiences of deprivation, including neglect and low cognitive stimulation, but not threat, are consistently associated with differences in executive function (Sarsour et al. 2011; Hackman et al. 2015; Lambert et al. 2017; Miller et al. 2018, 2021; Amso et al. 2019; Machlin et al. 2019; Rosen et al. 2020; Vogel et al. 2021) and the structure and function of the frontoparietal control network (Mueller et al. 2010; Sheridan et al. 2017; Romeo et al. 2018; Rosen et al. 2018). Consistent with these findings, a recent meta-analysis of 91 studies found that deprivation was more strongly linked to WM and inhibitory control performance than experiences of threat (Johnson et al. 2021). Moreover, investigations of constructs analogous to deprivation, as in the Investment Model (see Conger et al. 2010), find that caregiver investment in their children in the form of stimulating children’s learning, providing material necessities, and living in resource-rich communities, are consistently associated with children’s cognitive outcomes (Bradley et al. 2001; Linver et al. 2002; Yeung et al. 2002; Gershoff et al. 2007). A recent systematic review by McLaughlin et al. (2019) found mixed results with regard to recruitment of the frontoparietal network during executive function tasks among children exposed to threat, with some studies finding greater recruitment of the prefrontal cortex (PFC) for children who have experienced threat or mixed experiences of adversity (Lim et al. 2015), others finding less recruitment (Lim et al. 2016; Fava et al. 2019) and some finding no differences (Jankowski et al. 2017; Sheridan et al. 2017). In contrast, studies investigating deprivation-related experiences have more consistently found associations with activation in the frontoparietal network as well as frontoparietal structure (Edmiston et al. 2011; McLaughlin, Sheridan, Winter, et al. 2014; Herzberg et al. 2018; Hodel et al. 2015).
Experiences of threat have demonstrated associations with altered fear learning and emotion regulation processes, as well as altered structure and function of the hippocampus, amygdala, and salience network (Pollak et al. 2000; McLaughlin et al. 2015, 2016; Heleniak et al. 2016; Lambert et al. 2017; Machlin et al. 2019; Milojevich et al. 2019; Weissman et al. 2019; Jenness et al. 2021). The differential associations of threat and deprivation with these neural systems are also supported by a recent systematic review of the literature (McLaughlin et al. 2019).
In the present study, we specifically focus on cognitive deprivation as a potential environmental mechanism contributing to SES-related differences in WM. Cognitive deprivation and cognitive stimulation exist on a spectrum. Cognitive stimulation is characterized by caregiver involvement in children’s learning, engagement in a variety of enriching experiences (e.g. interactions with caregivers, activities outside the home), access to educational resources like books and toys, and a complex linguistic experience (Bradley and Corwyn 2002; Farah et al. 2008; Rosen et al. 2019). While there is noted variability in experiences of cognitive stimulation across low-SES households, on average, children in low-SES environments tend to experience less cognitive stimulation than children in high-SES environments (Hart and Risley 1995; Bradley et al. 2001; Crosnoe et al. 2010; Rosen et al. 2020). Low cognitive stimulation or cognitive deprivation in the home environment is associated with lower executive functioning, including performance on tasks of WM, inhibition, and cognitive flexibility (Sarsour et al. 2011; Hackman et al. 2015; Rosen et al. 2018; Amso et al. 2019), and predicts less improvement in executive function ability over time, even after controlling for violence exposure (Rosen et al. 2020). Furthermore, low cognitive stimulation is associated with reductions in cortical thickness in the IPS and MFG, key nodes of the frontoparietal network that support WM (Rosen et al. 2018).
Though deprivation is proposed to have a more substantial influence on executive function development than threat, some have proposed that experiences of threat may also negatively influence WM performance through influences on prefrontal cortical development (Lupien et al. 2009). The association of threat with WM in youth is less consistent than deprivation, with some studies suggesting a negative association (DePrince et al. 2009; Vasilevski and Tucker 2016), while others observe null associations when accounting for co-occurring deprivation (Sarsour et al. 2011; Sheridan et al. 2017; Vogel et al. 2021). Indeed, a recent meta-analysis suggests that the effect size for the association of deprivation with WM is significantly greater and about twice as large than the association with threat, though experiences of threat still had small negative associations with WM (Johnson et al. 2021). Taken together, these findings provide support for low cognitive stimulation (i.e. greater cognitive deprivation), relative to other dimensions of environmental experience, as a candidate mechanism underlying SES-related differences in neural function supporting WM performance.
While SES has been associated with differences in brain structure and function in children in regions of the brain that support executive function (Noble et al. 2015; Finn et al. 2017; Sheridan et al. 2017; Rosen et al. 2018; Murtha et al. 2023), these associations are not limited to the frontoparietal network. Low SES is also consistently associated with reduced cortical thickness and surface area of the ventral visual stream (VVS; Noble et al. 2015; Mackey et al. 2015; Finn et al. 2017; Leonard et al. 2019; Rosen et al. 2018)—a set of brain regions involved in processing complex visual stimuli (Kanwisher et al. 1997; Grill-Spector et al. 2001)—and reduced recruitment of the VVS during higher-order cognitive tasks (Rosen et al. 2021). We have recently proposed that development of the VVS may be influenced by low cognitive stimulation in early life, especially in the context of caregiver interactions (Rosen et al. 2019). Because the VVS develops earlier than the PFC (Gogtay et al. 2004; Sowell et al. 2004), has feed-forward projections to PFC, and receives input through feedback connections from PFC (Gilbert and Li 2013), development of the VVS may play a critical role in scaffolding development of the PFC and associated executive functions (Amso and Scerif 2015). Therefore, lower levels of early cognitive stimulation common among low-SES families may influence development of the VVS which, in turn, may have downstream consequences for development of the PFC and associated executive functions, including WM (Rosen et al. 2019). Notably, SES-related differences in brain structure and function in the frontoparietal network and VVS may be at least partially explained by low levels of cognitive stimulation (Rosen et al. 2018, 2021).
The present longitudinal study tests one prediction of the broad hypothesis that deprivation and threat may differentially influence cognitive and neural function, contributing to the SES-achievement gap. Specifically, we test the prediction that experiences of deprivation, but not threat, contribute to SES-related reductions in WM performance and functional activation in the frontoparietal network and VVS during WM and that these cognitive and neural differences may underlie disparities in academic achievement. We examined these predictions in a sample of children followed from age 3 to 11 years, using family income in early life as a predictor of visuospatial WM performance, neural activation, and academic achievement in early adolescence. First, we hypothesized that SES, measured by family income, would be negatively associated with performance on a visuospatial WM task and with neural activation in the frontoparietal control network and VVS during WM. Second, we hypothesized that cognitive deprivation, but not experiences of violence, would also be negatively associated with WM performance and activation in the frontoparietal control network and VVS for high compared with low WM load and would mediate the association of low income with WM performance and neural activation. Finally, we hypothesized that WM performance and neural activation in these key regions would be positively associated with academic achievement. However, we observed no associations of WM or neural activation with academic achievement, and we present these analyses in the Supplemental Materials. Our hypotheses, methods, and analytic plan were preregistered on Open Science Framework: https://osf.io/bt32x/. We also note that we include both preregistered analyses investigating neural activation during high WM load compared with low WM as well as exploratory analyses of high WM load compared with baseline.
Method
Participants
Participants were drawn from a longitudinal study of children (n = 302) followed from age 3 and their mothers examining the effects of income on the development of effortful control (Lengua et al. 2015). Families were originally recruited from a university-hospital birth register, daycares, preschools, health clinics, and charitable agencies in the Seattle, Washington area with the aim of obtaining equal representation across the income spectrum. Exclusion criteria for enrollment in the study included diagnosis of a developmental disability and limited proficiency in English. Children were assessed at four time points between the ages of 3 and 5 (T1: 36–40 months, T2: 45–49 months, T3: 54–58 months, T4: 63–67 months). Neuroimaging was obtained for the first time during an assessment at ages 10–12 years old (T5; M = 11.64; SD = 0.513). Of the 226 children who participated in that assessment, 148 (68 females) completed a visuospatial WM fMRI task and had useable data (see fMRI Data Preprocessing). Exclusion criteria for participation in the scan included MRI contraindications and residence out of state. Participants’ race and ethnic background closely matched the demographics of the Seattle area (Asian: 8.8%; Black: 9.5%; Hispanic/Latinx: 11.5%; White: 68.2%; other: 2%). The Institutional Review Board at the University of Washington approved all study procedures. Caregivers provided written informed consent and children provided assent at every data collection time point.
Procedure
Families attended laboratory visits at T1–T4 during which caregivers reported on family income. At T5, participants completed an fMRI scan at the University of Washington’s Integrated Brain Imaging Center, during which they completed a visuospatial WM task. Caregivers reported on family income, children’s experiences of cognitive deprivation, exposure to violence, and academic performance. Children reported on their own lifetime experiences of violence in addition to the caregiver.
Measures
Family income
At T1–T4, caregivers reported total annual family income from all sources at T1–T4 by selecting one of 14 income ranges. The income ranges were smaller at lower incomes (e.g. $14,571–$18,310) than at higher incomes (e.g. $100,000–$150,000). Caregivers also reported on the number of people in their household. The income-to-needs ratio was calculated by dividing the mid-point of each income range by the federal by the census-defined federal poverty line for a family of that size. Because the data from this study were collected in the Seattle area, which has a higher-than-average cost of living in the United States, a dichotomous variable was created reflecting whether a family’s income-to-needs ratio was 1.5 or less (i.e. 0 = income-to-needs above 1.5 times the poverty line, 1 = income-to-needs at or below 1.5 times the poverty line). This threshold is widely used to reflect low income in epidemiological studies (e.g. Kessler et al. 2012; McLaughlin et al. 2012) and in prior publications from this sample (e.g. Lengua et al. 2015).
Three measures of family income were included. First, a dichotomous measure of early life low income was defined as having an income-to-needs ratio as <1.5 times the federal poverty line at age 3. Second, a continuous measure of the chronicity of low income was created reflecting the number of time points from age 3 to 5 years that the family’s income was 1.5 times the poverty line or less. Third, at T5, adolescent family income was assessed again using the income-to-needs ratio. Income-to-needs values were log-transformed for all analyses, which is commonly done in developmental samples, as there is often a positive skew in income and a stronger association between income-to-needs and cognitive outcomes at the lower end of the spectrum (Noble et al. 2015; Rosen et al. 2018; Rosen et al. 2019).
Cognitive deprivation
At the early adolescent assessment (T5), children’s experiences of cognitive deprivation were measured based on caregiver report on the Home Observation Measurement of the Environment—Short Form (HOME-SF; Mott 2004). This measure assesses numerous forms of cognitive stimulation, including the presence of learning materials in the home, the child’s engagement with activities outside the home, the degree of parent–child interaction, and parental involvement in their child’s learning. The HOME-SF items are scored dichotomously such that the presence of a stimulating activity or experience is coded as 1 and the absence is coded as 0. We created a cognitive deprivation measure based on items that have been used to measure cognitive stimulation in previous studies in our lab that included items from the HOME Interview (Rosen et al. 2020) and a more abridged version of the HOME-SF (Rosen et al. 2018). The items can be found in the Supplemental Materials. To create a cognitive deprivation measure, we created a binary score of the 19 cognitive stimulation items, such that the presence of each item reflecting cognitive stimulation was scored as 0 and the absence was scored as 1. We summed these items and then z-scored this score to create the cognitive deprivation variable. The measure had adequate consistency (Chronbach’s alpha = 0.54).
Experiences of threat
A multi-measure, multi-informant approach was used to assess children’s experiences of threat—namely the number of different types of violence the child experienced, frequency of violence exposure, and severity of those experiences. Experiences of physical abuse, sexual abuse, domestic violence, witnessing a violent crime, and being a victim of a violent crime were coded as different types of violence exposure and summed. Each exposure type was counted if it was endorsed by either the parent or child on the UCLA PTSD Reactions Index (PTSD-RI; Steinberg et al. 2013); physical abuse, sexual abuse, and domestic violence were additionally coded as present if they were endorsed by the child on the Child Experiences of Care and Abuse Interview (CECA; Bifulco et al. 2005). The frequency of violence exposure was coded using the summed child-reported frequency ratings of witnessed and experienced violence on the Violence Exposure Scale for Children-Revised (VEX-R; Raviv et al. 2001). Finally, the severity of physical and sexual abuse was coded using the sum of the child-reported Childhood Trauma Questionnaire Physical and Sexual Abuse subscales (Bernstein et al. 1997). To create the composite for threat, we standardized each of these three subscales (i.e. number of violence exposure types, frequency of violence exposure, and the severity of physical and sexual abuse) and then averaged them together. We have previously used this metric of violence exposure in another paper from our lab using the same sample (Weissman et al. 2022) and preregistered this approach for creating the threat composite: https://osf.io/bt32x/.
fMRI data acquisition
Scanning was performed on a 3 T Phillips Achieva scanner at the University of Washington Integrated Brain Imaging Center using a 32-channel sensitivity-encoding (SENSE) head coil. T1-weighted multi-echo MPRAGE volumes were acquired (TR: 2,530 ms, TE: 1.64–7.04 ms, flip angle: 7°, FOV: 256 mm2, 176 slices, in-plane voxel size: 1 mm3). Blood oxygenation level dependent (BOLD) signal during functional runs was acquired using a gradient-echo T2*-weighted EPI sequence. Thirty-two 3 mm thick slices were acquired parallel to the AC-PC line (TR: 2,000 ms, TE: 30 ms, flip angle: 90°, bandwidth: 2,300, echo spacing: 0.5, FOV: 256 × 256, matrix size: 64 × 64). Prior to each scan, four images were acquired and discarded to allow longitudinal magnetization to reach equilibrium.
Working memory task
Participants performed two runs of a WM task. The task consisted of two block types: low load and high load. For both conditions, there were nine possible target locations in a 3 × 3 grid (Supplemental Fig. 1). Trials began with a blank gray screen with a green border that indicated the participants should get ready for the next trial. In the low load condition, the participants viewed a gray screen in which a filled blue circle appeared at one of the nine possible locations (Cue period, 750 ms). The participants had been instructed to remember the location of the cue circle. This was followed by the Delay period (3,000 ms) in which nothing was presented on the screen. Then an open blue circle appeared during the Probe period (1,500 ms). On 50% of trials this open circle appeared at the same location as in the Cue phase and on the other 50% of trials it appeared in one of the other eight locations (with equal probability of appearing at any of those locations). Participants indicated if the probe appeared at the same location or a different location with a button press. This was followed by a 1,500 ms inter-trial interval before the beginning of the next trial. The high load condition was identical to the low load condition except that during the high load condition, participants saw three blue circles during the Cue phase and had to keep in mind the location of all three circles. During the Probe phase they were presented with 1 open circle and on 50% of trials, the circle appeared in one of the three locations from the Cue phase, while on the other 50% of trials, it appeared at one of the other six locations (with equal probability of appearing at any of those locations). There were five trials per block and three blocks of each type (high and low load) per run. There were additionally three blocks of fixation (15,000 ms) per run.
Working memory performance
Behavioral performance on the WM task was assessed using sensitivity index (d') which was calculated using the following formula:
A trial was considered a “hit” if the participant correctly indicated that the circle presented during the Probe appeared in one of the same locations as in the Cue phase. A trial was considered a “false alarm” if the participant indicated that the circle presented during the Probe appeared in one of the same locations as in the Cue phase, but it in fact appeared in a different location.
fMRI data preprocessing
Data preprocessing was performed in a pipeline using Make, a software development tool that can be used to create neuroimaging workflows that rely on multiple software packages (Askren et al. 2016). Preprocessing steps included motion correction with FSL MCFLIRT followed by slice-timing correction with FSL slicetimer (Jenkinson et al. 2012), despiking with AFNI 3dDespike, and spatial smoothing with FSL SUSAN using a 6 mm full-width half-max Gaussian kernel (Smith and Brady 1997) Nuisance regressors entered into individual-level models included six rigid-body motion parameters as well as timeseries extracted from white matter and ventricles to control for physiological noise. Outlier volumes in which framewise displacement exceeded 1 mm, the derivative of variance in BOLD signal across the brain (DVARS) exceeded the upper fence (above 75th percentile + 1.5 × interquartile range), or signal intensity was more than 3 SD from the mean were excluded by regressing these volumes out of individual-level models. We examined whether average framewise displacement was significantly associated with any variables of interest and that average framewise displacement was associated with early childhood low income (β = 0.169, p = 0.045), the chronicity of low income through early childhood (β = 0.2269, p = 0.008), and deprivation (β = 0.174, p = 0.036). We therefore include additional analyses in the Supplemental Materials that control for average framewise displacement at the individual subject level for analyses including these variables. Individual- and group-level models were estimated in FSL. Following estimation of the individual-level models, the resulting contrast images were registered to a custom study-specific template and then to standard MNI space. Anatomical co-registration of the functional data with each participant’s T1-weighted image and normalization were performed using Advance Normalization Tools (ANTs) (Avants et al. 2011).
To correct for multiple comparisons in whole brain analyses, AFNI’s 3dClustSim program was used to calculate an appropriate cluster size threshold within the gray matter mask. Recent simulations demonstrate elevated risk of false positives using standard cluster-level correction approaches (Eklund et al. 2016). Recent updates to AFNI’s 3dFWHMx and 3dClustSim utilize a spatial autocorrelation function (ACF), which more accurately estimates the spatial smoothness to reduce the risk of false positives. The ACF option in 3dFWHMx was used to estimate the spatial smoothness of residuals from the individual-level analyses. The average ACF was then be used with 3dClustSim to calculate the appropriate cluster size threshold with 10,000 Monte Carlo simulations. Based on output from these programs, a conservative voxel-wise threshold of p < 0.005 with a minimum cluster size of 256 voxels was used, to set the corrected family-wise error rate at 0.05. Sex and age were included as covariates.
Data exclusion
Of the 180 youth who completed the visuospatial WM task, 32 participants’ data were excluded completely, and 10 participants had one run excluded. Criteria for exclusion included functional runs that had greater than 20% high-motion time points, which was defined as 1 mm of framewise displacement or greater than 3 SDs above the mean of DVARS. Runs with below chance performance on the low-load condition for the WM task in the scanner were also excluded from all analyses. Twenty-two participants were excluded for below chance performance on the task and two participants were excluded for both below chance performance and exceeding motion thresholds. Six participants had one run excluded for exceeding motion thresholds, three participants had one run excluded because they fell asleep, and one participant did not attempt a second run. In addition, one subject was excluded for an incidental finding that indicated a major structural abnormality and one subject’s data were unusable due to a data storage error. Finally, after person-level analyses were completed, five subjects were excluded from group-level analyses due to significant signal dropout in the PFC related to dental implants.
Region of interest extraction
We extracted estimates for high load > low load contrasts in four preregistered bilateral regions of interest (ROIs) based on previous literature (Rosen et al. 2018). These include the IPS, MFG, lateral occipital cortex (LOC), and temporal-occipital fusiform gyrus. ROI analyses were conducted to examine associations of neural activation with family income, cognitive deprivation, performance on the task, and parent-reported achievement. ROIs were created by masking functional activation in the group average for correct trials of high WM load blocks compared with low WM load and intersecting this mask with an anatomical mask (20% threshold) from the Harvard-Oxford atlas in FSL. This produces an anatomical ROI that includes only task-active regions. Importantly, we used a mask based on recruitment across the whole sample to avoid double-dipping when investigating the association of activation with task performance (Vul et al. 2009). To ensure that the ROIs for the IPS and LOC, which are neighboring regions, did not overlap, we subtracted the LOC mask from the IPS mask. This resulted in two abutting, but not overlapping ROIs. We preregistered analyses using these ROIs and extracting activation during high load > low load. For exploratory analyses, we also extracted activation for high load > baseline from the same ROIs.
Analysis plan
Whole brain analyses
In addition to targeted ROI analyses described below, we conducted several whole brain analyses. First, we conducted separate whole brain group contrasts for high load > low load and high load > baseline with each measure of family income (early life low income, chronicity of early low income, and current income). Next, we conducted separate whole brain group contrasts for high load > low load WM and high load > baseline with cognitive deprivation and threat as continuous predictors. For completeness, we also conducted whole brain group contrasts for low load > baseline with family income, and cognitive deprivation, which are presented in the Supplemental Materials (Supplemental Fig. 4, Supplemental Table 10).
ROI analyses
In the present study, we examined whether cognitive deprivation was an environmental mechanism linking family income with WM performance and associated neural activation, controlling for threat. To do so, we tested the paths of a standard mediation model. First, we estimated a series of multivariate models examining each of our three measures of family income (early life low income, chronicity of early low income, and current income-to-needs) as predictors of performance on the WM task in early adolescence, using d' as the performance metric and neural activation in the four bilateral ROIs (fusiform, IPS, LOC, MFG) during high load > low load and high load > baseline (c paths). Next, we examined the association between each measure of family income with cognitive deprivation and threat composite (a paths). As a sensitivity analysis we also examined a continuous variable of early log income-to-needs ratio and present this in the Supplemental Materials (Supplemental Table 8). Next, we examined the associations of cognitive deprivation and threat with WM performance and activation in each of the four bilateral ROIs (b paths). Given that the experiences of deprivation and threat tend to be correlated with one another (Green et al. 2010; McLaughlin et al. 2012; Evans et al. 2013), we included both dimensions of experience in the same model to determine whether the patterns are robust to controlling for co-occurring experiences of adversity. The false discovery rate (FDR) procedure was used to correct for multiple comparisons at the level of hypothesis. For instance, we corrected for multiple comparisons across the three measures of family income in predicting activation in left and right region (six comparisons).
After testing each of these paths, we used a bootstrapping approach implemented in the PROCESS macro in SPSS (Hayes 2017) to estimate the indirect effects of deprivation experiences on the association of family income with WM performance and associated neural activation. We calculated bias-corrected confidence intervals for 10,000 bootstrapped samples. Intervals that do not contain zero are considered evidence of a statistically significant indirect effect. All models controlled for children’s age at the time of the scan and sex.
Results
Descriptive statistics are presented in Supplemental Table 1. Bivariate correlations between all study variables are presented in Supplemental Table 2.
Family income, cognitive deprivation, threat, and working memory performance
Sensitivity to detecting the target for low load WM was higher than for high load WM trials (t(147) = −11.21, p < 0.001). Contrary to our hypotheses, we did not find a significant association between early life low income and WM performance across both trial types (β = −0.044, p = 0.600; β = 0.021, p = 0.804 for high and low load, respectively), chronicity of early life low income (β = −0.031, p = 0.719; β = 0.030, p = 0.731 for high and low load, respectively), and adolescent family income (β = −0.0760, p = 0.364; β = −0.046, p = 0.584 for high and low load, respectively). Similarly, multiple regression including cognitive deprivation and threat in the same model did not reveal any significant associations between either type of experience with WM performance on high (β = −0.0739, p= 0.376; β = −0.0156, p = 0.853, respectively) or low load (β = −0.0161, p = 0.846; β = −0.0878, p = 0.296, respectively).
Task main effects: working memory during high load
To examine task-related BOLD activation, we first performed a whole brain analysis across the entire sample of high WM load compared with baseline as well as low load. The contrast of high load > low load demonstrated widespread activation across the frontoparietal network and VVS including the IPS, superior parietal lobule, lateral frontal cortex, LOC, and ventral temporal cortex (VTC), as well as deactivation in the default mode network including the angular gyrus, precuneus, and dorsal medial PFC (Fig. 1A, Supplemental Table 3). The contrast of high load > baseline revealed a similar pattern of activation, but was more widespread (Fig. 1B, Supplemental Table 4).
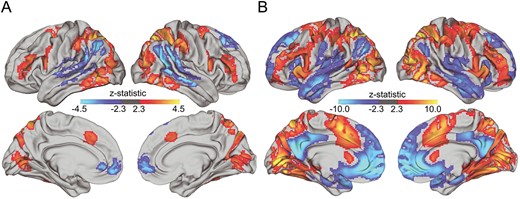
Neural activation during high load vs. (A) low load WM and (B) vs. baseline. Analyses control for age and sex.
Family income and neural activation
We then examined whole brain models with all three measures of family income as a predictor for the contrasts of high load > low load and high load > baseline.
Whole brain high load vs. low load. We found no significant associations for either of our measures of early life income (early low income or chronicity of early low income) with whole brain neural activation for high load vs. low load. In contrast, we found several significant clusters reflecting a positive association between neural activation and adolescent family income such that children with higher adolescent family income showed greater recruitment of the left LOC, bilateral presupplementary motor area (preSMA), and bilateral VTC including the fusiform and parahippocampal cortices (Fig. 2C, Supplemental Table 5).
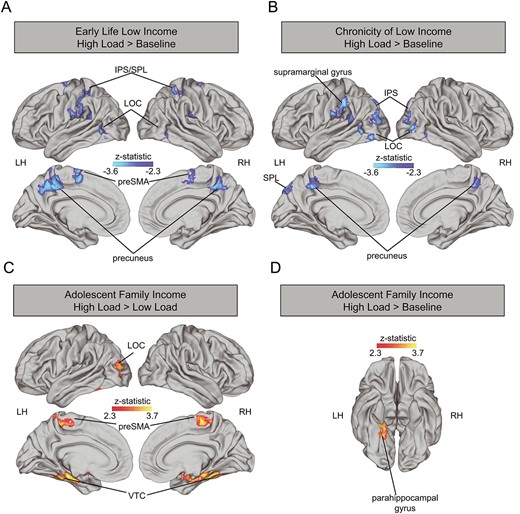
Association early childhood income (A), chronicity of low income (B) and adolescent log income-to-needs ratio (D) and neural activation during high load vs. baseline and between adolescent log income-to-needs ratio and neural activation during high load vs. low load (C). Analyses control for age and sex. LH: left hemisphere, RH: right hemisphere, IPS: intraparietal sulcus, SPL: superior parietal lobe, LOC: lateral occipital cortex, VTC: ventral temporal cortex, PreSMA: presupplementary motor area.
Whole brain high load vs. baseline. Several significant clusters emerged for the association of early low income and the contrast of high load vs. baseline such that children who experienced early low income showed reduced activation in these regions for this contrast. These include bilateral LOC, bilateral IPS, bilateral supramarginal gyrus, and bilateral preSMA (Fig. 2A, Supplemental Table 5). Similarly, chronicity of early low income was associated with reduced activation in bilateral LOC, bilateral IPS, bilateral precuneus, left supramarginal gyrus, and left superior parietal lobule (Fig. 2B, Supplemental Table 5). Adolescent family income was associated with greater activation in the left parahippocampal gyrus in the contrast of high load > baseline (Fig. 2D, Supplemental Table 5).
Region of interest analysis. To directly test the hypothesis that family income is associated with activation in the frontoparietal network and VVS during high compared with low WM load, we examined the four pre-defined ROIs for high load > low load (preregistered, Table 1) and high load > baseline (exploratory, Table 2).
Associations between three measures of family income and neural activation in ROIs during high WM load vs. low WM load.
| Early low income | Chronicity of low income | Current log income-to-needs | ||||
|---|---|---|---|---|---|---|
| ROI | β | p | β | p | β | p |
| L LOC | −0.181 | 0.044 | −0.202 | 0.034 | 0.210 | 0.032 |
| R LOC | −0.139 | 0.096 | −0.167 | 0.060 | 0.228 | 0.032 |
| L IPS | −0.157 | 0.117 | −0.180 | 0.118 | 0.152 | 0.118 |
| R IPS | −0.125 | 0.130 | −0.148 | 0.118 | 0.131 | 0.129 |
| L Fus | −0.027 | 0.756 | −0.071 | 0.755 | 0.223 | 0.023 |
| R Fus | −0.031 | 0.756 | −0.059 | 0.755 | 0.223 | 0.023 |
| L MFG | −0.045 | 0.589 | −0.081 | 0.589 | 0.054 | 0.589 |
| R MFG | −0.052 | 0.589 | −0.088 | 0.589 | 0.104 | 0.589 |
L: left, R: right, LOC: lateral occipital cortex, IPS: intraparietal sulcus, Fus: fusiform cortex, MFG: middle frontal gyrus. All analyses control for age and sex. Results are FDR corrected. Significant associations appear in BOLD and marginally significant associations appear in italics.
Associations between three measures of family income and neural activation in ROIs during high WM load vs. baseline.
| Early low income | Chronicity of low income | Current log income-to-needs | ||||
|---|---|---|---|---|---|---|
| ROI | β | p | β | p | β | p |
| L LOC | −0.262 | 0.003 | −0.323 | 0.0007 | 0.174 | 0.037 |
| R LOC | −0.237 | 0.007 | −0.282 | 0.003 | 0.174 | 0.037 |
| L IPS | −0.243 | 0.008 | −0.308 | 0.002 | 0.150 | 0.090 |
| R IPS | −0.219 | 0.013 | −0.269 | 0.005 | 0.135 | 0.105 |
| L Fus | −0.080 | 0.348 | −0.159 | 0.124 | 0.116 | 0.202 |
| R Fus | −0.157 | 0.124 | −0.162 | 0.124 | 0.146 | 0.124 |
| L MFG | −0.162 | 0.259 | −0.149 | 0.259 | 0.029 | 0.734 |
| R MFG | −0.124 | 0.279 | −0.086 | 0.478 | 0.030 | 0.734 |
L: left, R: right, LOC: lateral occipital cortex, IPS: intraparietal sulcus, Fus: fusiform cortex, MFG: middle frontal gyrus. All analyses control for age and sex. Results are FDR corrected. Significant associations appear in BOLD and marginally significant associations appear in italics.
High load > low load. Consistent with our predictions, we found a significant negative association between early low income and activation in the left LOC such that children who experienced early life low income showed reduced activation in this region, and a trend in the same direction for the right LOC. Similarly, we found a negative association between chronicity of early low income and activation in the left LOC and a trend in the same direction for the right LOC. Furthermore, we found a significant positive association with adolescent family income and activation in the left and right LOC as well as the left and right fusiform (Fig. 3, Table 1). No other significant associations were found for any other ROIs. The association between early life low income and the chronicity of early life low income with left LOC activation was no longer significant when covarying for average framewise displacement (p > 0.1, Supplemental Table 6).
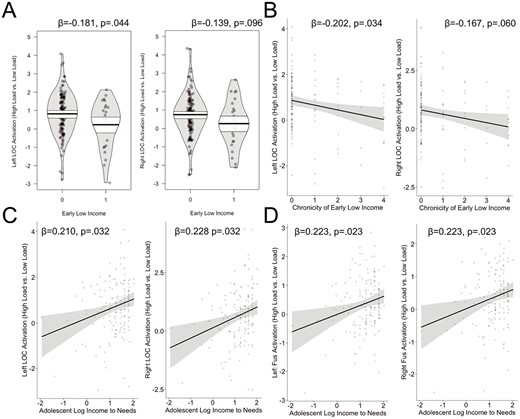
Association between family income and neural activation (high load vs. low load) for early life low income and LOC (A), chronicity of low income and LOC (B), adolescent family income and LOC (C), and fusiform (Fus; D). Analyses controlled for age and sex.
High load > baseline. For the contrast of high load vs. baseline, we found a significant negative association between early life low income and activation in left and right LOC and left and right IPS. We also find the same significant associations between activation in bilateral LOC and IPS with chronicity of early life low income. Similarly, we find a positive association between adolescent family income and activation in bilateral LOC and a trend toward a positive association in the left IPS (Fig. 4, Table 2). No other significant associations were found for any other ROI. The negative associations between early life low income and the chronicity of early life low income and activation in the left and right LOC and IPS remained significant after covarying for average framewise displacement and correction for multiple comparisons (Supplemental Table 7).
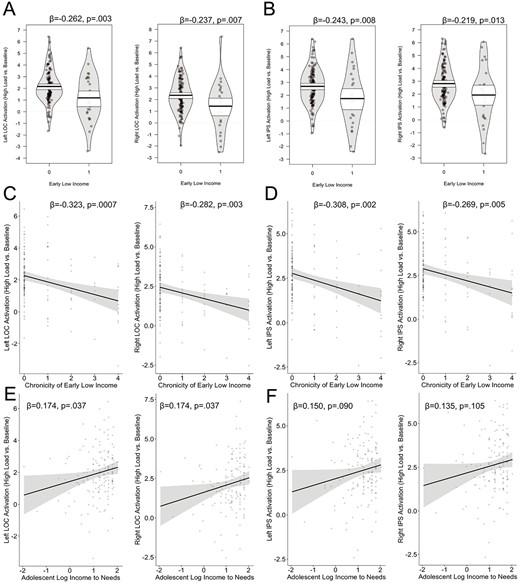
Association between family income and neural activation (high load vs. baseline) for early life low income and LOC (A) and IPS (B), chronicity of early low income and LOC(C) and IPS (D) and current log income-to-needs and LOC (E) and IPS (F). Analyses controlled for age and sex.
Cognitive deprivation, threat, and neural activation
Whole brain analyses. Whole brain models during high > low WM load revealed no clusters with significant associations of cognitive deprivation or threat with neural activation. The contrast between high WM load and baseline, however, revealed a significant positive association between cognitive deprivation and activation in the paracingulate gyrus/superior frontal gyrus (SFG) (Fig. 5A; x = −4, y = 48, z = 38, max z-statistic = 3.591, 419 voxels) such that youth who experienced more cognitive deprivation had more activation in these regions. Interestingly, we also observed a negative association between threat and activation in a neighboring cluster in the frontal pole/SFG (Fig. 5B; x = 24, y = 48, z = 42 max, z-statistic = 4.4726, 590 voxels) as well as the right caudate (x = 10, y = 4, z = 16, max z-statistic = 3.591, 419 voxels) such that youths who experienced greater threat demonstrated less activation in these regions.
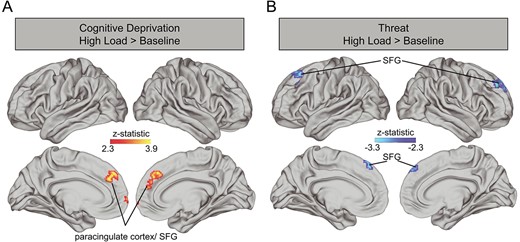
Associations between cognitive deprivation (A) and threat (B) with neural activation during high load WM vs. baseline. Cognitive deprivation and threat were included in the same model with covariates for age and sex. SFG: superior frontal gyrus.
We next tested whether cognitive deprivation was associated with activation in the frontoparietal network or VVS. Multiple regression revealed no significant associations between cognitive deprivation and activation in any of the ROIs (ps > 0.4) for high > low WM load when covarying for threat (Table 3). There was one significant negative association between threat and activation in the left fusiform gyrus (p = 0.005), but no associations in the other ROIs during high > low load (ps > 0.18). In contrast, cognitive deprivation was negatively associated with activation in left and right LOC and left and right IPS (all ps < 0.02) during high WM load compared with baseline (Table 3; Fig. 6). There were no significant associations between threat and activation in any of the ROIs (ps > 0.19) for high load > baseline. Due to the significant association between deprivation and average framewise displacement, we present estimates for the association between deprivation and neural activation during high load vs. baseline covarying for framewise displacement in the supplement (Supplemental Table 9). Importantly, we continued to observe significant negative associations of deprivation with activation in the left and right LOC and the right IPS (ps < 0.05). However, after covarying for motion and correction for multiple comparisons, the association is trend level for the left IPS (p = 0.052).
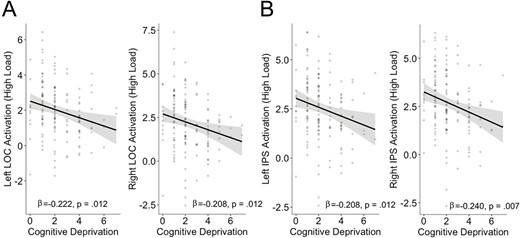
Association between cognitive deprivation with neural activation during high load WM vs. baseline in (A) LOC and (B) IPS. Analyses controlled for age, sex, and experiences of threat.
Associations between cognitive deprivation and threat with neural activation in ROIs during high WM load vs. low WM load (left-hand side) and vs. baseline (right-hand side).
| High load vs. low | High load vs. baseline | |||||||
|---|---|---|---|---|---|---|---|---|
| ROI | Deprivation | Threat | Deprivation | Threat | ||||
| β | p | β | p | β | p | β | p | |
| L LOC | −0.010 | 0.450 | −0.043 | 0.609 | −0.222 | 0.012 | 0.002 | 0.980 |
| R LOC | −0.029 | 0.725 | −0.086 | 0.609 | −0.208 | 0.012 | −0.010 | 0.980 |
| L IPS | −0.050 | 0.540 | −0.124 | 0.180 | −0.208 | 0.012 | −0.074 | 0.652 |
| R IPS | −0.078 | 0.540 | −0.110 | 0.180 | −0.240 | 0.007 | −0.037 | 0.652 |
| L Fus | −0.060 | 0.477 | −0.007 | 0.939 | −0.094 | 0.265 | 0.068 | 0.425 |
| R Fus | −0.072 | 0.477 | −0.053 | 0.939 | 0.138 | 0.199 | −0.012 | 0.883 |
| L MFG | 0.064 | 0.701 | −0.087 | 0.241 | −0.021 | 0.799 | −0.028 | 0.739 |
| R MFG | −0.031 | 0.701 | −0.245 | 0.005 | −0.037 | 0.799 | −0.084 | 0.315 |
L: left, R: right, LOC: lateral occipital cortex, IPS: intraparietal sulcus, Fus: fusiform cortex, MFG: middle frontal gyrus. Significant associations appear in BOLD and marginally significant associations appear in italics.
Mediation: early life low income, cognitive deprivation, and neural activation
We next tested the hypothesis that cognitive deprivation mediates the association between early life low income, chronicity of low income, and adolescent family income with neural activation during WM (Table 4). We found significant indirect effects of early life low income on neural activation during high load > baseline through cognitive deprivation in left and right LOC and left and right IPS. We also found a significant indirect effect of adolescent family income on activation in left and right LOC through cognitive deprivation. The indirect effect of chronicity of early life low income on neural activation through cognitive deprivation was not significant for the LOC or IPS.
Cognitive deprivation as a mediator of the association between family income and neural activation.
| Early low income | Chronicity of low income | Current log income-to-needs | |
|---|---|---|---|
| ROI | 95% CI | 95% CI | 95% CI |
| L LOC | −.4075 to −.0342 | −0.1392 to 0.0334 | .0278 to .3431 |
| R LOC | −.3840 to −.0394 | −0.1626 to 0.0133 | .0199 to .3291 |
| L IPS | −.4087 to −.0197 | −0.1745 to 0.0217 | |
| R IPS | −.4520 to −.0476 | −0.2027 to 0.0008 |
95% confidence intervals are presented for models with significant a, b, and c paths. Significantly mediated effects do not include 0 and are presented in BOLD.
Discussion
The present study examined experiences of cognitive deprivation as a potential mechanism underlying the association between childhood family income and neural activation during WM. Here we replicate previous findings supporting the association between childhood family income and functional differences in the frontoparietal control network and VVS during WM (Finn et al. 2017; Murtha et al. 2023; Rosen et al. 2018; Sheridan et al. 2017). We observed similar patterns of reduced activation in the IPS and LOC during WM related to low cognitive stimulation as to early childhood low income and early chronicity of low income, and adolescent family income in the LOC. Cognitive deprivation was also associated with elevated PFC activation during WM. Moreover, experiences of cognitive deprivation mediated the association between low income in early childhood and reduced activation in the LOC and IPS during WM. Similarly, we found that cognitive deprivation mediated the association between adolescent family income and activation in bilateral LOC. Interestingly, while not predicted, we observed a negative association between experiences of threat and activation in the PFC as well. Contrary to our predictions and to prior research, we did not observe associations of family income with WM performance (Noble et al. 2007; Hackman et al. 2014; Vogel et al. 2021; Murtha et al. 2023) or associations between cognitive deprivation and WM performance (Amso et al. 2019; Hackman et al. 2015; Rosen et al. 2020; Sarsour et al. 2011; Obradović et al. 2016). Taken together, these findings support the importance of childhood cognitive stimulation—including caregiver involvement in children’s learning, access to educational resources, a wide variety of experiences with caregivers, and complex language experiences—as a mechanism underlying SES-related differences in neural activation during WM.
The present study replicates findings supporting the association between childhood family income and neural activation in the frontoparietal network. Previous studies have also observed less activation in the precuneus, IPS, and visual processing regions related to low SES (Finn et al. 2017; Rosen et al. 2018; Murtha et al. 2023). Importantly, here we highlight consistent associations between three distinct measures of childhood family income (early low income, chronicity of early low income, and family income during early adolescence) and neural activity. Here we find consistency across the three measures of family income, with the strongest associations existing with early childhood low income. Indeed, prior research demonstrates the strength of the association between low SES in early life and executive functioning later in childhood, even when accounting for more proximal SES measures (Duncan et al. 1998; Hackman et al. 2015; Deer et al. 2020). Other studies suggest that the association of SES with executive function development is consistent from early childhood through adolescence (Hughes et al. 2010; Hackman et al. 2014, 2015), and perhaps into adulthood (Last et al. 2018; Evans et al. 2021). The present study adds to this growing body of research by demonstrating that patterns of adolescent neural activation are related to both early family income and adolescent family income.
Experiences of cognitive deprivation and threat may explain, in part, the association between childhood SES and neural activation during WM. Here, we observed that greater cognitive deprivation (i.e. lower stimulation) was associated with greater activation in the SFG and lower activation in the IPS and LOC during WM. This pattern of activation in the IPS and LOC mirrors that of children who experienced higher family income-to-needs ratio during early childhood in this study. This pattern of higher activation in both lateral and medial PFC regions and lower activation in superior parietal regions during high WM load among children with greater cognitive deprivation is reminiscent of activation displayed in younger children. Relative to adolescents and adults, children demonstrate less activation in the superior parietal cortex (Crone et al. 2006; Satterthwaite et al. 2013) and may also rely on more diffuse prefrontal regions to successfully perform WM tasks (Geier et al. 2009; Kharitonova et al. 2015). Early childhood experiences of low cognitive stimulation may therefore alter functional maturation of the superior parietal cortex and increase compensatory activation in prefrontal regions during WM to maintain and manipulate information. Differences in SES and deprivation-related patterns of activation during WM could also underlie different strategies adapted to meet demands of different environments. Moreover, cognitive stimulation mediated the association between early childhood low income and adolescent income with activation in the VVS and between early low income and activation in frontoparietal network. Our findings are consistent with theories that propose cognitive stimulation scaffolds the development of complex cognitive function, including WM, through its effects on the functional development of the frontoparietal network and VVS (Hackman et al. 2010; McLaughlin, Sheridan, Lambert, 2014; McLaughlin, Sheridan, Winter, et al. 2014; Johnson et al. 2016; Rosen et al. 2019). Complex and varied learning experiences guided by a responsive caregiver may provide opportunities for children to practice WM skills, as well as build up the attentional and perceptual capacities that underlie these skills.
Children living in low income environments have fewer opportunities to experience cognitive stimulation (Hart and Risley 1995;Hackman et al. 2015 ; Rosen et al. 2020), likely due to added constraints on caregivers’ time and material resources. It is important to acknowledge the institutional barriers that contribute to this disparity. Caregivers experiencing low SES are more likely to work multiple low-wage jobs that have less flexible hours and interfere with caregiving responsibilities (Morris and Levine Coley 2004; Dodson and Luttrell 2011; Jacobs et al. 2016). Lower financial resources make it more difficult for families to afford high quality childcare, educational materials, and leisure activities that contribute to a greater variety of experiences. Our findings highlight the importance of a multifaceted approach to addressing the neurodevelopmental consequences of poverty, not only by changing environmental experience, but also by relieving the conditions of poverty itself, for example through direct cash transfers (Troller-Renfree et al. 2022) or policies that provide financial resources to families with low income (Weissman et al. 2023).
Though we did not predict threat-related differences in neural activation during WM, we observed that greater threat experiences were associated with less activation in the SFG and left fusiform gyrus during high load WM. Notably, activation in the SFG was neighboring, but not overlapping, with prefrontal regions that associated with experiences of cognitive deprivation and the negative associations of threat with prefrontal recruitment were in the opposite direction of associations with deprivation, which were positive. We have proposed that violence exposure may be related to WM performance specifically in emotionally salient contexts. For example, children exposed to violence had better WM for angry faces relative to happy or neutral faces compared with children without violence exposure, which was explained, in part, by reduced activation in left MFG (Jenness et al. 2018). These findings suggest that, as distinct dimensions of adverse childhood experiences, deprivation and threat may have different patterns of association with frontoparietal network development. The WM paradigm in the present study tested “cold,” non-emotional cognitive skills (i.e. the location of circles in space). Thus, the association between threat and decreased neural activation in the SFG and fusiform is not readily explained by the present study’s theoretical framework (e.g. McLaughlin et al. 2016; Sheridan and McLaughlin 2014), although they are compatible with recent meta-analytic work demonstrating small negative associations of threat with WM performance and moderate negative associations of deprivation with WM (Johnson et al. 2021). Further empirical inquiry is necessary to differentiate threat-related mechanisms contributing to alterations in neural activation during “cold” WM performance.
Contrary to our predictions, we did not observe associations between family income-to-needs ratio, cognitive stimulation, or threat with WM performance. There are well-established associations of SES with WM performance (Noble et al. 2005, 2007; Raver et al. 2013; Hackman et al. 2014, 2015; Rosen et al. 2020; Vogel et al. 2021). Indeed, a meta-analysis estimated a small to medium effect size of the association between SES and executive function, including WM (Lawson et al. 2018). Emerging evidence also supports a consistent association between cognitive stimulation and WM (Hackman et al. 2015; Rosen et al. 2020; Vogel et al. 2021). There are several possible explanations for this discrepancy between the present study and the literature. First, it is possible that we were underpowered to find such an effect. Second, it is possible that the type of WM task affected our results. Many of the previous studies that show an association between SES and WM use either a digit or word span task (Hackman et al. 2015; Rosen et al. 2020) or an n-back (Finn et al. 2017; Murtha et al. 2023), while the present study used a spatial WM task. However, others have observed associations of SES with visuospatial WM (Noble et al. 2007; Hackman et al. 2014) administered outside the scanner or in older neuroimaging samples than the present study (Sheridan et al. 2017). Children are especially susceptible to task performance degradation in scanner environments (Church et al. 2010), which may have masked individual differences in WM performance related to childhood family income or adversity. The present study is limited in that there were no additional WM assessments administered outside the scanner to compare with the tasks analyzed here. Future work will be needed to determine whether SES effects vary by different WM tasks as well as by laboratory vs. MRI environment in early adolescents.
Similarly, we did not observe predicted association of family income, cognitive deprivation or WM performance with academic achievement. Again, there are well-established associations of SES and executive function with academic achievement (Brooks-Gunn and Duncan 1997; Blair and Razza 2007; Blair and Diamond 2008; Best et al. 2011; Ahmed et al. 2019). In contrast to the existing literature, the present study relied on caregiver report of children’s academic achievement rather than direct measures, such as academic transcripts or achievement testing scores. We did so as the children in this study came from a wide range of different schools and school districts, making grade comparisons challenging, and were tested at an age when standardized state-based tests were not administered. Direct measures of children’s academic achievement may be warranted to further examine developmental consequences of adversity-related alterations in neural function during WM.
The present study has several notable strengths including a longitudinal design, a large pediatric neuroimaging sample, and rich assessment of childhood environmental experience. However, the findings described here should be interpreted with several limitations in mind. While we preregistered hypotheses examining associations between family income-to-needs ratio, cognitive stimulation, and threat with neural activation during high load > low load WM, we included exploratory analyses examining neural activation during high load > baseline. We acknowledge that it is uncommon in the literature to contrast neural activation during WM to implicit baseline and this contrast may include more noise and thus limit the interpretation of our findings. It is important to note that we observed more individual differences in neural activation of high load compared with implicit baseline than when compared with low load. This may be because youths who experience low family income and deprivation demonstrated altered neural activity in these regions during WM even at a low load. Second, while the sample size in the present study is substantially larger than previous studies examining childhood adversity and neural activation supporting WM (e.g. Finn et al. 2017; Sheridan et al. 2017; Rosen et al. 2018), it is still likely underpowered to detect small effects. In addition, these data were collected in the Seattle area which has an overall higher cost of living than many other places in the United States and has higher level of school resources than more rural parts of the state and country. Understanding how associations between SES, cognitive stimulation, WM, neural function, and academic outcomes vary across rural vs. urban environments is an important avenue for future research. Future work could leverage large national neurodevelopmental samples, such as the Adolescent Brain Cognitive Development (ABCD) Study (Bjork et al. 2017), to further elucidate associations between early experience and the neural bases of WM with larger sample and more geographic variability.
Because our study included just one neuroimaging time point, we are limited in our ability to address how these systems change over time. Longitudinal studies that include multiple time points across early, middle, and late childhood could illuminate how and whether these associations change across development. The ABCD study could be used to address portions of these questions for late childhood and adolescence, while the HEALthy Brain and Child Development (HBCD) Study should be used to address these questions beginning in infancy.
In addition, though we completed in-depth assessments of cognitive stimulation and threat, they were not completed until early adolescence. Given difficulties with retrospective recall, we are unable to account for the effect of the developmental timing of deprivation and threat experiences on neural processes supporting WM performance, particularly in early childhood when they may be most impactful (McLaughlin and Gabard-Durnam 2022). Furthermore, while a parent report measure of cognitive stimulation using the HOME-Short Form has been widely used and validated (Mott 2004), the original version of the Home Observation Measurement of the Environment includes both an interview and observations by the experimenter in the home. This type of assessment may have provided a richer assessment of the environment. Finally, this study focused on cognitive stimulation in the context of caregiver interactions, but development of the VVS may additionally be impacted by the complexity of the visual environment early in life. Future studies should assess the role of visual and other sensorimotor stimulation in the development of the VVS and PFC.
Despite the above limitations, the present study makes several novel contributions to existing literature. To our knowledge, only one other study has investigated the association between normative variation in cognitive deprivation and neural activation during WM (Rosen et al. 2018), and the sample size of the present study is three times larger than the sample size of that study. Moreover, the present study is the first to our knowledge to explore the associations between both threat and deprivation as mechanisms linking SES with neural function supporting working memory in the frontoparietal network and the VVS.
Conclusions
This study suggests that low levels of cognitive stimulation—including lack of caregiver involvement in children’s learning, lack of access to educational resources, reduced variety of experiences, and reduced language exposure—may explain, in part, well-established SES-related alterations in neural activation during WM in children and adolescents. Interestingly, experiences of threat may also have distinct associations with neural activation during WM, which warrant further investigation to elucidate contributing mechanisms. Unexpectedly, we did not find significant associations between family income or cognitive deprivation and WM performance that have been found in numerous previous studies. In the absence of these behavioral differences, the neural differences found here should be interpreted with caution and followed up by additional studies with additional measures of WM. This study adds to a growing body of literature underscoring the importance of early childhood experiences in shaping later neural outcomes. Cognitive deprivation is a malleable environmental factor that could be targeted by early childhood interventions to strengthen the development of neural systems supporting higher-order cognitive skills, like WM.
CRediT author statement
Lucy A. Lurie (Data Curation, Formal Analysis, Investigation, Writing—original draft, Writing—review & editing), Maya L. Rosen (Conceptualization, Data Curation, Formal Analysis, Visualization, Writing—original draft, Writing—review & editing), David G. Weissman (Data Curation, Formal Analysis, Writing—review & editing) Laura Machlin (Resources, Writing—review & editing) Lilliana Lengua (Conceptualization, Writing—review & editing) Margaret A. Sheridan (Conceptualization, Writing—review & editing) Katie A. McLaughlin (Conceptualization, Data Curation, Funding Acquisition, Methodology, Project Administration, Supervision, Writing—review & editing)
Conflict of interest statement: None declared.
Data availability
The data underlying this article will be shared on reasonable request to the corresponding author (M.L.R).
References
Author notes
Lucy A. Lurie and Maya L. Rosen contributed equally to this work.