


Abstract
Hemiparesis after stroke is associated with increased neural activity not only in the lesioned but also in the contralesional hemisphere. While most studies have focused on the role of contralesional primary motor cortex (M1) activity for motor performance, data on other areas within the unaffected hemisphere are scarce, especially early after stroke. We here combined functional magnetic resonance imaging (fMRI) and transcranial magnetic stimulation (TMS) to elucidate the contribution of contralesional M1, dorsal premotor cortex (dPMC), and anterior intraparietal sulcus (aIPS) for the stroke-affected hand within the first 10 days after stroke. We used “online” TMS to interfere with neural activity at subject-specific fMRI coordinates while recording 3D movement kinematics. Interfering with aIPS activity improved tapping performance in patients, but not healthy controls, suggesting a maladaptive role of this region early poststroke. Analyzing effective connectivity parameters using a Lasso prediction model revealed that behavioral TMS effects were predicted by the coupling of the stimulated aIPS with dPMC and ipsilesional M1. In conclusion, we found a strong link between patterns of frontoparietal connectivity and TMS effects, indicating a detrimental influence of the contralesional aIPS on motor performance early after stroke.
Introduction
Focal brain lesions after stroke result in altered neural activity not only in the damaged hemisphere but also in remote regions connected to the lesion (Monakow 1914; Feeney and Baron 1986; Grefkes and Fink, 2020). In 1914, Constantin von Monakow coined the concept of diaschisis, assuming that at least parts of the clinical symptoms result from compromised functionality between interconnected brain regions. The advent of functional neuroimaging has substantiated this theoretical framework by identifying abnormal brain activation and connectivity in relation to clinical deficits after stroke (Grefkes and Fink 2014). One frequent observation in stroke patients suffering from hemiparesis is a marked increase in neural activity during movements of the paretic hand in areas of the frontoparietal network, especially in primary motor cortex (M1), dorsolateral premotor cortex (dPMC), and anterior intraparietal sulcus (aIPS) of the contralesional hemisphere (Ward et al. 2003; Gerloff et al. 2006; Grefkes, Nowak et al. 2008; Rehme et al. 2012; Buetefisch 2015), emerging within the first days after stroke (Rehme, Fink et al. 2011). The neural underpinnings of this increased contralesional activity remain controversial. According to the vicariation theory, intact brain regions from the contralesional hemisphere compensate for the ischemia-induced loss of brain tissue in the lesioned hemisphere and thereby support motor recovery (Wiesendanger 2006; Finger 2009). In contrast, the model of interhemispheric competition proposes that reduced inhibitory output of the lesioned hemisphere results in an increased interhemispheric inhibition from contralesional M1, allowing maladaptive influences to impede motor recovery (Murase et al. 2004; Hummel and Cohen 2006; Nowak et al. 2009; Hinder 2012).
Furthering our pathophysiological understanding of contralesional motor activity may not only help to resolve these opposing theories but seems critical to develop novel therapeutic approaches using noninvasive brain stimulation (Hummel and Cohen 2006; Grefkes and Fink 2012; Volz and Grefkes 2016). Importantly, most data on interhemispheric interactions after stroke stem from the chronic poststroke phase (Adeyemo et al. 2012; Hsu et al. 2012; Hao et al. 2013; Bates and Rodger 2015; Grefkes and Fink 2016). Yet, a crucial factor in stroke recovery is time (Kwakkel et al. 2006; Langhorne et al. 2011; Buma et al. 2013). Enhanced neural plasticity is primarily observed within the first days and weeks after stroke (Coleman et al. 2017) and then returns to normal levels, leading to relatively stable, i.e., chronic deficits with only very weak potential to spontaneously improve. The longitudinal assessment of connectivity data from the acute to the chronic phase after stroke has demonstrated a disinhibition of contralesional M1 already within 3 days after stroke (Rehme et al. 2011a), indicating that the roles of contralesional motor regions may develop through early changes of interhemispheric connectivity. Consequently, recent noninvasive neuromodulatory approaches target the acute and subacute phase after stroke to optimize the outcome of rehabilitation (Grefkes and Fink 2016; Volz et al. 2016). Besides M1, activation in the contralesional dPMC and the superior parietal lobe have been shown to be involved in motor recovery 3 months after stroke (Lotze et al. 2006); yet, the role of activation in these regions has not been examined in the first days after stroke. Given that contralesional M1, aIPS and dPMC show altered activation already 1 week after stroke (Rehme et al. 2011b), a more detailed understanding of network mechanisms and regional contributions to motor recovery is critical to advance future therapeutic approaches. In the past years, predictive models have been successfully used to link brain network configurations with behavioral outcomes, allowing innovative approaches of personalized clinical applications (Eickhoff and Langner 2019).
Hence, the present study assessed the role of an extended motor network in the contralesional hemisphere including M1, dPMC, and aIPS in the first days after stroke for motor recovery. We used functional MRI to assess cortical activity in first-ever stroke patients performing a finger-tapping task with their affected hand. We then specifically interfered with the neural activity of contralesional M1, dPMC, and aIPS applying bursts of transcranial magnetic stimulation during movement execution (online repetitive transcranial magnetic stimulation, rTMS; Tscherpel, Hensel, Lemberg, Freytag et al. 2020; Tscherpel, Hensel, Lemberg, Vollmer et al. 2020). The effects of online rTMS on motor performance were then explained by dynamic causal modeling (DCM) of frontoparietal connectivity in combination with a regularized multiple regression using the least absolute shrinkage and selection operator (Lasso). We hypothesized that TMS interference effects are linked to the interhemispheric coupling of the stimulated region in the contralesional hemisphere with key motor areas of the lesioned hemisphere, given the likely role of network alterations for early motor recovery (Rehme, Eickhoff et al. 2011).
Materials and Methods
Participants
Fourteen acutely hospitalized first-ever stroke patients with mild to moderate unilateral motor deficits were initially recruited from the Stroke Unit of the Department of Neurology, University Hospital Cologne. Inclusion criteria were: (1) 40 to 90 years of age, (2) first-ever ischemic stroke verified by MRI, (3) <10 days from symptom onset, (4) unilateral hand motor deficit, and (5) absence of aphasia, apraxia, or neglect.
Exclusion criteria were (1) contraindications to TMS, (2) contraindications to MRI, (3) cerebral bleeding, (4) infarcts in both hemispheres, and (5) inability to perform the motor task. One patient had to be excluded, being unable to perform the motor task inside the scanner due severe hand paresis. Thus, data from 13 patients (11 males, mean age 65.7 ± (SD) 11.7, 4.5 ± 2.6 days post stroke, two left-handed individuals) were used for the final analysis (Table 1). Furthermore, 13 age-matched healthy participants (10 males, mean age 66.2 ± 8.0, one left-handed individual) without neurological or psychiatric disease served as a healthy control group.
Sample characteristics
| Stroke patients | Healthy controls | P (t-test) | df3 | T4 | P (χ2-test) | |
|---|---|---|---|---|---|---|
| Age [years] | 65.7 ± 12.1 | 66.2 ± 8.0 | 0.910 | 24 | 0.12 | |
| Gender (m/f)1 | (11/2) | (10/3) | 0.619 | |||
| Handedness (l/r)2 | (2/11) | (1//12) | 0.539 | |||
| Lesion side (l/r)2 | (6/7) | |||||
| Relative Grip strength | 0.79 ± 0.25 | 0.92 ± 0.20 | 0.175 | 24 | 1.40 | |
| NIHSS | 2.2 ± 2.0 | 0.0 ± 0.0 | 0.001 | 125 | −3.82 | |
| ARAT affected Hand | 51.7 ± 6.5 | 57.0 ± 0.0 | 0.007 | 125 | 2.94 | |
| ARAT unaffected Hand | 57.0 ± 0.0 | 57.0 ± 0.0 | n.a. | |||
| Days post stroke | 4.5 ± 2.6 |
1m = male, f = female,
2l = left, r = right,
3df = degrees of freedom
4T value of t tests
5Equal variance not assumed, according to Levene’s test
Clinical symptoms and motor functions were assessed at the day of the TMS session using established clinical and motor scores (Rehme et al. 2011b), quantifying general stroke severity (National Institutes of Health Stroke Scale, NIHSS) (Brott et al. 1989), arm function (Action Research Arm Test, ARAT) (Lyle 1981), and relative grip strength (details provided in Supplementary Material).
All participants provided informed written consent before inclusion. The study had been approved by the local ethics committee at the University of Cologne and was performed following the Declaration of Helsinki.
Experimental Design
We used a single-blinded, randomized, control-group and control-stimulation controlled crossover design, using functional magnetic resonance imaging (fMRI)-guided TMS to interfere with cortical activity of three contralesional areas (M1, dPMC, aIPS), while recording 3D-kinematics of a simple tapping task as behavioral readout (Tscherpel, Hensel, Lemberg, Freytag et al. 2020; Tscherpel, Hensel, Lemberg, Vollmer et al. 2020). Neuronavigated TMS, time-locked to finger-tapping (online rTMS), was applied to disturb these regions at subject-specific coordinates according to an fMRI localizer task.
Magnetic Resonance Image Acquisition and Preprocessing
MRI was performed on Siemens 3-Tesla MAGNETOM PRISMA scanner equipped with a 64-channel head coil. For sequence details, please see the Supplementary Material.
First, the location and extent of the stroke lesions were assessed using diffusion-weighted imaging (DWI). Additionally, anatomical 3D T1-images were obtained to screen for other structural abnormalities, and for echo planar imaging (EPI) coregistration (see below).
For functional MRI, individual activity maps evoked by index finger tapping with the stroke-affected hand were acquired using a block design, consisting of eight alternating blocks moving the left (four blocks) or right hand (four blocks), respectively. Written instructions displayed for 2.5 s indicated whether the left or the right hand had to be moved in the upcoming block of trials. Each finger-tapping block included three trials (each lasting 3.5 s with a 3.2 s break to prevent fatigue, Wang et al. 2011), in which a visually presented arrow instructed participants to perform continuous index finger tapping at maximal speed with the respective hand (for further details, see Supplementary Material).
Imaging data were preprocessed and analyzed using Statistical Parametric Mapping (SPM8; The Wellcome Centre for Human Neuroimaging, London, UK, http://www.fil.ion.ucl.ac.uk) as implemented in Matlab (The Mathworks Inc.; MA, USA). We deliberately used SPM8 in order to warrant comparability with previous findings based on DCM (Eickhoff et al. 2008; Grefkes, Eickhoff et al. 2008; Sharma et al. 2009; Rehme et al. 2011a; Volz, Eickhoff et al. 2015; Pool et al. 2017) as newer versions of the DCM fundamentally differ in the conceptualization and computation of coupling parameters. For the group analysis, images from patients with right-hemispheric lesions (n = 7) were flipped along the midsagittal plane, so that the lesioned side corresponded to the left hemisphere in all subjects (Grefkes, Nowak et al. 2008). Correspondingly, data from seven healthy controls matched for age, gender, and handedness were flipped to account for systematic effects from hemispheric differences. EPI volumes were spatially realigned to the mean image and coregistered with the structural T1-weighted image using SPM default parameters.
Single-Subject Analysis and Functional Localizer Identification
For localization of regions of interest (ROIs), images were coregistered without spatial normalization, since TMS was performed based on the individual anatomy. A Gaussian filter of 4 mm full-width-at-half-maximum (FWHM) instead of the default 8 mm was applied on EPI data to achieve higher precision in identifying task-related stimulation targets. At the single-subject level, general linear models (GLM) were computed using the six head motion parameters as covariates accounting for movement-related nuisance.
The statistical maps emerging from the first-level analyses were computed before the TMS-session to define the stimulation coordinates for neuronavigated TMS based on standardized anatomical constraints: (1) The M1 activation maximum was selected in the posterior portion of the precentral gyrus, nearest to the anatomical hand knob (Yousry et al. 1997; Diekhoff et al. 2011; Weiss et al. 2013) (2) The dPMC coordinate was defined by the activation peak anterior to the precentral sulcus, nearest to the superior frontal gyrus (Fridman et al. 2004; Lotze et al. 2006). (3) The coordinate in the aIPS was identified by the nearest activation maximum in the medial aIPS close to the postcentral sulcus (Grefkes et al. 2004). This area most likely corresponds to macaque medial intraparietal area (MIP), which features strong anatomical connections with dPMC (Grefkes et al. 2004; Grefkes and Fink 2005).
We first used the contrast “movements of the affected hand versus rest” to identify the activation maxima of the respective ROI. If this contrast did not yield any significant activation clusters in the contralesional hemisphere, activation maxima revealed by the unaffected hand tapping condition were selected, which regularly yielded robust activation clusters in the contralesional hemisphere. This alternate procedure had to be performed in six subjects for M1 (three patients), in two patients for aIPS, and in one patient for dPMC (see Supplement Material for subgroup analyses excluding subjects with missing activation in contralesional ROIs). The contralesional ROI coordinates were then used as stimulation targets for neuronavigated TMS. Across the entire group of subjects, the median Montreal Neurological Institute (MNI) coordinates of individual activation maxima were x = 40, y = −16, and z = 62 for contralesional M1, x = 32, y = −4, and z = 63 for dPMC, and x = 38, y = −46, and z = 60 for aIPS. For DCM, we additionally identified the corresponding ipsilesional ROIs.
fMRI Group Analysis
For the statistical analysis at the group level (second level analysis), realigned volumes were spatially normalized to the standard template of the MNI employing the unified segmentation approach with masked lesions (Ashburner and Friston 2005). Lesion masks were created based on the individual DWI volume using MRIcron (www.sph.sc.edu/comd/rorden/MRicron). For the group analysis, we used the default 8-mm smoothing kernel. GLM contrast images were then analyzed at the second level using a full factorial analysis of variance (ANOVA). Blood oxygenation level dependent (BOLD) activity after stroke has frequently been shown to vary depending on the time after stroke onset and the severity of stroke symptoms (Ward et al. 2003; Rehme et al. 2011b). We, therefore, used stroke severity (as reflected by NIHSS) and the number of days between stroke onset and fMRI session as covariates. The resulting T-maps were thresholded at the voxel level (cluster forming threshold P < 0.001) and cluster-level corrected for multiple comparisons at P < 0.05 (family-wise error, FWE).
Neuronavigated TMS
TMS was performed 1 day after fMRI in order to allow for sufficient time to compute the BOLD activation maxima necessary for the selection of TMS targets. Repetitive TMS was applied over these targets, while recording 3D kinematics of index finger movements performed with the hand ipsilateral to the targeted hemisphere. Two patients performed the TMS session 2 days after fMRI due to medical examinations of priority, as part of the clinical routine. To assure comparability between groups, this schedule was adopted for two healthy controls. TMS was applied using a Magstim Super Rapid2 stimulator (The Magstim Co. Ltd, Whitland, UK) equipped with a Magstim 70 mm Double Air Film Coil. Coil positions were navigated with a frameless computerized stereotaxic system (Brainsight V.2.0.7, Rogue Research, Inc., Montreal, Canada). Following coregistration of the patients’ head with a high-resolution, anatomical MR scan, the position of the TMS coil relative to the stimulation coordinates was provided to the TMS experimenter in real time with a millimeter resolution. Such an approach has been frequently proven superior to navigation strategies based on anatomical landmarks of the head (Sparing et al. 2008; Julkunen et al. 2009; Bashir et al. 2011). During all trials and when changing stimulation sites, the investigator holding the TMS coil received continuous visual feedback of the coil position by means of the Brainsight neuronavigation system.
Every subject performed a total of 84 trials of index finger-tapping with the hand ipsilateral to the TMS-disturbed hemisphere (contralesional hemisphere in patients), each trial lasting 1.6 s while receiving TMS over the different ROIs. Trials were separated by breaks of 5.5 s to prevent fatigue and short-lasting carry-over effects of rTMS (Rotenberg et al. 2014). rTMS was applied at 90% of individual resting motor thresholds (rMT), at a frequency of 10 Hz, time-locked to task execution (online rTMS; Volz et al. 2017; Tscherpel, Hensel, Lemberg, Freytag et al. 2020; Tscherpel, Hensel, Lemberg, Vollmer et al. 2020). That is, 16 rTMS pulses were applied in each trial. rMTs were individually obtained for M1 ipsilateral to the hand investigated (i.e., contralesional M1 in patients, with EMG recordings from the stroke-unaffected hand). It is important to note that the stimulation intensity below the rMT prevented the induction of motor-evoked potentials, which otherwise might have irritated the subject during task performance. In contrast to the excitatory and inhibitory effects of offline rTMS (Jäncke et al. 2004; Cárdenas-Morales et al. 2014; Nettekoven et al. 2015), online rTMS—as applied in the present study—is considered to invariably interfere with the neural processing due to the relatively strong electromagnetic pulses administered at a high frequency, ultimately disturbing the finely tuned interactions of cortical neurons, i.e., transiently inducing a virtual lesion and thereby disturbing task performance (Rossi and Rossini 2004; Rossini et al. 2015).
The TMS coil was placed tangentially to the scalp, inducing a current perpendicular to the respective gyrus and adjacent sulcus of the target region, aiming at effectively disturbing activity in cerebral tissue underneath the coil (Fig. 1, upper row). Notably, biphasic stimulation pulses generated by the Magstim Super Rapid2 system effectively interfere with neural tissue in both stimulation directions, each phase being capable of inducing physiological effects, i.e., in both posterior–anterior direction (first phase) and anterior–posterior direction (second phase) (Groppa et al. 2012). Yet, inducing posterior–anterior currents over M1 in the first phase of the biphasic pulse have been shown to induce higher motor-evoked potentials than inducing anterior–posterior currents in the first phase (Kammer et al. 2001). Hence, comparable to previous online rTMS studies (Lotze et al. 2006; Pollok et al. 2008; Volz et al. 2017; Tscherpel, Hensel, Lemberg, Freytag et al. 2020; Tscherpel, Hensel, Lemberg, Vollmer et al. 2020), we administered pulses in a posterior–anterior current direction in the first phase. As a control condition, rTMS was conducted at 90% of rMT, with the coil being tilted over the parieto-occipital vertex (Pz) (Nettekoven et al. 2014).
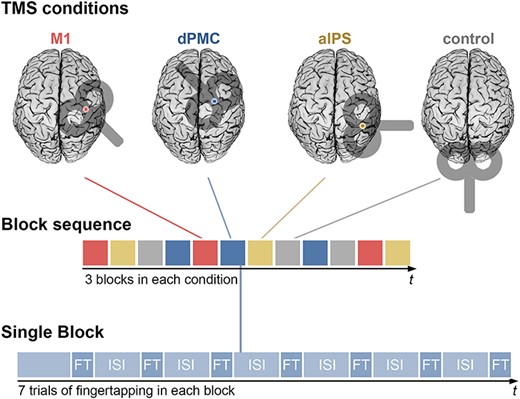
TMS Session: Each subject performed a finger-tapping task under all four TMS conditions in a single TMS session. One session consisted of three blocks per TMS condition, occurring in a pseudo-randomized order. Each block contained seven trials of finger-tapping (FT) while rTMS was applied simultaneously, lasting 1.6 s. Finger-tapping trials were separated by inter-stimulus intervals (ISI) of 5.5 s. In total, finger-tapping was performed 84 times (21 times per condition).
The TMS coil position changed every seven trials in pseudorandomized order so that each of the locations (ipsilateral M1, dPMC, aIPS, control site) was assessed for an equal amount of trials during the first, middle, and last third of the experiment to control for sequence and fatigue effects (Fig. 1). An analysis to exclude potential long-term carry-over effects in the present study is provided in the Supplementary Material.
All stimulation conditions were performed within the same session, obtaining a comparable behavioral readout, which poses an advantage to offline rTMS designs which require an assessment of different stimulation conditions on different days or across different subjects due to the lasting influence on cortical excitability. Using an online rTMS design was critical, particularly in early (sub-)acute stroke patients, who show improvements in motor function on a day-to-day basis. While the investigator (L.H.) applying TMS was not blinded regarding stimulation position, automated data recording ensured interleaved stimulation blocks in a randomized order, and data analysis was performed by a separate person (S.R.) to minimize the risk of an investigator-bias.
Behavioral Assessment
The effects of TMS interference with contralesional areas were tested by continuous index finger-tapping (Ameli et al. 2009; Wang et al. 2011; Tscherpel, Hensel, Lemberg, Freytag et al. 2020; Tscherpel, Hensel, Lemberg, Vollmer et al. 2020). This task is sensitive for impairments of dexterity after stroke while a high level of standardization can be achieved. Importantly, this task can also be performed in an MRI environment, thereby facilitating a comparison between behavioral and neural activation data. Using a 3D ultrasound-based motion analyzer system (CMS 20, Zebris Medical GmbH, Isny, Germany), the signal of a marker placed on the dorsum of the index finger was recorded and analyzed using the 3DAWIN software package (MedCom, Munich, for details see Supplement Material, Kinematic Analysis) (Nowak et al. 2007). For each tapping movement, the performance was quantified by the peak velocity [mm/s] of the index finger. Further, peak amplitude [mm] of each movement was assessed to control for the degree of finger extension. Outliers exceeding 2 standard deviations from one subject’s mean performance were discarded (this was the case in 3.7% of trials). Finally, each subject’s median values of each stimulation condition (M1, dPMC, aIPS, control stimulation) were calculated across trials and utilized for further analysis.
Statistical Analysis of TMS Effects
Statistical analyses of behavioral data were performed using IBM SPSS (Statistical Package for the Social Science, version 24). Data obtained during the rTMS experiment consisted of peak velocity and amplitude measures during real rTMS applied over M1, dPMC, and aIPS, respectively (VERUM conditions, i.e., true interference with activity of the predefined target areas), and rTMS applied with the coil tilted over the parieto-occipital vertex (CONTROL, i.e., sham interference with the frontoparietal system). To adjust the rTMS effect to each subjects’ performance and to facilitate comparisons between the three stimulation sites of interest, kinematic measures of each VERUM condition were related to the performance during CONTROL rTMS using the formula: ((VERUM-CONTROL)/VERUM) × 100. The resulting relative performance changes were then used for ANOVAs for each stimulated region separately, testing for an effect of the between-subject factor GROUP (levels: “patients”, “healthy controls”), comparable to previous studies investigating rTMS effects in a single brain region such as M1 (Nowak et al. 2008; Volz et al. 2017). Effects of separate ANOVAs were Bonferroni-corrected for multiple comparisons. In addition, behavioral effects between stimulation sites were compared by computing a repeated measures ANOVA testing for an interaction between the within-subject factor STIMULATION SITE (levels: “M1”, “dPMC”, “IPS”) and the between-subject factor GROUP (levels: “patients”, “healthy controls”). Violations of sphericity were Greenhouse–Geisser corrected. Assumptions of normality (Shapiro–Wilk test of normality) and homogeneity of variance (Levene’s test) were tested for each measure in patients and controls.
Dynamic Causal Modeling
In order to test whether the effects of online rTMS interference were related to task-dependent interhemispheric connectivity of the stimulation targets, we used DCM to estimate effective connectivity among the ROIs and their ipsilesional counterparts (Friston et al. 2003). Effective connectivity has frequently been used to assess the motor network, consistently demonstrating altered connectivity with the primary motor cortex after stroke (Grefkes et al. 2010; Rehme and Grefkes 2013; Schulz et al. 2016; Diekhoff-Krebs et al. 2017). For further details of the biophysical background of DCM and its advantages and disadvantages compared to other approaches, the reader is referred to, e.g., Friston et al. (2003), Penny et al. (2004), and Grefkes and Fink (2011, 2014).
We extracted the first eigenvariate of the BOLD time series in the six ROIs mentioned above (M1, dPMC, aIPS) within spheres of 4 mm radius centered around the subject-specific activation maxima in both hemispheres. Endogenous connections between ROIs (DCM-A) and task-related modulations of connections (DCM-B) were computed. Twelve alternative connectivity models were constructed based on different hypotheses of context-specific modulations of interregional coupling (see details in Supplementary Material, DCM). To identify the most likely model based on the given data, we applied Bayesian model selection (BMS) using a random-effects analysis (Stephan et al. 2009). In addition, accounting for the possibility that differences in model frequencies were due to chance, the protected exceedance probability was computed (Rigoux et al. 2014). All BMS analyses identified the fully connected model as the “winning model” (Supplementary Fig. S2).
Prediction of TMS Effects by Network Connections
Using endogenous (DCM-A) and task-modulated (DCM-B) coupling parameters, we computed cross-validated multivariate linear regression models to estimate TMS effects.
Encountering the challenge of separating informative from uninformative features in high-dimensional data, generative embedding approaches have previously used DCM to provide predictive (out-of-sample) analyses with biologically meaningful features (e.g., estimates of connection strengths), thus enhancing predictive accuracy (Brodersen et al. 2011). DCM provides a high level of biologically meaningful, and thus interpretable, information, including directionality of connections and their modulation by tasks. By estimating the directionality of connections, DCM has informed models of network dysfunction, including stroke populations (Grefkes and Fink 2011). Furthermore, DCM inherently denoises the data by separating effective connectivity from noise, e.g., resulting from neurovascular effects (Friston et al. 2003). In the present study, DCM was combined with a Lasso, a method of penalized regression modeling, using the glmnet software package (Friedman et al. 2010) implemented in R (www.r-project.org, version 3.4.3). As an advantage to ridge regression or ordinary least squares, Lasso penalizes a least-squares regression depending on the sum of the absolute values of coefficients (Tibshirani 1996). Thereby, most coefficient values are shrunk to zero, leaving a subset of informative coefficients.
Specifically, velocity changes of finger-tapping movements during rTMS over dPMC, M1, and aIPS (compared to control TMS) were employed as dependent variables in three separate models. Each model was trained and tested in a nested leave-one-out cross-validation (Rehme et al. 2015; Tobyne et al. 2018), separating model optimization and the estimation of TMS effects. In an outer loop, one patient was left out (test sample), to independently train the model by the remaining 12 patients. The outer loop was repeated for each patient, predicting TMS effects by the model optimized using the rest of the sample. In an inner loop, all significant connections, found in the sample of healthy controls or in the training sample of patients (excluding the left-out patient) were identified. That is, all positive or negative endogenous (DCM-A) and task-induced (DCM-B) connections (P < 0.05, false discovery rate [FDR] corrected) served as independent variables in the respective regression model. Performing an inner loop leave-one-out cross-validation containing only the training sample (n = 12), each regression model was optimized with the Lasso producing the smallest predictive error. That is, each of the training subgroups underwent separate cross-validations using the function cv.glmnet implemented in the glmnet software package (Friedman et al. 2010), in R (www.r-project.org, version 3.4.3). By setting alpha to 1, this function performs Lasso through the l1 regularization for each λ, yielding a sequence of λ in relation to the mean cross-validated error. From this, we chose λ with the minimal error to predict the TMS effect of the test subject based on the training subsample.
Prediction accuracy was defined as the Pearson correlation between observed and predicted scores. Since three separate predictions were performed (M1, dPMC, aIPS), correlations were Bonferroni-corrected for multiple comparisons. Moreover, the features selected by the Lasso in each outer loop were obtained to identify which connections were most frequently chosen by the Lasso to inform the regression models.
Finally, we compared our results to two alternative approaches, in which the regression model was informed by functional connectivity measures instead of DCM parameters. First, pairwise Pearson correlations were computed between all ROIs, based on the same eigenvariates of BOLD time-series which had been used for DCM. As a second feature space, we computed z scores of correlation coefficients, using the Fisher transformation.
In summary, we compared multivariate linear regression models aiming at predicting TMS effects based on relatively high dimensional DCM parameters to more conventional correlation-based methods.
Data Sharing Statement
The data collected and analyzed in the present study comprising demographics, kinematic readouts under rTMS, ROI timeseries, DCM models, and the analysis code for the regression model will be made publicly available for academic purposes (https://github.com/LukasHensel/acute_stroke_dcm_tms).
Results
Sample
In patients, finger-tapping velocities of the stroke-affected hand were significantly slower (mean peak velocity of 109.5 ± 56.9 mm/s) compared to the control group (159.5 ± 37.9 mm/s, independent t-test, t(20.9) = 2.64, P = 0.015) with no significant difference in movement amplitude (t(19.5) = 1.71, P = 0.104). Stroke lesions featured highest overlap in the posterior insula and the superior temporal gyrus, extending into the inferior parietal lobule (Fig. 2). The stimulation intensities used for TMS interference did not differ between patients (47.5% maximum stimulator output (MSO) ± 10.7%) and healthy controls (51.0% MSO ± 15.5%, independent t-test, t(24) = 0.68, P = 0.507).
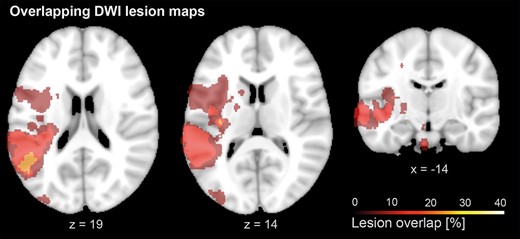
Lesion overlap: Lesion overlap of stroke patients, based on diffusion MRI. Lesion maps showed maximal overlap in the posterior insula and the superior temporal gyrus, extending into the inferior parietal lobule. A list of individual lesion locations is provided in the Supplementary Table S2).
fMRI Group Effects: BOLD and Effective Connectivity
Both groups showed lateralized activation patterns contralateral to the tapping finger, with significant BOLD activity in contralateral sensorimotor cortex, premotor cortex, posterior parietal, insular, and extrastriate visual cortex, as well as cerebellum. As expected, activity levels were more widespread in patients, especially in contralesional brain regions during movements of the stroke-affected hand (Fig. 3). Comparing BOLD signal between groups in the three contralesional ROIs indicated significantly increased activity in patients compared to healthy controls for all three regions (M1: P = 0.038, dPMC: P = 0.041, aIPS: P = 0.006).
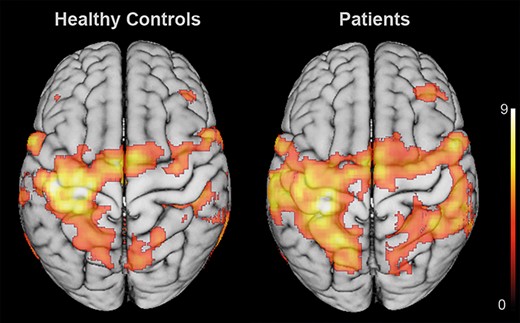
Group effects of BOLD activation: BOLD activation across healthy controls (left) and patients (right), indicating a more bilateral activation pattern after stroke. Notably, patients featured a widespread recruitment of ipsilesional sensorimotor cortex and contralesional frontoparietal regions. Statistical maps were rendered on a 152 T1 average brain template. Results were FWE cluster-level corrected at a threshold of P < 0.05 (cluster-forming threshold at the voxel level: P < 0.001).
Analyzing task-induced (DCM-B) connectivity between the ROIs as revealed by DCM (Fig. 4) revealed a modulation of effective connectivity directed to M1 contralateral to the moving hand in healthy subjects, in line with previous studies (Eickhoff et al. 2008; Grefkes, Eickhoff et al. 2008; Boudrias et al. 2012; Pool et al. 2013). All connections from premotor and parietal ROIs exerted significant positive influences on contralateral M1, which in turn inhibited M1 ipsilateral to the moving hand (Fig. 4, left panel; P < 0.05, FDR corrected). In contrast to healthy subjects, patients in the first week after stroke featured weaker effective connectivity between ROIs, also in line with previous findings in acute stroke patients (Rehme et al. 2011a). Unlike healthy controls, patients neither showed significant excitatory influence from contralesional dPMC and aIPS on ipsilesional M1, nor significant inhibition from ipsi- onto contralesional M1. Significant positive coupling was only observed from dPMC and aIPS on M1, and from aIPS to dPMC in the ipsilesional hemisphere (Fig. 4, left panel, P < 0.05 FDR corrected). Concerning interhemispheric connections, a positive connection from contralesional dPMC to ipsilesional M1 (P = 0.017) and a negative connection from ipsilesional to contralesional M1 (P = 0.021) were observed in patients, which both however did not survive FDR correction for multiple comparisons. Endogenous connections showed a mostly symmetrical distribution between ROIs in patients and healthy subjects (Fig. 4, bottom row).
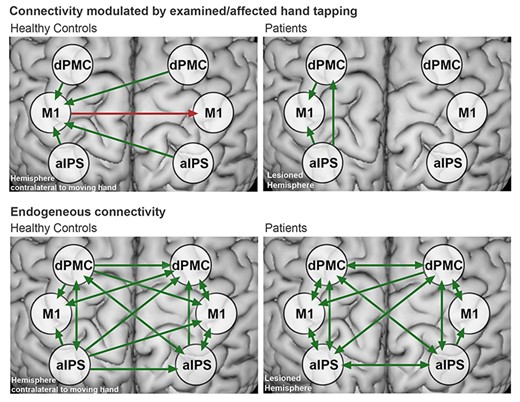
Effective connectivity in healthy controls and patients:Top row: Significant effective connectivity modulated by finger-tapping in healthy participants (DCM-B) (left) and patients (right). The green arrows indicate positive, and the red arrows indicate negative coupling. Bottom row: Endogenous connectivity in healthy controls and patients (DCM-A). Connectivity did not significantly differ between groups. All results were FDR-corrected for P < 0.05. A list of mean connectivity strengths and statistics is provided in the Supplementary Table S3).
TMS Effects on Motor Behavior
Comparing TMS effects on peak velocity and amplitude between groups revealed significant between-subjects effects (factor GROUP; “patients”, “healthy controls”) for both peak velocity (F(1,24) = 9.23, P = 0.018) and amplitude (F(1,24) = 8.22, P = 0.024), after Bonferroni-correction for multiple comparisons. That is, online rTMS interference with contralesional aIPS (i.e., ipsilateral to the moving hand), significantly increased tapping velocities in patients compared to both control stimulation (t(12) = 3.19, P = 0.024) and healthy controls (t(24) = −3.04, P = 0.018). Likewise, interference with aIPS also led to larger tapping amplitudes in patients compared to both control stimulation (t(12) = 3.47, P = 0.024) and healthy controls (t(24) = −2.87, P = 0.024). Hence, disturbing contralesional aIPS activity induced an improvement of both tapping velocities and amplitudes which was specific for the patients’ group (Fig. 5).
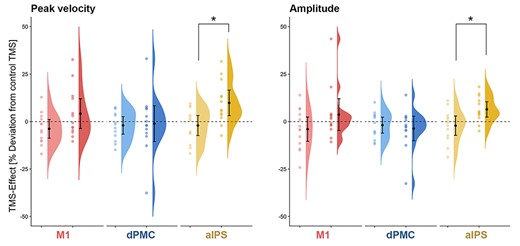
Group effects of online rTMS on tapping performance: TMS effects in healthy controls (light colors) and patients (dark colors) on tapping velocity and amplitude visualized by means of raincloud plots (Allen et al. 2019). The error bars indicate 95% confidence intervals around mean group effects for online rTMS over M1 (red), dPMC (blue), and aIPS (yellow). *P < 0.05
With regards to dPMC and M1, no significant group differences were found. However, a trend was found for rTMS over M1, indicating increased tapping velocity in patients (t(24) = 1.88, P = 0.072, uncorrected). This effect is consistent with the results reported by Volz et al. (2017) for rTMS over contralesional M1 in a similar sample of stroke patients. Since TMS effects largely varied in patients, details on single subject results of online rTMS are provided in the Supplementary Material (Supplementary Fig. S3).
Using Levene’s test for each measure in patients and controls, we found that homogeneity of variance did not differ between groups. Shapiro–Wilk tests showed that the assumption of normality was violated for M1- and dPMC-rTMS effects on tapping amplitudes in the patient group. We therefore employed Mann–Whitney tests, which did not show significant differences between groups.
An alternative analysis of repeated measures ANOVA did not show a significant interaction between STIMULATION SITE and GROUP. A statistical distinction of rTMS effects between M1, dPMC, and aIPS was thus not possible based on the present data.
Effective Connectivity and TMS Effects
We tested for an association between behavioral rTMS effects and the connectivity profiles of the stimulated regions. Accordingly, we used a Lasso-regularized multiple regression, cross-validated in a leave-one-out approach. Indeed, modulations of tapping velocity, induced by rTMS applied to aIPS correlated with the predicted TMS effects based on effective connectivity (Fig. 6, Pearson r = 0.70, P = 0.0249).
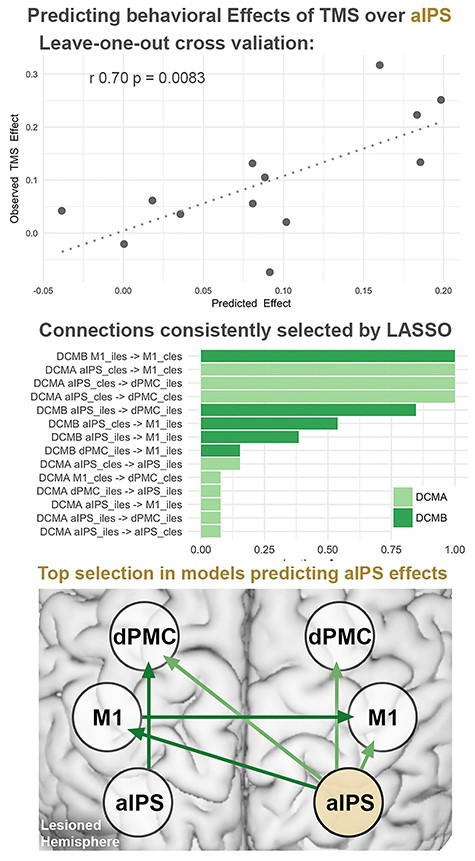
Predicting TMS effects by regression models based on effective connectivity:Top row: Cross-validation of regression models using endogenous (DCM-A) and task-induced (DCM-B) effective connectivity showed significant correlations between predicted and observed TMS effects. Performing a leave one out cross-validation, each subject’s TMS response was predicted using the remaining 12 subjects’ connections as a training set. *Bonferroni-corrected for multiple comparisons. Middle row: Connections selected by Lasso across models, sorted from most to least frequently selected connections. Bottom row: Schematic view of connections selected in more than 50% of the models predicting TMS effects during aIPS stimulation. cles: contralesional, iles: ipsilesional.
Besides significant predictions of online rTMS effects for contralesional aIPS, the analyses identified specific connections as the features contributing to the prediction, offering further pathophysiological insights on the functional roles of aIPS in acute stroke patients. Thus, rTMS effects of aIPS were linked to an aIPS-centered connectivity profile including endogenous connections from this region to bilateral dPMC and to the contralesional M1 (Fig. 6, middle row, left plot). Additionally, task-modulated coupling from the ipsilesional to the contralesional M1 was selected as a relevant feature in the model.
With regards to the dPMC, cross-validation did not show a significant correlation between actual and predicted TMS effects (Pearson r = −0.20, P = 0.522). Attempting to predict effects induced by rTMS over M1 did not survive the correction for multiple comparisons (uncorrected: Pearson r = 0.57, P = 0.041). These findings corresponded to the absence of online rTMS effects at the group level. Attempting to predict rTMS effects based on functional connectivity did not yield significant results (P > 0.2).
Taken together, behavioral effects evoked upon online rTMS interference with contralesional aIPS were linked to specific aspects of motor network connectivity. Connectivity between frontal motor regions and the stimulated aIPS was found to be indicative for the effect of rTMS applied to aIPS on motor behavior. Notably, the behavioral responses to aIPS interference were also related to interhemispheric coupling between bilateral M1, i.e., connectivity distant to the stimulation site, indicating a modulation of ipsilesional M1 activity by the contralesional aIPS as a potential mechanism underlying online rTMS effects.
Discussion
We used fMRI-guided rTMS interference to elucidate the roles of different contralesional frontoparietal areas for motor performance in the first days after a stroke. At the neural level, finger-tapping with the stroke-affected hand was associated with increased activity in contralesional M1, dPMC, and aIPS. Interfering with aIPS activity using online rTMS induced increases of peak velocity and amplitude of finger movements in stroke patients, but not healthy controls. These rTMS-induced changes of motor performance were linked to specific connectivity profiles in patients. Of note, rTMS effects elicited over contralesional aIPS was associated with the connectivity of this area with ipsilesional M1. This regional specificity does not only provide face validity of our methodological approach, but also points to a potential mechanism underlying the rTMS effects on contralesional motor areas. In summary, our findings indicate a detrimental rather than vicarious role of the contralesional hemisphere and are thus compatible with the hypothesis of interhemispheric competition. In particular, our data emphasize the functional importance of contralesional aIPS for motor function in mildly affected patients early after stroke, which may result from its direct influence on ipsilesional M1.
The Role of Contralesional M1 and dPMC Early after Stroke
Both patients and healthy controls featured a lateralized engagement of frontoparietal regions typically involved in motor execution and control (Witt et al. 2008; Rowe and Siebner 2012, Fig. 3). ROI analyses in M1, dPMC, and aIPS showed higher levels of activation in patients compared to healthy controls. This finding corresponds to the frequently observed increase of contralesional activity in the first days after stroke, which has been related to cortical reorganization driving functional recovery (Ward et al. 2003; Tombari et al. 2004; Rehme et al. 2011b). Furthermore, we also observed a relative breakdown of effective connectivity between ipsilesional M1 and contralesional regions, similar to previous findings in acute stroke patients (Rehme et al. 2011a). Accordingly, in the present cohort, only healthy controls showed a task-specific interhemispheric coupling from bilateral dPMC and aIPS to the M1 contralateral to the moving hand, whereas in patients no significant interhemispheric connectivity was found (Fig. 4).
The phenomenon of decreased interhemispheric connectivity and increased BOLD activation in the contralesional hemisphere has been interpreted as a result of a disinhibited contralesional hemisphere, in line with the increased excitability of the contralesional motor cortex early after stroke (Swayne et al. 2008; Volz, Sarfeld et al. 2015; cf. Byblow et al. 2015; Stinear et al. 2015). Given that a persistently elevated BOLD signal in the contralesional hemisphere during paretic hand movements is associated with less favorable motor outcome (Ward et al. 2003), contralesional activation has been suggested to impair motor recovery in some patients. To causally test this hypothesis, TMS studies have investigated the role of contralesional regions for hand motor performance after stroke, mainly examining chronic stroke patients with stable motor deficits (Lotze et al. 2006; Nowak et al. 2008). Yet, inhibiting contralesional M1 by rTMS led to conflicting results, suggesting either a maladaptive (Nowak et al. 2008) or supportive role of contralesional M1 (Lotze et al. 2006; Grefkes and Fink, 2016).
Importantly, the role of contralesional areas may critically change throughout the process of motor recovery. For example, in a longitudinal online rTMS study, disturbing contralesional M1 led to improved finger-tapping performance only in the subacute, but not in the chronic phase after stroke, indicating a time-dependent, detrimental role of contralesional M1 (Volz et al. 2017). In line with the previous literature (Volz et al. 2017), we observed a statistical trend (P = 0.072) indicating different responses of patients and healthy controls to online rTMS over contralesional M1, with patients tending to improve performance. Importantly, some patients showed an improvement of finger-tapping velocities (up to 32.6%), while others showed no—or opposite—effects, indicating that the role of contralesional M1 differs between individual patients in the first days after stroke. Similarly, heterogeneous results were found for contralesional dPMC, where online rTMS effects on tapping velocity ranged from −37.6% to 33.1% (for details regarding all ROIs in patients and healthy controls see Supplementary Fig. S3). While the dPMC has been suggested to develop a supportive function towards chronic stroke (Johansen-Berg et al. 2002; Fridman et al. 2004; Lotze et al. 2006), the present results from acute stroke patients indicate heterogeneous functional roles within the first days after stroke.
In sum, while online rTMS over M1 suggests a mostly disturbing role for motor function, TMS effects particularly in the dPMC may largely vary early after stroke.
The Role of the Contralesional aIPS
Similar to the role of M1 (Volz et al. 2017), the present study suggests a disturbing role for the contralesional aIPS during the first days after stroke, since interfering with activity of this region led to an increased tapping velocity. This corresponds to previous findings showing that attentional deficits in patients suffering from spatial neglect could be ameliorated when inhibiting contralesional parietal regions (Oliveri et al. 2001; Sparing et al. 2009). As patients suffering from neglect were not included in the present sample, we interpret our findings that contralesional aIPS also impacts motor function in acute stroke. This may not be surprising since areas in aIPS like the MIP or the anterior intraparietal area (AIP) (Grefkes and Fink 2005) are not only engaged in attention reallocation (Corbetta and Shulman 2002) but also in motor control processes like visuomotor coordination of arm and hand movements (Grefkes et al. 2002, 2004; Grafton and Hamilton 2007). Thereby, the aIPS may integrate egocentric information of the body with motor representations of the environment (Brozzoli et al. 2012; Chen et al. 2014), which is essential for coordinating hand and finger movements. Given the present findings, online rTMS suggests a maladaptive role of the aIPS in acute stroke patients, raising the question of the neural mechanisms behind this region’s disturbing influence. We address this question in the following paragraph, examining effective connectivity profiles, which could be related to the patients’ individual TMS effects.
Connectivity Contributing to the Role of aIPS
In the present study, we combined online rTMS with models of effective connectivity to test whether the network configuration of a given region explained its role for motor performance after stroke. Implementing this multimodal approach revealed that the early detrimental role of the contralesional aIPS was linked to connections mainly originating in the contralesional aIPS, including endogenous coupling to the bilateral dPMC, contralesional M1, and task-modulated coupling to the ipsilesional M1. Notably, while effective connectivity derived from DCM readily explained the variance in the effects of rTMS over contralesional aIPS, functional connectivity did not allow to do so. This corresponds to the observation that generative embedding approaches including DCM have been previously shown to increase prediction accuracy (Stephan et al. 2009; Brodersen et al. 2014).
Taken together, behavioral effects were linked to an aIPS-centered network with several connections from the contralesional aIPS to bilateral motor regions (Fig. 6). This finding may provide an explanation for the disturbing influence of contralesional aIPS. Assuming this region to integrate egocentric and allocentric representations during hand movements (Chechlacz et al. 2010; Brozzoli et al. 2012; Chen et al. 2014), its influence on the acutely stroke-affected motor network might limit patients’ motor performance, since the aIPS-mediated integration may not have sufficiently adapted to the new motor deficit. While this hypothesis remains speculative, it receives support from the present finding that rTMS effects of aIPS inhibition were mainly explained by coupling within a parieto-frontal network, which has been linked to the dynamic adaptation of hand representations (Brozzoli et al. 2012). Moreover, the maladaptive role of the aIPS was related to task-modulated connectivity from this region to the ipsilesional M1, indicating that its disturbing influence was specifically exerted during movements of the lesioned hand.
In addition, interhemispheric coupling from the ipsilesional to the contralesional M1 was linked to the behavioral effect upon disturbing aIPS activity. While the vicariation theory proposes a recruitment of brain areas to support motor function, the hypothesis of inter-hemispheric competition assumes that the fine-tuned modulation of coupling of neural activity between the hemispheres is disturbed after stroke (Murase et al. 2004; Hummel and Cohen 2006; Nowak et al. 2009; Hinder 2012). The latter theory has been often raised to explain abnormal interhemispheric connectivity between M1 of both hemispheres, suggesting an insufficient disinhibition of ipsilesional M1 during movements of the stroke-affected hand. The present study supports and extends the model of interhemispheric competition by linking the disturbing influence of contralesional aIPS on motor performance to interhemispheric coupling between bilateral M1 and contralesional aIPS. Longitudinal connectivity data have found reductions of interhemispheric M1–M1 inhibition already within the first 72 h after stroke, followed by abnormal coupling from the ipsilesional M1 to the affected hemisphere within the first two weeks poststroke (Rehme et al. 2011a). As suggested by the present results, this early adaptation of interhemispheric processing between both M1 seem to be modulated by coupling from the contralesional aIPS to the ipsilesional M1, revealing a potential pathophysiological mechanism for the maladaptive influence of aIPS. In contrast, the improvement of motor performance during rTMS interference over the contralesional aIPS speaks against the idea of a supporting role of this region early after stroke, at least for mildly affected patients with residual hand function.
In summary, parieto-frontal and interhemispheric connections within the motor system feature implications for neuromodulatory interventions in the contralesional aIPS. Early after stroke, this region seems to adopt a maladaptive, rather than supportive role, which could be linked to both, direct coupling mediated by the aIPS as well as distant, likely competing processes between bilateral M1.
Limitations
Functional neuroimaging studies dealing with acute stroke patients are typically limited concerning the sample size, as recruitment of this patient population in the clinical environment is inherently difficult, which also applies to the present study. This difficulty also explains the relative scarcity of studies dealing with questions of neural reorganization in the early stroke phase. The relatively complex experimental setup combining fMRI, rTMS, and kinematic motor assessment inevitably led to a selection bias due to exclusion criteria (e.g., the exclusion of severely affected patients with no residual movements). Notably, the present patient sample could be recruited with a relatively homogeneous clinical deficit and stroke onset during the acute phase after stroke. To avoid additionally compromising the recruitment rate of acute stroke patients, the present sample—comparable to previous studies in stroke—also included left-handed patients (i.e., Carey et al. 2002; Wang et al. 2011; Volz et al. 2016, 2017) and those with heterogeneous stroke locations including different hemispheres, which have been flipped for fMRI analyses (i.e., Enzinger et al. 2008, Rehme et al. 2015, Schulz et al. 2016, Volz et al. 2017). It must, therefore, be noted that an interpretation of the current data regarding hemispheric differences is not possible. Due to the limited sample size, the study is not suited to perform subgroup analyses. Moreover, it possibly overlooks smaller effects, for example, failing to replicate previous findings for contralesional M1 (Volz et al. 2017). However, the present work replicates findings suggesting a disturbing role of the aIPS in the acute phase after stroke (Tscherpel, Hensel, Lemberg, Vollmer et al. 2020). Notably, the multimodal approach of combining fMRI and rTMS in acute stroke patients allowed to demonstrate a link between effective connectivity and contralesional aIPS function for the first time. The pathophysiological insights of our study thus provide a basis for further investigations probing the response to TMS interference with the aIPS.
Another potential limitation is the single-blinded study design. Tilting the coil over the parieto-occipital vertex as a control condition inevitably requires an unblinded investigator. An alternative approach lies in using a sham coil, which may facilitate double-blinded TMS study designs (Duecker and Sack 2015; Smith and Peterchev 2018). Despite the potential advantages of using a sham coil, for example in interventional trials, one must consider the practical implications with respect to the present study design. In order to avoid serial effects, the interleaved randomization of rTMS conditions required the investigator to change the coil position up to 84 times (number of trials) during the experiment. Exchanging the sham coil at such frequency would have considerably increased the duration of the experiment, which is limited when studying acute stroke patients. Additionally, while blinding success of currently available sham coils is typically measured by perceptions of study participants (e.g., Flanagan et al. 2019), experienced TMS investigators may notice subtle differences in acoustics and sensations between sham and “real” TMS coils more easily, thus still limiting the blinding of the investigator.
Conclusion
This study is the first to combine fMRI and online rTMS to interfere with contralesional neural activation peaks early after stroke, demonstrating a complex relationship between interhemispheric connectivity of a frontoparietal network and the role of the contralesional aIPS for motor performance. We found that rTMS-mediated disturbance of contralesional aIPS led to improved finger-tapping performance in the patients’ group, indicating a disturbing influence of this region already in the first days after stroke. The connectivity analyses revealed that this effect was driven by coupling exerted from the contralesional aIPS on motor regions including M1 controlling the paretic hand, indicating a dysfunctional integration of parietal representations into the stroke-affected motor network. Together, these findings suggest that an interhemispheric parietofrontal network may be relevant for the reorganization of parietal motor-related regions early after stroke. Hence, future therapeutic rTMS trials might also consider other contralesional areas as stimulation targets such as contralesional aIPS in order to support the recovery of motor function after stroke.
Notes
Conflict of Interest: None declared.
Funding
C.G. has been supported by the German Research Foundation (DFG GR 3285/2-1). C.G. and G.R.F. are also supported by the University of Cologne Emerging Groups Initiative (CONNECT group) implemented into the Institutional Strategy of the University of Cologne and the German Excellence Initiative. G.R.F. gratefully acknowledges additional support from the Marga and Walter Boll Stiftung.
References
Ameli M, Grefkes C, Kemper F, Riegg FP, Rehme AK, Karbe H, Fink GR, Nowak DA. 2009. Differential effects of high-frequency repetitive transcranial magnetic stimulation over ipsilesional primary motor cortex in cortical and subcortical middle cerebral artery stroke.