


Abstract
It is generally assumed that the encoding of a single event generates multiple memory representations, which contribute differently to subsequent episodic memory. We used functional magnetic resonance imaging (fMRI) and representational similarity analysis to examine how visual and semantic representations predicted subsequent memory for single item encoding (e.g., seeing an orange). Three levels of visual representations corresponding to early, middle, and late visual processing stages were based on a deep neural network. Three levels of semantic representations were based on normative observed (“is round”), taxonomic (“is a fruit”), and encyclopedic features (“is sweet”). We identified brain regions where each representation type predicted later perceptual memory, conceptual memory, or both (general memory). Participants encoded objects during fMRI, and then completed both a word-based conceptual and picture-based perceptual memory test. Visual representations predicted subsequent perceptual memory in visual cortices, but also facilitated conceptual and general memory in more anterior regions. Semantic representations, in turn, predicted perceptual memory in visual cortex, conceptual memory in the perirhinal and inferior prefrontal cortex, and general memory in the angular gyrus. These results suggest that the contribution of visual and semantic representations to subsequent memory effects depends on a complex interaction between representation, test type, and storage location.
Introduction
The term “memory representation” refers to the informational content of the brain alterations that are formed during encoding and recovered during retrieval (Gisquet-Verrier and Riccio 2012; Moscovitch et al. 2016). Given that these brain alterations are hypothesized to consist of persistent synaptic changes among the neurons that processed the original event, the content of lasting memory representations most likely correspond to the nature of computations performed by the original neurons. In the case of visual memory for objects, these computations correspond to processing along the ventral (occipitotemporal) pathway from the processing of simple visual features in early visual cortex (e.g., edge processing in V1) to the processing of objects’ identities and categories in anterior temporal and ventral frontal areas (e.g., binding of integrated objects in perirhinal cortex). Nonetheless, how such representational content interacts with subsequent memory effects (SME) across the whole brain remains heretofore largely unexplored, especially for complex visual and semantic information. Thus, object memory representations are likely to consist of a complex mixture of visual and semantic representations stored along the ventral pathway, as well as other regions. Investigating the nature of these representations, and how they contribute to successful memory encoding, is the goal of the current study.
The nature of visual representations has been examined in at least 3 different domains of cognitive neuroscience: vision, semantic cognition, and episodic memory. Vision researchers have examined the representations of visual properties (Yamins et al. 2014; Rajalingham et al. 2018), semantic cognition researchers, the representations of semantic features and categories (Konkle and Oliva 2012; Clarke et al. 2013; Martin et al. 2018), and episodic memory researchers, the representations that are reactivated during episodic memory tests (Kuhl et al. 2012; Favila et al. 2018). Interactions among these 3 research domains have not been as intimate as one would hope. The domains of object vision and semantic cognition have been getting closer, both by the fact that semantic cognition researchers often examine the nature of natural object representations at both visual and semantic levels (Devereux et al. 2013; Martin et al. 2018), and also that both domains are relying increasingly on the use of advanced neural network models to reveal statistical regularities in object representation (Jozwik et al. 2017; Devereux et al. 2018). However, the episodic memory domain has been somehow disconnected from the other two, partly because it has tended to focus on broad categorical distinctions (e.g., faces vs. scenes) rather than in the component visual or semantic features (Lee et al. 2016). The current study strengthens the links between the 3 domains by examining how the representations of the visual and semantic features of object pictures predict subsequent performance in episodic perceptual and conceptual memory tasks. When only the visual modality is investigated, the terms “visual” and “semantic” are largely equivalent to the terms “perceptual” and “conceptual,” respectively. To avoid confusion, however, we use the visual/semantic terminology for representations and the perceptual/conceptual terminology for memory tests.
The distinction between perceptual versus conceptual memory tests has a long history in the explicit and implicit memory literatures, with abundant evidence of dissociations between these 2 types of tests (for a review, see Roediger and McDermott 1993). Although these dissociations have been typically attributed to different forms of memory processing (Roediger et al. 1989) or memory systems (Tulving and Schacter 1990), they can also be explained in terms of different memory representations. In Bahrick and Boucher’s (1968) and Bahrick and Bahrick’s (1971) studies, for example, participants encoded object pictures (e.g., a cardinal), and memory for each object was tested twice: first, with a word-based conceptual memory test (have you encountered a “cardinal”?), and second, with a picture-based perceptual memory test (have you seen this particular picture of a cardinal?). The results showed that participants often remembered the concept of an object but not its picture, and vice versa. The authors hypothesized that during encoding, visual objects generate separate visual and semantic memory representations, and that during retrieval, visual representations differentially contributed to the perceptual memory test, and semantic representations, to the conceptual memory test. This hypothesis aligns with the behavioral principle of transfer appropriate processing (Morris et al. 1977), but expressed in terms of representations rather than forms of processing. In the current study, we investigated the idea of separate visual and semantic memory representations using functional magnetic resonance imaging (fMRI) and representational similarity analysis (RSA).
Although it is common to use a broad distinction between visual and semantic processing/representations in behavioral memory studies (Bahrick and Boucher 1968; Bahrick and Bahrick 1971; Paivio 1986; Roediger et al. 1989), neuroscientists have associated vision and semantics with many different brain regions (e.g., over 30 different visual areas, see Van Essen 2005) and underlying neural signatures. Vision neuroscientists have described the ventral pathway as a posterior–anterior, visuo-semantic gradient, going from occipital regions (e.g., V1–V4), which analyze simple visual features (e.g., orientation, shape, and color), to more anterior ventral/lateral occipitotemporal areas (e.g., lateral occipital complex—LOC), which analyze feature conjunctions, to perirhinal cortex (Barense et al. 2005; Clarke et al. 2013) and medial fusiform regions (Martin 2007; Tyler et al. 2013), which analyze integrated objects. Semantic cognition neuroscientists have also supported an anterior-to-posterior analysis progression, often employing RSA or multivoxel pattern analyses (MVPA) to dissociate neural evidence for object categories or properties in this pathway. For example, while taxonomic relationships are commonly reported in the fusiform gyrus and lateral occipital cortex (Mahon et al. 2009; Leshinskaya and Caramazza 2015), more advanced processing of multimodal object properties in perirhinal cortex (Martin et al. 2018), the processing of abstract object properties in anterior temporal cortex (Binney et al. 2016), and the control of semantic associations, to the left inferior frontal gyrus (Badre and Wagner 2007) are all consistent with this view. As illustrated by the case of perirhinal cortex, several regions are involved in both visual and semantic processing, which is consistent with the assumption that semantics emerge gradually from vision (Clarke et al. 2015).
If one assumes that memory representations are the residue of visual and semantic processing (Pearson and Kosslyn 2015; Horikawa and Kamitani 2017), then each kind of visual analysis (e.g., processing the color red) or semantic analysis (e.g., identifying a type bird) can be assumed to make a different contribution to subsequent memory (e.g., remembering seeing a cardinal). We can glean information about the representational content of different brain regions by testing whether the evoked representations coded in a region reflect the organizational logic across a set of stimuli along various dimensions, be they perceptual (a region responds similarity to items that are round, or of the same color) or conceptual (a region response more similarity to items whose category structure is similar). These assumptions deserve to be tested, and therefore to investigate the multiplicity of representations and associated brain regions mediating subsequent memory while maintaining parsimony, we focused on only 3 kinds of visual representations and 3 semantic representations. For the visual representations, we identified 3 kinds using a deep convolutional neural network (DNN) model (Kriegeskorte 2015). DNNs simplify the complexity of visual analyses into a few main kinds, one for each network layer. There is evidence that DNNs can be valid models of ventral visual pathway processing, and can even surpass traditional theoretical models (e.g., HMAX). In the current study, we used 3 layers of a widely used DNN (VGG16, see Simonyan and Zisserman 2014) to model early, middle, and late visual analyses (corresponding to an early input layer, second convolutional layer, and final fully connected layer). For the semantic representations, we used 3 levels that have been previously distinguished in the semantic memory literature (McRae et al. 2005): observed, taxonomic, and encyclopedic features. The observed level, such as “a cardinal is red,” is the closest to vision and comprises verbal descriptions of observable visual features in the presented image. The Taxonomic level, such as “a cardinal is a bird,” corresponds to a more abstract description based on semantic categories. Although more abstract, this level is still linked to vision because objects belonging to the same category share many visual features (e.g., all birds have 2 legs which are typically 2 vertical lines in the visual image). Finally, the Encyclopedic level, such as “cardinals live in North and South America,” is the most abstract level because it cannot be typically inferred from visual properties and is usually learned in school or other forms of cultural transmission. Although a model with only 3 kinds of visual representations and 3 kinds of semantic representations is an oversimplification, we preferred to start with a simple, parsimonious model, and wait for future studies to add additional or different representation types (e.g., 4 levels instead of 3 levels, or other means of summarizing information across all levels of a DNN, as in Clarke et al. 2018).
We sought to address the contribution of these various forms of visual and semantic information to episodic memory for object pictures, using 2 sequential memory tests. In the “conceptual memory test,” they recognized the names of encoded concepts among the names of new objects of the same categories. In the “perceptual memory test,” they recognized the pictures of encoded objects among new pictures of the same objects (e.g., a similar picture of a cardinal). It is important to emphasize that these 2 tests are not “pure” measures of one kind of memory. We assume that a conceptual memory test is less dependent on the retrieval of visual information than the perceptual. Conversely, we assume that the perceptual memory test is more dependent on visual information than the conceptual memory test because the visual distractors were similar versions of the encoded pictures, and hence, participants had to focus on the visual details to make the old/new decision (in our study, we used separate objects, but for an investigation of the effect of object color or orientation on recognition memory, see Brady et al. 2013). However, both conceptual and perceptual tests are also sensitive to the alternative type of information. The conceptual memory test is also sensitive to visual information because participant could recall visual images spontaneously or intentionally to decide if they encountered a type of object. The perceptual memory test is also sensitive to semantic information because different versions of the same object may have small semantic differences that participants may also use to distinguish targets from distractors. Thus, the difference between the informational sensitivity of conceptual and perceptual tests is not absolute but a matter of degree. As a result, we expect some contribution of visual information to the conceptual memory test and of semantic information to the perceptual memory test.
In sum, we extended typical RSA analyses in the domains of vision and semantics by investigating not only what brain regions store different kinds of visual and semantic representations, but also how these various representations predict subsequent episodic memory. Like Bahrick and Boucher (1968) and Bahrick and Bahrick (1971), we hypothesized that visual and semantic representations are simultaneously stored during encoding but their contributions to later memory are modulated by the nature of the retrieval test: visual representations differentially contribute to the perceptual memory test, and semantic representations, to the conceptual test.
Materials and Methods
Participants
Twenty-six healthy younger adults were recruited for this study (all native English speakers; 14 females; age mean ± SD, 20.4 ± 2.4 years; range 18–26 years) and participated for monetary compensation; informed consent was obtained from all participants under a protocol approved by the Duke Medical School IRB. All procedures and analyses were performed in accordance with IRB guidelines and regulations for experimental testing. Participants had no history of psychiatric or neurological disorders and were not using psychoactive drugs. Of the original participants tested, 3 participants were excluded due to poor performance/drowsiness during Day 1, one subject suffered a fainting episode within the MR scanner on Day 2, and 2 participants were subsequently removed from the analysis due to excessive motion, leaving 20 participants in the final analysis.
Stimuli
Stimuli used in this study were 360 objects drawn from a variety of object categories, including mammals, birds, fruits, vegetables, tools, clothing items, foods, musical instruments, vehicles, furniture items, buildings, and other objects. Of these 360, 300 were used as the target stimuli set, as well as 60 catch-trial items (see Behavioral Paradigm) evenly distributed from these 12 categories, which were included in the behavioral paradigm but not in the fMRI analyses. During the study, each object was presented alone on white background in the center of the screen with a size of 7.5°.
Behavioral Paradigm
As illustrated by Figure 1, the behavioral paradigm consisted of separate incidental encoding (Day 1) and retrieval (Day 2) phases in subsequent days (range = 20–28 h); participants were naïve to the subsequent memory test until after scanning was complete on Day 1. During encoding, participants were instructed to covertly name each object (e.g., “stork,” “hammer”); we explicitly chose to use covert naming (instead of a semantic elaboration task, as is common in the episodic memory studies) given evidence that basic-level naming is an automatic process (Bauer and Just 2017). Nonetheless, though it is typical in object naming studies to rely on covert naming (Clarke et al. 2015; Cichy et al. 2019), we were particularly interested in ensuring participants retrieved the correct label for each presented image. In order to ensure they did so, participants were instructed to indicate with a single button press whether a single letter probe presented immediately before each object matched the first letter of the object’s name. On a small proportion of “catch trials” (60 of 360 total items), letters which were not associated with any potential label or lemma for a given object were shown instead of the matching letter. If participants could not remember the objects’ name, they pressed a “do not know” key. Catch trials (10%) and “do not know” trials (mean = 8%) were excluded from the analyses; as such, both motor presses and uncertainty about an object’s identity were reflected in a button press. Trials were timed, with timing parameters for each trial comprised an initial fixation cross lasting 500 ms, followed immediately by the single letter probe for 250 ms, immediately followed by an object presented for 500 ms, followed by a blank response screen lasting between 2 and 7 s (i.e., a variable intertrial interval with an exponential distribution).The object presentation order was counterbalanced across participants, although a constant category proportion was maintained ensuring a relatively even distribution of the 12 different object categories across the block. This category ordering ensures objects from the same category do not cluster in time, avoiding potential category clustering as a consequence of temporal proximity. The presentation and timing of all tasks was controlled with presentation (Psychology Software Tools), and naming accuracy was recorded by the experimenter during acquisition.
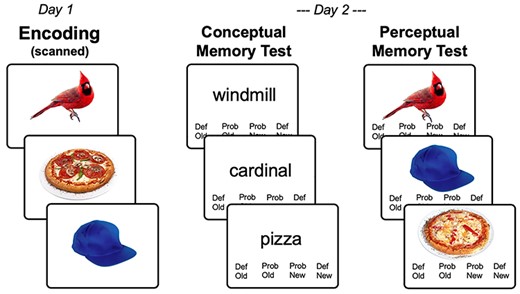
Task paradigm. (A) Across 2 encoding runs on Day 1, participants viewed 360 object images while covertly naming. (B) Incidental memory tests on Day 2 consisted of previously viewed and novel concepts (conceptual memory test), or previously viewed concepts with previously viewed and novel image exemplars (perceptual memory test).
During retrieval, participants performed sequential conceptual and perceptual memory tests for the encoded objects. The conceptual task was performed before the perceptual tasks following Bahrick and Boucher (1968) and Bahrick and Bahrick (1971). The rationale for this order is that testing the concept first (e.g., did you see a table?) does not facilitate the recognition of a specific picture of the object (e.g., did you see this exact picture of a table?, as opposed to a similar picture), whereas testing for the picture first makes the conceptual test trivial. Furthermore, the shift from pictures during encoding to words during retrieval in the conceptual memory is based on the assumption that semantic representations should be resistant to study–test format shifts (Koutstaal et al. 2001; Simons et al. 2003). Based on extensive piloting, we found 24 h to be the best retention interval for ensuring enough hits and misses for memory prediction analyses and to minimize differences between conceptual and perceptual retrieval performance. In the conceptual memory test, which occurred within the fMRI scanner ~ 24 h after the initial encoding scan, participants were presented with 400 lexical cues representing names of previously encoded concepts (n = 300) and lexical cues representing new object concepts from the same categories (n = 100); in this timed recognition test, cues were present for 3 s (which comprised the response window), with a variable inter-trial interval of 3–7 s (as above). Participants responded with an old/new judgment using a 4-button response box (“definitely old,” “maybe old,” “maybe new,” “definitely new”). New items in the conceptual (recognition) memory test were drawn from the same categories as old items, however, these hierarchies were selected to create an ordered stimulus set, and not explicitly selected to be semantically similar lures, as in false memory studies. There was no significant difference between the semantic (cosine) similarity between old and new items (mean r = 0.32) compared with between all old items (mean r = 0.34); as such, there was no more semantic similarity between targets (old items) and lures (new items) than there was between the targets themselves. In the perceptual memory test, which occurred in a postscan testing session in an adjoining room using the same video and response box, participants were shown single images (n = 300) of encoded objects, 2/3 of which were the same image from the Day 1 encoding phase, and 1/3 new images (or perceptual lures) based on concepts previously seen on Day 1, but using a separate exemplar image from that concept (e.g., a similar picture of a cardinal); no new object concepts were presented. Timing parameters and response options were the same as the conceptual memory test.
MRI Acquisition
The encoding phase and the conceptual memory test were scanned but only the encoding data are reported in this article. Scanning was done in a GE MR 750 3-Tesla scanner (General Electric 3.0 tesla Signa Excite HD short-bore scanner, equipped with an 8-channel head coil). Coplanar functional images were acquired with an 8-channel head coil using an inverse spiral sequence with the following imaging parameters: 37 axial slices, 64 × 64 matrix, in-plane resolution 4 × 4 mm2, 3.8 mm slice thickness, flip angle = 77o, TR = 2000 ms, TE = 31 ms, FOV = 24.0 mm2. The diffusion-weighted imaging dataset was based on a single-shot EPI sequence (TR = 1700 ms, 50 contiguous slices of 2.0 mm thickness, FOV = 256 × 256 mm2, matrix size 128 × 128, voxel size 2 × 2 × 2 mm3, b-value = 1000 s/mm2, 36 diffusion-sensitizing directions, total scan time ∼6 min). The anatomical MRI was acquired using a 3D T1-weighted echo-planar sequence (68 slices, 256 × 256 matrix, in-plane resolution 2 × 2 mm2, 1.9 mm slice thickness, TR = 12 ms, TE = 5 ms, FOV = 24 cm). Scanner noise was reduced with earplugs and head motion was minimized with foam pads. Behavioral responses were recorded with a 4-key fiber optic response box (Resonance Technology), and when necessary, vision was corrected using MRI-compatible lenses that matched the distance prescription used by the participant.
Functional preprocessing and data analysis were performed using SPM12 (Wellcome Department of Cognitive Neurology) and custom MATLAB scripts. Images were corrected for slice acquisition timing, motion, and linear trend; motion correction was performed by estimating 6 motion parameters and regressing these out of each functional voxel using standard linear regression. Images were then temporally smoothed with a high-pass filter using a 190 s cutoff, and normalized to the Montreal Neurological Institute (MNI) stereotaxic space. White matter (WM) and cerebrospinal fluid (CSF) signals were also removed from the data, using WM/CSF masks and regressed from the functional data using the same method as the motion parameters. Event-related blood oxygen level–dependent (BOLD) responses for correct trials were analyzed using a modified general linear model (Worsley and Friston 1995) and RSA modeling (described below). Brain images were visualized using the FSLeyes toolbox (fsl.fmrib.ox.ac.uk/fsl/fslwiki/FSLeyes) and SurfIce (www.nitrc.org/projects/surfice/).
Cortical Parcellation
While voxelwise analyses provide granularity to voxel pattern information, they are nonetheless interpreted with respect to specific cortical loci; on the other hand, broad regions of interest (ROIs) encompassing large gyri or regions of cortex often obscure more subtle effects. We chose an intermediate approach and used parcellation scheme with regions of roughly equivalent size and shape. This approach afforded 2 benefits. First, analyzing homogenously sized regions across the brain is an optimal approach for whole brain analyses, minimizing biases in brain representational dissimilarity matrice (RDM) similarity due to the size of the gyrus or anatomical region. Second, ROI-level analyses offer an advantage over voxelwise approaches by allowing clearer conclusions to be drawn about the function of distinct brain regions and increasing statistical power with fewer tests to correct for multiple comparisons. Furthermore, the subparcellated Harvard-Oxford atlas offers a particular advantage in retaining good coverage of medial temporal lobe structures such as the hippocampus and perirhinal cortex, which can often be obscured by many standard parcellation schemes. To create subject-level parcellations, participants’ T1-weighted images were segmented using SPM12 (www.fil.ion.ucl.ac.uk/spm/software/spm12/), yielding a gray matter (GM) and WM) mask in the T1 native space for each subject. The entire GM was then parcellated into roughly isometric 388 ROIs, each representing a network node by using a subparcellated version of the Harvard-Oxford Atlas (Braun et al. 2015), defined originally in MNI space. The T1-weighted image was then nonlinearly normalized to the ICBM152 template in MNI space using fMRIB’s Nonlinear Image Registration Tool (FNIRT, FSL, www.fmrib.ox.ac.uk/fsl/). The inverse transformations were applied to the HOA atlas in the MNI space, resulting in native-T1-space GM parcellations for each subject. Then, T1-weighted images were registered to native diffusion space using the participants’ unweighted diffusion image as a target; this transformation matrix was then applied to the GM parcellations above, using FSL’s FLIRT linear registration tool, resulting in a native-diffusion-space parcellation for each subject.
RSA and Subsequent Memory Analyses
Overview
Our analytical method involved 4 steps (Fig. 2). The first 3 steps are standard in RSA studies. 1) The visual and semantic properties of the stimuli were used to create 6 different RDMs). In an RDM, the rows and columns correspond to the stimuli (300 in the current study) and the cell contains values of the dissimilarity (1—Pearson correlation) between pairs of stimulus representations. The dissimilarity values vary according to the representation type examined. For example, in terms of visual representations, a basketball is similar to a pumpkin but not to a golf club, whereas in terms of semantic representations, the basketball is similar to the golf club but not to the pumpkin. 2) An activation pattern matrix was created for each ROI. This matrix has the same structure as the RDM (stimuli in rows and columns) but the cells do not contain a measure of dissimilarity in stimulus properties as in the RDM, but dissimilarity in the fMRI activation patterns by the stimuli. 3) We then computed the correlation between 1) the dissimilarity of each object with the rest of the objects in terms of stimulus properties (each row of the RDM) and 2) the dissimilarity of the same object with the rest of the objects in terms of activation patterns (each row of the activation pattern matrix), and identified brain regions that demonstrated a significant correlation across all items and subjects. We term the strength of this second-order correlation the itemwise RDM-activity fit (IRAF). The IRAF in a brain region is therefore an index of the sensitivity of that regions to that particular kind of visual or semantic representation. Note that such an item-wise approach differs from the typical method of assessing such second-order correlations between brain and model RDMs (Kriegeskorte and Kievit 2013), which typically relate the entire item × item matrix at once. This item-wise approach is important for linking visual and semantic representations to subsequent memory for specific objects.
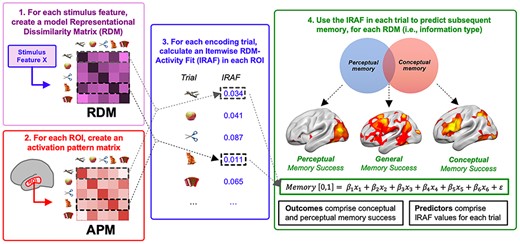
Four steps of the method employed. (1) RDMs are generated for each visual and semantic representation type investigated, and activation pattern dissimilarity matrices are generated for each region-of-interest. (2) An “activation pattern matrix” was created for each region-of-interest. This matrix tracks the dissimilarity between the fMRI activation patterns for all voxels in the ROI for each pair of stimuli, yielding a matrix of dissimilarity values of the same dimensions as the model RDM. (3) For each brain region, each model RDM is correlated with the activation pattern matrix, yielding a stimulus-brain fit (IRAF) measure for the region. (3) The IRAF is used as an independent variable in regressor analyses to identify regions where the IRAF of each RDM predicted subsequent memory in the perceptual memory test but not the conceptual memory test (perceptual memory), in the conceptual memory test but not the perceptual memory test (conceptual memory), and in both memory tests (general memory).
While the first 2 steps are standard in RSA studies in the domains of perception (Cichy et al. 2014) and semantics (Clarke and Tyler 2014), and the third is a minor itemwise variation of typical second-order brain-model comparisons, our final fourth step is a novel aspect of the current study: 4) we identified regions where the IRAF for each RDM significantly predicted subsequent memory in (a) the perceptual memory test but not the conceptual memory test, (b) in the conceptual memory test but not the perceptual memory test, and (c) in both memory tests, using 2 distinct logistic models (see Fig. 2). Henceforth, we describe these 3 outcomes as perceptual memory, conceptual memory, and general memory, respectively. Notice that all 3 tests rely on a traditional subsequently remembered versus forgotten comparison (albeit within a binary logistic regression framework), and as such are differentiated solely by the types of trials that contribute to each model. Furthermore, we expect that regions that are traditionally associated with each of our 6 types of information (and have high IRAF values for their respective models), as well as regions that are not (and have low IRAF values) may both make contributions to subsequent memory in each test. While encoding processes may rely heavily on the visual representations associated with perception (Borst and Kosslyn 2008; Lewis et al. 2011), encoding is not simply a subset of perception, and many of the regions responsible for predicting SME for objects (including PFC, see Fig. 2B in Kim 2011) lie outside those inferior occipitotemporal areas traditionally associated with natural object perception (Cabeza and Nyberg 2000). We therefore expect that such subthreshold information in a widespread array of brain regions may make a significant contribution to memory strength.
Creating RDMs
An RDM represents each stimulus as row or column, with each cell indicating the dissimilarity between a pair of stimuli in a particular representation type. In the current study, combining visual and semantic representations was a nontrivial task justified by a central empirical goal: using complementary, well-established informational schemes to provide the fullest picture of object representation (and how this information contributes to subsequent memory). We sought to combine 2 comprehensive approaches for visual and semantic representations in order to address the fundamental gap implicit in each perspective: while the state of the art tools in vision science, DNNs, are able to resolve image classification with a high degree of accuracy, they still fail compared with human performers; on the other hand, while semantic feature models also have a high degree of theoretical value and comprise the basis for robust, generalizable image classification, these feature models still fail to capture the basic computations of the human early visual system. Thus, for visual representations, we employed RDMs were derived from a popular DNN (VGG16; Krizhevsky et al. 2012; LeCun et al. 2015). DNNs consist of layers of convolutional filters and can be trained to classify images into categories with a high level of accuracy. During training, DNNs “learn” convolutional filters in service of classification, where filters from early layers predominately detect lower-level visual features and from late layers, higher level visual features (Zeiler and Fergus 2014). DNNs provide better models of visual representations in the ventral visual pathway than traditional theoretical models (e.g., HMAX, object-based models; Cadieu et al. 2014; Groen et al. 2018). Therefore, a DNN is an ideal model to investigate multilevel visual feature distinction. Here, we used a pretrained 16-layer DNN from the visual geometry group, the VGG16 (Simonyan and Zisserman 2014), which was successfully trained to classify 1.8 million objects into 365 categories (Zhou et al. 2017). VGG16 consists of 16 layers including 13 convolutional and 3 fully connected layers. Convolutional layers form 5 groups and each group is followed by a max-pooling layer. The number of feature maps increases from 64, through 128 and 256 until 512 in the last convolutional layers. Within each feature map, the size of the convolutional filter is analogous to the receptive field of a neuron. The trained VGG16 model performance was within normal ranges for object classification (Ren et al. 2017).
We assessed visual information based on the VGG16 model activations from our trained VGG16 model. We used both convolutional (conv) and fully connected (fc) layers from VGG16. For each convolutional layer of each DNN, we extracted the activations in each feature map for each image, and converted these into one activation vector per feature map. Then, for each pair of images, we computed the dissimilarity (squared Euclidean distance) between the activation vectors. This yielded a 300 × 300 RDM for each feature map of each convolutional DNN layer. For each pair of images, we computed the dissimilarity between the activations (squared Euclidean distance; equivalent here to the squared difference between the 2 activations). This yielded a 300 × 300 RDM for each model unit of each fully connected DNN layer. We based the early visual RDM in an early input layer, the middle visual RDM in a middle convolutional layer (CV11), and the late visual RDM in the final fully connected layer (FC2).
However, despite the computational capacity and generalizability of DNNs for object classification, the lack of perfect performance suggests that additional semantic information is necessary to properly capture the brain’s representation of a particular object concept. Such a wealth of abstract information is readily available in the use of a widely used method of assessing conceptual property norms (e.g., Devereux et al. 2014), which are derived from a participant-level evaluation of object concepts on a concept-by-concept basis. Thus, for the semantic dimension, RDMs were based on the semantic features of all observed objects, obtained in a separate normative study (see Supplementary Materials). While the use of the term “semantic” is often invoked in studies of category encoding or learning paradigms which investigate only a 2 or 3 semantically distinct categories, such an analysis does not capture the full range of possible semantic relationships between any pair of distinct objects, and more practically seems at odds with the RSA approach, which favors similarity based on continuous, rather than discrete similarity values. One of the most comprehensive models attempting to capture this variation is the conceptual structure account (CSA; see Tyler and Moss 2001; Tyler et al. 2013), which describes concepts in terms of their constituent features, finding that object categories are often best explained by the sharedness and distinctiveness of the features of a given group of items. McCrae feature categories were used to differentiate types of semantic feature information. Feature categories used here include observed visual features (comprising McCrae feature categories of “visual surface and form”, “visual color,” and “visual-motor”), taxonomic features, and encyclopedic features; feature categories with fewer than 10% of the total feature count (e.g., “smell” or “functional” features) were excluded. The feature vector for the 300 encoding items was 9110 features; objects had an average of 23.4 positive features. The semantic feature RDMs reflect the semantic dissimilarity of individual objects, where dissimilarity values were calculated as the cosine angle between feature vectors of each pair of objects. Cosine similarity gives very similar results to Pearson’s r but the former measure was chosen following Clarke et al. (2014) and Devereaux et al. (2014) who used the cosine distance between feature vectors in a concept-feature frequency matrix. The observed semantic RDM was based on the dissimilarity of features that can be observed in the objects (e.g., “is round”), the taxonomic semantic RDM on the dissimilarity of taxonomic or category information (e.g., “is a fruit”), and the encyclopedic semantic RDM, was based on the dissimilarity in encyclopedic details (e.g., “is found in Africa”). It may be worthwhile to note that the taxonomic semantic RDM (based on features offered in an independent sample of respondents) has a high overlap with a discrete categorical model based on the explicit category choices listed above (r = 0.92), suggesting that such taxonomic labels faithfully reproduce our a priori category designations.
To provide an intuitive visualization of this novel division of “visual” and “semantic” representations into more granular dimensions, multidimensional scale (MDS) plots for the visual and semantic RDMs are shown in Figure 3. The MDS plot for the early visual RDM (Fig. 3A) appears to represent largely color saturation (horizontal axis); the MDS plot for the middle visual RDM (Fig. 3B) seems to code for shape–orientation combinations (e.g., round objects towards the top, square objects at the top-left, thin-oblique objects at the bottom); and the MDS plot for the late visual RDM (Fig. 3C) codes for more complex feature combinations that approximate object categories (e.g., animals at the top-left, round colorful fruits to the bottom, squarish furniture on the top-right, musical instruments to the right). Thus, although we call this RDM “visual,” this RDM clearly begins to represent abstract semantic categories; this is not surprising given that the end of the visual processing cascade is assumed to lead into simple semantic distinctions.
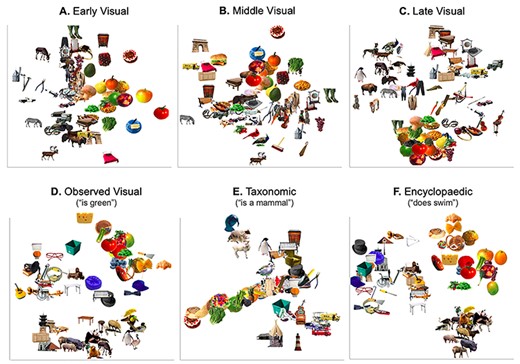
RDMs and corresponding descriptive MDS plots for the 3 visual (A: Early DNN Visual Information; B: Middle DNN Visual Information; C: Late DNN Visual Information) and 3 semantic (D: Observed infomation; E: Taxonomic Information; F: Encyclopedic Information) representations used in our analyses.
Semantic RDMs display a similar richness of detail. MDS plot for the observed semantic RDM (Fig. 3D) suggest that this RDM, like the late visual RDM, codes for the complex combinations of visual features that can distinguish some categories of objects. For example, colorful roundish objects (e.g., vegetable and fruits) can be seen on the top right, squarish darker objects (e.g., some furniture and buildings) on the left/bottom-left, and furry animals at the bottom, and birds clustered tightly in the bottom right (birds have highly correlated observable features like “has a beak” and “has feathers”). Notably, despite the obvious visual nature of these distinctions, the observed semantic RDM was created using verbal descriptions of the objects (e.g., “is round,” “is square,” “has fur”) and not the visual properties of the images themselves (RGB values, luminance, etc.). The MDS for the taxonomic visual RDM (Fig. 3E), not surprisingly, groups objects into more abstract semantic categories (e.g., edible items to the bottom-left, mammals to the top, and vehicles to the bottom-right). Finally, the MDS for the encyclopedic RDM 3 clear groupings are apparent (Fig. 3F), such that food/fruits/vegetables are clustered in the top right, animals in the bottom-right, and nonliving objects in the left side of the image. Such large-scale organization of items is most reminiscent of the organization observed by the CSA (Tyler and Moss 2001), in which living items are typically clustered tightly by highly correlated (or shared) features, while nonliving objects have smaller clusters of features with relatively more distinctive features. Nonetheless, while shared features are typically informative about object category or domain (e.g., if an object “has eyes” it is likely to be an animal, a living thing), they are not very useful for discriminating between category or domain members. In this encyclopedic MDS, the grouping of many nonliving objects appears to rely more on these distinctive features, such that the more fine-grained organization can be seen in objects grouped by features not apparent in the visual appearance (e.g., a guitar and a cabinet appear next to each other possibly because they are made of wood even though their shape is very different; eyeglasses next to a cap because they are both clothing items worn on the head, despite having different shapes and color). These encyclopedic, nonvisual features therefore engender a number of groups that may or may not overlap with the explicit semantic categories used to define our stimulus set. We note also that MDS plots are a largely qualitative, two-dimensional representation of a highly dimensional feature space (e.g., there are over 2000 individual encyclopedic features). More comprehensive, explorable MDS plots based on all the above RDMs are available for construction using the publicly available website (http://mariamh.shinyapps.io/dinolabobjects), and more fully discussed in the associated manuscript describing our object database in greater detail (Hovhannisyan et al. 2020). An additional, more general qualitative observation is that different visual or semantic features organized object concepts very differently; more quantitatively, this differentiation is captured by the relatively low correlation between all 6 RDMs (all r < 0.40, Fig. S1). These qualitative and quantitative observations therefore suggest that object representation (and by extension, object memory) is not captured by single visual or semantic similarity, but in fact may be more accurately captured by the 6 (and probably more) dimensions used herein.
Creating Activity Pattern Matrices
In addition to the model RDMs describing feature dissimilarity, we also created brain RDMs, or activity pattern matrices, which represent the dissimilarity in the voxel activation pattern across all stimuli. Thus, the activation pattern matrices (see Fig. 2) have a dissimilarity structure as the RDM with stimuli as rows. However, whereas each cell of an RDM contains a measure of dissimilarity in stimulus’ properties, each cell of an activity pattern dissimilarity matrix contains a measure of dissimilarity in activation patterns across stimuli. As noted above, the activation patterns were extracted for 388 isometric ROIs (mean volume = 255 mm3), activation values from each region were extracted, vectorized, and correlated with Pearson’s r.
Identifying Brain Regions Where the IRAF Predict Subsequent Episodic Memory
Each model RDM was correlated with the activation pattern dissimilarity matrix of each item, in each ROI to obtain an IRAF measure for each item, in each region. Spearman’s rank correlations values were Fisher transformed and mapped back to each region-of-interest. Having identified brain regions where each RDM fitted the activity pattern matrix (IRAF, see Supplementary Fig. 3), we identified regions where the IRAF for different RDMs predicted episodic subsequent memory performance. In other words, we used the IRAF as an independent variable in a regression analysis to predict memory in the conceptual and perceptual memory test. Note that such an item-wise approach differs from the typical method of assessing such second-order correlations between brain and model RDMs (Kriegeskorte and Kievit 2013; Clarke and Tyler 2014), which typically relate the entire item × item matrix at once, and thus generalize across all items that comprise the matrix, and furthermore do not explicitly assess the model fit or error associated with such a brain-behavior comparison. This more general approach therefore handicaps any attempt to capture both the predictive value of item-specific second-order similarity, as well as any attempt to capture the variation of model stimuli as a random effect (Westfall et al. 2016), which we model explicitly below within the context of a mixed-effects logistic model across all subjects and items. Concretely, this approach addresses the stimulus-as-fixed-effect fallacy (Raaijmakers 2003), towards the aim that the observed results may be generalized to other sets of object stimuli with similar visual and semantic characteristics (we note that we found no evidence that the model term for this random effect differed significantly between our 2 logistic models specified below). Thus, the IRAFs for each visual and semantic RDM were used as predictors in 2 separate mixed-effects logistic regression models to predict subsequent memory. The first model comprised the 6 IRAF types (early, middle, and late visual RDMs; observed, taxonomic, and encyclopedic semantic RDMs) to predict subsequent memory for items that were remembered in the conceptual but not the perceptual memory test (conceptual memory, positive beta estimates) or items that were remembered in the perceptual but not the conceptual memory test (perceptual memory, negative beta estimates). The second mixed-effects logistic regression model used the same IRAF values to predict items that were remembered in both memory tests (general memory, positive beta estimates) versus those forgotten in both memory tests (negative beta estimates were not examined in the current analysis). Given the large number of possible interactions (2- to 6-way interactions) of limited explanatory utility, we focus only on individual model parameters. Each ROI was tested independently. Thus, we measure the predictive effect of each model term by examining the t-statistics for the fixed effect based on beta estimates for each of the 6 IRAF types; in addition to these 6 predictors, subject and stimulus were both also entered as covariates-of-no-interest. Regarding the sample size of these models, our logistic models clearly benefit from the mixed effects model approach. While 10 events per variable is a widely advocated minimal criterion for sample size considerations in logistic regression analysis [equating to 60 observations for the 8 predictors (6 IRAF predictors +1 trial +1 subject-level regressors) in our mixed effects logistic model], there is no consensus on the approach to compute the power and sample size with logistic regression. Nonetheless, general guidelines based one the Wald test are possible for a given odd ratio and power (Demidenko 2007). Our logistic mixed effects models combine observations across all subjects for 2 separate regressions based on items remembered in one memory test but not the other (2279 trials) or general memory (3521 trials). Given conservative estimates for detectable odds ratio (e.g., 1.2), we are clearly well-powered (Cohen’s d = 0.74) to observe differences in memory-related effects. A generalized R2 statistic (Cox-Snell R2) was used to evaluate the success of each ROI-wise model, and regions with a model fit below α = 0.05 were excluded from consideration. A FDR correction for multiple comparisons was applied to all significant ROIs, with an effective t-threshold of t = 2.31.
Results
Behavioral Performance
Table 1 displays memory accuracy and response time measures in the conceptual and perceptual memory tests. We collapsed low- and high-confidence responses to old items, given the somewhat lower proportion of low-confidence responses to both old and new items (average of about 40% of responses), as well as to facilitate the logistic regression approach described below. Hit rates were significantly better for the conceptual than the perceptual memory test (|${t}_{20}$| = 2.60, P = 0.02); this difference may be due to the fact that the conceptual memory test was performed in the scanner (the same context as encoding), while perceptual memory test was, for practical purposes, performed outside of the scanner in a postscan session; however, this contextual break may have also aided in reducing the contingency for memory between individual items. Furthermore, while performance on the perceptual memory test relied only on the difference in visual features of 2 object exemplars (no new concepts were presented in the perceptual memory test), conceptual memory may have been influenced by both categorical- as well as object-level information. Nonetheless, because lures were drawn from the same conceptual categories as old items, subjects were likely forced to rely on subordinate-level representations for conceptual memory success, which therefore facilitates conceptual memory associated with specific object identities. False alarm rates did not differ between memory tests (|${t}_{20}$| = 0.76, P = 0.46). Hits were numerically faster in the conceptual than the perceptual memory test, but the difference was not significant in a mixed model (|${\chi}^2$| = 2.41, P > 0.05). To investigate the dependency between the 2 tests, we used a contingency analysis and the Yule’s Q statistic, which varies from −1.0 to 1.0, with −1 indicating a perfect negative dependency between 2 measures and 1, perfect positive dependency (Kahana 2000). The Yule’s Q for the conceptual and perceptual memory tasks results was 0.24 (see Supplementary Fig. 2A), indicating a moderate level of independency between the 2 tests. Although dependency is limited by test reliability, which is unknown for the tests employed, this finding is consistent with Bahrick and Boucher’s (1968) and Bahrick and Bahrick’s (1971) findings, and with the assumption that 2 tests were mediated by partly different memory representations. This result motivates our approach to the brain data, such that we consider the contribution of regional pattern information in predicting memory performance in 2 separate logistic models, each comprising the diagonals of a memory contingency table (Supplementary Fig. 2B): 1) a model predicting items remembered in one test and forgotten in the other, comprising conceptual memory (which we specify via the contrast [conceptually remembered and perceptually forgotten trials] > [conceptually forgotten and perceptually remembered trials]) and “perceptual memory” (which we specify via the contrast [perceptually remembered and conceptually forgotten trials] > [perceptually forgotten and conceptually remembered trials]), and 2) a model predicting items remembered in both tests from forgotten in both tests (e.g., general memory, which we specify via the contrast [conceptually remembered and perceptually remembered trials] > [conceptually forgotten and perceptually forgotten trials]).
Behavioral performance
| Conceptual memory | Perceptual memory | |||
|---|---|---|---|---|
| Response accuracy | M | SD | M | SD |
| Hit rate | 0.73 | 0.04 | 0.65 | 0.03 |
| False alarm rate | 0.34 | 0.04 | 0.34 | 0.03 |
| d′ | 1.09 | 0.14 | 0.84 | 0.12 |
| Response time (s) | ||||
| Hits | 1.50 | 0.078 | 1.37 | 0.061 |
| Misses | 1.74 | 0.096 | 1.49 | 0.072 |
Linking RSA to Subsequent Memory Performance
We examined how visual and semantic representations predicted subsequent memory in perceptual and conceptual memory tests. Visual representations were identified using RDMs based on early, middle, and late layers of a deep neural network (DNN), and semantic representations using RDMs based on observed, taxonomic, and encyclopedic semantics measures. The IRAF was used as a regressor to predict performance for items that were 1) remembered in the perceptual but not the conceptual memory test (perceptual memory), 2) remembered in the conceptual but not the perceptual memory test (conceptual memory), and 3) remembered in both tests (general memory). The distribution of IRAF unrelated to memory in these data (see Supplementary Fig. 3 and Table 1 for IRAF maps for each of the 6 RDMs) is generally consistent with both feedforward models of the ventral stream (early visual RDM showed high IRAF in early visual cortex, later visual RDM representation in more anterior object-responsive cortex, see Konkle and Caramazza 2017), as well as more recent studies focused on the representation of semantic features (e.g., extensive RSA effects in fusiform, anterior temporal, and inferior frontal regions, see Clarke and Tyler 2014). Below, we report regions where IRAFs predicted perceptual, conceptual, or general memory, first for visual RDMs and then for semantic RDMs.
Contributions of Visual Representations to Subsequent Memory Performance
Table 2 and Figure 4 show the regions where IRAF in visual RDMs significantly predicted perceptual, conceptual, or general memory, based on a mixed-effects logistic regression analysis in which the information captured in the pattern relationship between fMRI and model dissimilarity (i.e., the IRAF) was used to predict items remembered exclusively either perceptually or conceptually (i.e., the item was remembered in one test but not the other), or a separate logistic model predicting general memory success (i.e., whether a single item was remembered both conceptual and perceptual memory tests).
Regions where IRAF values for early, middle, and late visual information predicted perceptual, conceptual, or general memory
| Region | Hemi | BA | x | y | z | t |
|---|---|---|---|---|---|---|
| Perceptual memory | ||||||
| Early visual | ||||||
| Middle occipital gyrus | L | BA 18 | −14 | −100 | 14 | 2.95 |
| Middle occipital gyrus | R | BA 18 | 21 | −99 | 4 | 2.71 |
| Cuneus | R | BA 18 | 9 | −77 | 10 | 2.47 |
| Lingual gyrus | L | BA 18 | −8 | −67 | 1 | 2.27 |
| Precuneus | R | BA 31 | 14 | −60 | 22 | 2.40 |
| Middle visual | ||||||
| Middle occipital gyrus | R | BA 18 | 38 | −86 | 8 | 2.33 |
| Postcentral gyrus | L | BA 3 | −44 | −23 | 43 | 2.79 |
| Late visual | ||||||
| Inferior occipital gyrus | L | BA 18 | −34 | −90 | −6 | 2.43 |
| Conceptual memory | ||||||
| Early visual | ||||||
| Middle occipital gyrus | L | BA 19 | −53 | −67 | −10 | 2.25 |
| Precentral gyrus | L | BA 6 | −36 | −16 | 60 | 2.36 |
| Medial frontal gyrus | R | BA 11 | 5 | 48 | −7 | 2.41 |
| Middle visual | ||||||
| Lingual gyrus | L | BA 18 | −11 | −97 | −11 | 2.74 |
| Fusiform gyrus | L | BA 19 | −28 | −70 | −12 | 2.40 |
| Precuneus | L | BA 7 | −5 | −67 | 53 | 2.46 |
| Temporal pole | R | BA 38 | 39 | 18 | −39 | 2.35 |
| Superior frontal gyrus | L | BA 8 | −30 | 22 | 50 | 2.39 |
| Late visual | ||||||
| Cuneus | R | BA 19 | 7 | −93 | 21 | 2.79 |
| Inferior temporal gyrus | R | BA 20 | 50 | −15 | −34 | 2.32 |
| Middle frontal gyrus | L | BA 9 | −31 | 34 | 36 | 2.24 |
| Superior frontal gyrus | L | BA 10 | −24 | 44 | 30 | 3.07 |
| General memory | ||||||
| Early visual | ||||||
| Middle occipital gyrus | L | BA 18 | −14 | −100 | 14 | 4.24 |
| Cuneus | L | BA 19 | −7 | −94 | 22 | 2.68 |
| Lingual gyrus | L | BA 17 | −7 | −82 | −1 | 2.63 |
| Middle temporal gyrus | R | BA 39 | 42 | −76 | 18 | 2.70 |
| Lingual gyrus | R | BA 19 | 21 | −67 | −7 | 2.67 |
| Superior parietal lobule | R | BA 7 | 25 | −51 | 66 | 2.62 |
| Posterior cingulate | R | BA 29 | 5 | −50 | 11 | 2.81 |
| Inferior parietal lobule | L | BA 40 | −39 | −41 | 51 | 3.00 |
| Inferior temporal gyrus | L | BA 20 | −37 | −19 | −30 | 2.82 |
| Hippocampus | R | 21 | 0 | −28 | 2.31 | |
| Inferior frontal gyrus | R | BA 45 | 54 | 18 | 19 | 2.36 |
| Inferior frontal gyrus | L | BA 45 | −48 | 20 | 20 | 2.65 |
| Middle frontal gyrus | R | BA 46 | 49 | 25 | 32 | 2.40 |
| Middle visual | ||||||
| Middle temporal gyrus | R | BA 21 | 58 | 7 | −7 | 2.73 |
| Precentral gyrus | L | BA 6 | −58 | 2 | 21 | 2.56 |
| Late visual | ||||||
| Middle occipital gyrus | R | BA 19 | 50 | −66 | −10 | 3.01 |
| Inferior temporal gyrus | L | BA 20 | −59 | −53 | −16 | 2.48 |
| Middle temporal gyrus | L | BA 21 | −60 | −53 | 2 | 2.42 |
| Precentral gyrus | R | BA 6 | 57 | −15 | 46 | 2.40 |
| Hippocampus | R | 21 | 0 | −28 | 2.32 | |
| Inferior frontal gyrus | R | BA 45 | 41 | 47 | 9 | 3.20 |
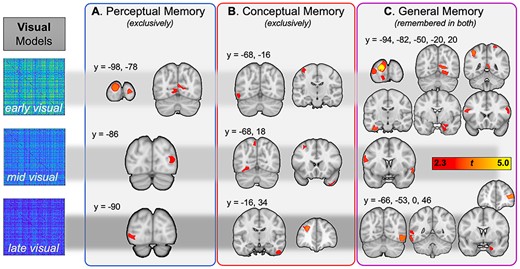
Visual information predicting subsequent perceptual memory, conceptual memory, and general memory. The first row represents regions where memory was predicted by early visual (layer 2 from VGG16) information, the second row corresponds to middle visual (layer 12), and the last row to late visual (layer 22) information.
Perceptual memory
The IRAF for the early visual RDM predicted perceptual memory in multiple early visual regions, in keeping with the expectation that information about basic image properties would selectively benefit subsequent visual recognition. The IRAFs of the middle and late visual RDMs also predicted perceptual memory in early visual areas, though these comprise regions further along the ventral stream (generally LOC), and therefore suggest a forward progression in the complexity of visual representations that lead to later perceptual memory. Thus, the visual representations predicting Perceptual Memory (Fig. 4A) were encoded primarily in visual cortex.
Conceptual memory
In contrast with perceptual memory, the visual representations that predicted conceptual memory were encoded in more anterior regions (Fig. 4B). These more anterior regions included the fusiform gyrus, precuneus, and the right temporal pole for the middle visual RDM, and lateral temporal cortex and frontal regions for the late visual RDM. This result suggests that the influence of specific types of information in object representations on the subsequent memory of those memoranda depend not only on the content of the information but also on where that information is expressed. That our novel approach reveals that differences in representational information may emerge outside of that regions traditionally associated with object information independent of its mnemonic strength (see Supplementary Fig. 3).
General memory
Finally, memory for items that were remembered in both perceptual and conceptual memory tests, or general memory, was predicted by the IRAFs of visual RDMs in many brain regions (Fig. 4C). The influence of the early visual RDM was particularly strong, including visual, posterior midline, hippocampal, and frontal regions. In comparison, for visual information based on middle-layer DNN information (layer 12 of the VGG16 model) the right middle temporal gyrus and left precentral gyrus made significant contributions to general memory. Lastly, late visual information (based on the final convolutional layer of our DNN, or layer 22 of the VGG16) was critical for general memory in lateral occipital cortex (BA19), left inferior and middle temporal gyri, right hippocampus, and the right inferior frontal gyrus. The effects in the hippocampus are particularly interesting given the critical role of this structure for episodic memory, and evidence that it is critical it is essential for both perceptual and conceptual memory (Prince et al. 2005; Martin et al. 2018; Linde-Domingo et al. 2019).
Contributions of Semantic Representations to Subsequent Memory Performance
Turning to semantic information, we examined how perceptual, conceptual, and general memory were predicted, for each individual trial in each participant, by the 3 types of semantic information: observed (e.g., “is round”), taxonomic (e.g., “is a fruit”), and encyclopedic (e.g., “is sweet”). The results are shown in Table 3 and Figure 5.
Regions where IRAF values in observed, semantic, and encyclopedic semantic RDMs predicted perceptual, conceptual, or general memory
| Region | Hemi | BA | x | y | z | t |
|---|---|---|---|---|---|---|
| Perceptual memory | ||||||
| Observed semantic RDM | ||||||
| Lingual gyrus | L | BA 18 | −5 | −82 | −10 | -2.76 |
| Precentral gyrus | L | BA 6 | −21 | −24 | 64 | -2.46 |
| Superior temporal gyrus | L | BA 22 | −53 | −18 | 0 | -2.43 |
| Taxonomic semantic RDM | ||||||
| No significant effects | ||||||
| Encyclopedic semantic RDM | ||||||
| Middle temporal gyrus | L | BA 21 | −62 | −19 | −4 | -2.42 |
| Middle temporal gyrus | R | BA 21 | 64 | −12 | −3 | -2.58 |
| Conceptual memory | ||||||
| Observed semantic RDM | ||||||
| Inferior frontal gyrus | L | BA 47 | −37 | 25 | 1 | 2.61 |
| Inferior frontal gyrus | R | BA 47 | 35 | 26 | −10 | 2.43 |
| Taxonomic semantic RDM | ||||||
| Fusiform gyrus | R | BA 20 | 40 | −28 | −23 | 2.28 |
| Inferior temporal gyrus | L | BA 20 | −55 | −16 | −31 | 2.64 |
| Perirhinal cortex | R | BA 35 | 24 | −15 | −30 | 2.33 |
| Perirhinal cortex | L | BA 36 | −20 | −4 | −30 | 2.41 |
| Precentral gyrus | R | BA 6 | 59 | −11 | 31 | 2.82 |
| Encyclopedic semantic RDM | ||||||
| Fusiform gyrus | R | BA 19 | 36 | −72 | −14 | 2.56 |
| Inferior frontal gyrus | R | BA 46 | 45 | 38 | 21 | 2.93 |
| Middle frontal gyrus | R | BA 10 | 29 | 39 | 31 | 2.33 |
| Frontal pole | R | BA 10 | 21 | 67 | 0 | 2.33 |
| General memory | ||||||
| Observed semantic RDM | ||||||
| Middle occipital gyrus | L | BA 18 | −14 | −100 | 14 | 2.37 |
| Cuneus | L | BA 18 | −6 | −96 | 3 | 2.30 |
| Superior occipital gyrus | L | BA 19 | −38 | −79 | 27 | 2.58 |
| Precuneus | R | BA 31 | 15 | −72 | 21 | 2.46 |
| Angular gyrus | L | BA 39 | −44 | −68 | 24 | 3.21 |
| Angular gyrus | R | BA 39 | 46 | −67 | 24 | 2.77 |
| Inferior frontal gyrus | L | BA 45 | −48 | 20 | 20 | 2.33 |
| Taxonomic semantic RDM | ||||||
| No significant effects | ||||||
| Encyclopedic semantic RDM | ||||||
| No significant effects | ||||||
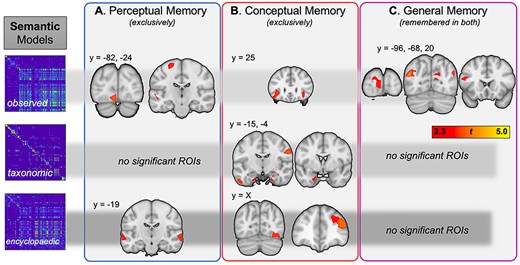
Semantic information predicting subsequent perceptual memory, conceptual memory, and general memory. The first row represents regions where memory was predicted by observed semantic information (e.g., “is yellow,” or “is round”), the second row corresponds to taxonomic information (e.g., “is an animal”), and the last row to more abstract, encyclopedic (e.g., “lives in caves”, or “is found in markets”) information.
Perceptual memory
Perceptual memory (Fig. 5A) was predicted by observed semantic features stored in occipital areas associated with visual processing and left lateral temporal associated with semantic processing. These results are consistent with the fact that observed semantic features (e.g., “a banana is yellow”) are a combination of visual and semantic properties. Perceptual memory was also predicted by encyclopedic semantic features (e.g., “bananas grow in tropical climates”) stored in lateral temporal regions. This effect could reflect the role of preexistent knowledge in guiding processing of visual information.
Conceptual memory
Regions where IRAF for semantic RDMs predicted conceptual memory (Fig. 5B) included the left inferior prefrontal cortex for the observed semantic RDM, the perirhinal cortex for the taxonomic semantic RDM, and dorsolateral and anterior frontal regions for the encyclopedic semantic RDM. The left inferior prefrontal cortex is a region strongly associated with the executive control of semantic processing (Badre and Wagner 2007; Jefferies et al. 2008). Perirhinal cortex is an area associated with object-level visual processing and basic semantic processing (Cowell et al. 2010; Tyler et al. 2013). Dorsolateral and anterior prefrontal regions are linked to more complex semantic elaboration (Blumenfeld and Ranganath 2007). Thus, conceptual memory was predicted by semantic representations in several regions associated with semantic cognition.
General memory
Lastly, memory in both tests (Fig. 5C) was predicted only by the IRAF of the observed semantic RDM but not by the IRAF of taxonomic or encyclopedic RDMs. Given that these 2 RDMs predicted conceptual memory, these results suggest that mid and higher level semantics contribute specifically to conceptual but not to perceptual memory tasks. The regions where observed semantic representations predicted general memory included the left inferior prefrontal cortex and the angular gyrus. As mentioned above, the left inferior prefrontal cortex is an area strongly associated with semantic processing (Badre and Wagner 2007). The angular gyrus is also intimately associated with semantic processing (Binder et al. 2009), and there is evidence that representations stored in this region are encoded and then reactivated during retrieval (Kuhl et al. 2012).
Lastly, in order to address the possibility that our novel RSA-based analyses were simply reflecting univariate differences in BOLD-related activity between remembered and forgotten trials, we completed a post hoc analysis of the SME maps for each memory test and compared these maps with the logistic model output described above. As outlined in the Supplementary Results (Fig. S4 and Table S2), we found little to no overlap between univariate SME effects (conceptual or perceptual) and our RSA results, suggesting that RSA provides qualitatively novel information on the encoding processes supporting successful object memory formation.
Discussion
In the current study, we tested the degree to which visual and semantic information could account for the shared and distinct components of conceptual and perceptual memory for real-world objects. We have shown that the encoding of the same object yields multiple memory representations (e.g., different kinds of visual and semantic information) that differentially contribute to successful memory depending on the nature of the retrieval task (e.g., perceptual vs. conceptual). Our results provide evidence that while some of the patterns of information commensurate with the retrieval demands are beneficial for memory success, the full pattern of regions predictive of memory performance extends beyond these perception-related regions, and suggest broader networks of regions may ultimately support different forms of conceptual or perceptual memory. For example, our analysis of selective perceptual memory success shows that this form of memory relied on visual information processing in visual cortex, while conceptual memory relied on semantic representations in fusiform, perirhinal, and prefrontal cortex—regions typically associated with this form of knowledge representation. However, we also found evidence for a more distributed pattern of mnemonic support not predicted by such a simple view, such that conceptual memory benefitted from visual information processing in more anterior regions, (lateral temporal and medial/lateral prefrontal regions), while perceptual memory benefitted from semantic feature information processing in occipital and lateral temporal regions. Lastly, general memory success, which represents strong encoding for items remembered both in the perceptual and conceptual memory tests, identified differential patterns of regions relying on distinct forms of information, with visual representations predicting general memory in a large network of regions that included inferior frontal, dorsal parietal, and hippocampal regions, while semantic representations supporting general memory success was expressed in bilateral angular gyrus. The contributions of visual and semantic representations to subsequent memory performance are discussed in separate sections below.
Contributions of Visual Representations to Subsequent Memory Performance
Visual representations were identified using RDMs based on a DNN with 3 levels of visual representations based on early, middle, and late DNN layers. The use of DNNs to model visual processing along the occipitotemporal (ventral) pathway is becoming increasingly popular in cognitive neuroscience of vision (for review, see Kriegeskorte and Kievit 2013). Several studies have found that the internal hidden neurons (or layers) of DNNs predict a large fraction of the image-driven response variance of brain activity at multiple stages of the ventral visual stream, such that early DNN layers correlate with brain activation patterns predominately in early visual cortex and late layers, with activation patterns in more anterior ventral visual pathway regions (Leeds et al. 2013; Khaligh-Razavi and Kriegeskorte 2014; Güçlü and van Gerven 2015; Kriegeskorte 2015; Wen et al. 2017; Rajalingham et al. 2018). Consistent with our results, imagined (vs. perceived) visual representations show a greater second-order similarity with later (vs. early) DNN layers (Horikawa and Kamitani 2017), suggesting a homology between human and machine vision information and their relevance for successful memory formation. However, none of these studies—to our knowledge—have used DNN-related activation patterns to predict subsequent episodic memory.
Notably, many of the regions coding for SME for visual information (Fig. 4) lie outside of regions coding for the original perception (Supplementary Fig. 3). Episodic encoding, however, is not simply a subset of perception, and only some information related to a given level of analysis may be encoded, and only a subset of that information may be consolidated. While visual features are likely to be primarily encoded in posterior regions, the representation of those features may be encoded in regions beyond the location of regions traditionally associated with their original encoding, given evidence for color and shape encoding in parietal (Song and Jiang 2006) and prefrontal cortices (Fernandino et al. 2016). Furthermore, it is also reasonable to expect that regions coding for the second-order similarity between brain and model similarity (i.e., our IRAF regressors) with values below a statistical threshold (and therefore not visible in the IRAF maps in Supplementary Fig. 3) can nonetheless have a significant effect on the dependent variable (subsequent memory). Our results therefore highlight not only the contribution of visual regions to visual information consolidation (a rather limited view), but also of any region differentially encoding RDM similarity for a given object.
Like Bahrick and Boucher (1968) and Bahrick and Bahrick (1971), we hypothesized that visual representations would differentially contribute to the perceptual memory test and semantic representations, to the conceptual memory test. However, the results showed that representations predicted subsequent memory not only depending on the kind of representation and the type of test, but also depending on where the representations were located. In the case of visual representations, we found that they predicted perceptual memory when located in visual cortex but conceptual memory when located in more anterior regions, such as lateral/anterior temporal and medial/lateral prefrontal regions. For the perceptual and conceptual memory tests, this pattern was consistent regardless of which layer of the DNN was used (though there was some forward progression within the visual system). However, for general memory, we observed a much more widespread pattern of memory prediction scores, especially with early DNN layer. While the more widespread pattern may be attributable to the increasingly semantic (or categorical) information inherent in later DNN layers, it is unlikely that early DNN layers carry such information.
We do not have a definitive explanation of why the impact of different representations on subsequent memory depended on their location, but we can provide 2 hypotheses for further research. A first hypothesis is that the nature of representations changes depending on the location where they are stored in ways that cannot be detected with the current RSA analyses. Thus, it is possible that these different aspects of early visual representations, in the way we defined them, are represented in different brain regions and contribute differently to perceptual and conceptual memory tests. Our second hypothesis, which not incompatible with the first, is that representations are the same in the different regions, but that their contributions to subsequent memory vary depending on how a particular region contributes to different brain networks during retrieval. Evidence for such “impure” representations are in fact intuitive with the notion that visual and semantic representations form a multidimensional continuum, with early visual elements like color and shape often indicative of object category or identity, and that these predictive elements may be coded outside of regions traditionally associated with processing that element. For instance, when early visual representations are stored in occipital cortex, they might contribute in to a posterior brain network that differentially contributes to subsequent perceptual memory, whereas when the same representations are stored in the temporal pole, they might play a role in an anterior brain network that differentially contributes to conceptual memory. Such an interpretation would be somewhat inconsistent with a DNN-level interpretation of the visual system, given the one-to-one mapping of DNN information to areas of cortex. Furthermore, this hypothesis is not supported by our analysis of the similarity of 3 DNN-layers independent of memory (first 3 rows of Supplementary Fig. 3), which demonstrate a generally well accepted ventral stream pattern of IRAF values. The assumption that such models evolve progressively from simple RGB pixels to more hierarchical clustering of semantically meaningful object organization (as dictated by their training), and that this progression mirrors what is happening in the human visual system, may be flawed in its reliance on a parallel, unidirectional approach to object processing. More recent work incorporating recurrent DNNs and their application to dynamic brain states may help to address this ambiguity in the representational flow of human object processing, as recurrence may be necessary to capture the representational dynamics of human object recognition (Kietzmann et al. 2019; Chien and Honey 2020; Ester et al. 2020). Nonetheless, our analysis considered each region separately in our memory prediction analysis, it is impossible to discount this network-level hypothesis without a more complex multivariate analysis that would capture representation-level interactions between regions. This interaction between representations and brain networks could also be investigated using methods such as representational connectivity analyses (Coutanche and Thompson-Schill 2013).
Visual representations also contributed to performance in both memory tests (general memory). In addition to the same broad areas where visual representations predicted perceptual and conceptual memory, general memory effects were found in inferior frontal, parietal, and hippocampal regions. Inferior frontal (Spaniol et al. 2009) and parietal, particularly dorsal parietal regions (Uncapher and Wagner 2009), have been associated with successful encoding, with the former associated with control processes and the latter, with top-down attention processes. The finding that visual representations in the hippocampus contributed to both memory tests is consistent with abundant evidence that this region stores a variety of different representations, including visual, conceptual, spatial, and temporal information (Nielson et al. 2015; Mack et al. 2016; Tompary and Davachi 2020) and contributes to vivid remembering in many different episodic memory tasks (Kim 2011). Alternatively, this common contribution of the hippocampus to both memory tests may be driven by a common, amodal representation; in our paradigm, the fixed order of conceptual then perceptual memory test may have promoted perceptual memory for items earlier remembered in the conceptual memory test. However, we did not find strong evidence for this effect in our data, and conceptual recognition on a given item concept did not strongly predict perceptual recognition, as indicated by the low dependency (Yule’s Q = 0.24) between these 2 tests. Furthermore, although our logistic regression approach forced visual and semantic forms of information to compete for variance in predicting subsequent memory, questions remain on the interactions between these forms of information within specific regions, and further research is required to confirm these interactions using more stringent tests such as representation type by test type interactions. Directly relevant to the current study, Prince et al. (2005) investigated univariate activity associated with subsequent memory for both visual (word-font) and semantic (word-word) associations, and though (as in the current study), many regions demonstrated a context-specific manner, such that visual memory success was largely associated with occipital regions, while encoding success for semantic associations was predicted by activity in ventrolateral PFC. However, only one region was associated with memory success for both semantic and perceptual encoding success: the hippocampus, and the confluent findings between this study and our own suggests an important cross-modal similarity between univariate and multivariate measures of encoding success.
Contributions of Semantic Representations to Subsequent Memory Performance
As in the case of visual representations, the contributions of semantic representations to subsequent memory depended not only on the test, but also on the locations in which these representations were stored. For example, the semantic representations related observed semantic features contributed to perceptual memory in posterior visual regions, to conceptual memory in the left inferior frontal gyrus, and to general memory in the angular gyrus. These latter brain regions have been strongly associated with semantic processing (Badre and Wagner 2007) and with semantic elaboration during successful episodic encoding (Prince et al. 2007). The finding that observed semantic representations in the angular gyrus predicted both perceptual and conceptual memory is consistent with the emerging view of this region as the confluence of visual and semantic processing (Binder et al. 2005; Devereux et al. 2013). In fact, this region is assumed to bind multimodal visuo-semantic representations (Yazar et al. 2014; Tibon et al. 2019) and to play a role in both visual and semantic tasks (Binder et al. 2009; Constantinescu et al. 2016). Although the angular gyrus often shows deactivation during episodic encoding (Daselaar et al. 2009; Huijbers et al. 2012), representational analyses have shown that this region stores representations during episodic encoding that are reactivated during retrieval. For example, Kuhl and colleagues found that within angular gyrus, an MVPA classifier trained to distinguish between face-word and scene-word trials during encoding, successfully classified these trials during retrieval, even though only the words were presented (Kuhl and Chun 2014).
Taxonomic semantic representations predicted conceptual memory in perirhinal cortex. This result is interesting because this region, at the top of the visual processing hierarchy and directly associated with anterior brain regions, is strongly associated with both visual and semantic processing (Clarke and Tyler 2014; Martin et al. 2018). Patients who have category-specific semantic deficits know the category of an object, but they are exceptionally poor at differentiating between similar objects within a category, often finding difficulty in correctly rejecting semantically confusable words and pictures (Moss et al. 2005; Wright et al. 2015). Previous authors have linked these lesion-based findings to a hierarchical neurobiological system of increasing feature complexity along the ventral stream (Ungerleider and Haxby 1994) in which simple visual features are processed in more posterior sites, with increasingly complex conjunctions of features more anteriorly, culminating to more complex feature conjunctions in the perirhinal cortex (Cowell et al. 2010; Barense et al. 2012). However, in our analyses the contribution of this region to subsequent episodic memory was limited to semantic features, specifically taxonomical, and to the conceptual memory test. The contributions of perirhinal cortex to visual and semantic processing have been linked to the binding of integrated objects representations (Clarke and Tyler 2014; Martin et al. 2018). Although integrated object representations clearly play a role in the perceptual memory test, success and failure in this task depends on distinguishing between very similar exemplars, which requires access to individual visual features. Conversely, object-level representations could be more useful during retrieval when only words are provided by the test. This speculative idea could be tested by future research.
Finally, an interesting finding was the fact that general memory was predicted by observed semantic representations, but not by taxonomic and encyclopedic semantic representations. This result is intuitive when considering that while category-level information is useful in representing an overall hierarchy of knowledge (Connolly et al. 2012) such information provides a rather weak mnemonic cue (“I remember I saw a fruit…”), and such information is typically not sufficient for identifying a specific object. In this case, more distinctive propositional information is necessary for long-term memory (Konkle et al. 2010), and most readily suggested by observational semantics (“I saw a ‘yellow’ pear”). The utility of concept versus domain-level naming may shed some light on the utility of general hierarchical knowledge (e.g., taxonomic or category labels) versus more specific conceptual information (e.g., observed details or encyclopedic facts) in predicting later memory. Concepts with relatively more distinctive and more highly correlated distinctive relative to shared features have been shown to facilitate basic-level naming latencies, while concepts with relatively more shared features facilitates domain decisions (Taylor et al. 2012). While drawing a direct link between naming latencies and memory may be somewhat tenuous, the implication is that the organization of some kinds of conceptual information may promote a domain versus item-level comprehension. Nonetheless, more work must be done at the level of individual items to identify strong item-level predictors of later memory, and this work identifies an item-level technique for relating these kinds of complex conceptual structures with brain pattern information. Furthermore, our findings also challenge the dominant view that regions of the ventral visual pathway exhibit a primary focus for category selectivity (Bracci et al. 2017); given that these models are typically tested with “semantic” information that is comprised of categorical delineations (e.g., faces vs. scenes), it is often unsurprising to find general classification accuracy in fusiform cortex. Nonetheless, when considering either middle visual information, or encyclopedic information—both of which demonstrate significant memory prediction scores in our analysis—suggest that such an apparent category selectivity in this region is dependent on both a more basic processing of visual features, as well as more abstract indexing of the abstract encyclopedic features.
Conclusion
In sum, the results showed that a broad range of visual and semantic representations predicted distinct forms of episodic memory depending not only on the type of test but also on the brain region where the representations were located. Much of our observed results were consistent with the dominant view in the cognitive neuroscience of object vision, that regions in the ventral visual pathway represent a progression of increasingly complex visual representations, and we find multiple pieces of evidence that such visual representations (based on a widely used DNN model) predicted both perceptual memory and general memory when in primary and extended visual cortices. Furthermore, this visual information made significant contributions to both general and conceptual memory when such processing was localized to more anterior regions, (lateral/anterior temporal, medial/lateral prefrontal regions, hippocampus). In turn, semantic representations for observed visual features predicted perceptual memory when located in visual cortex, conceptual memory when stored in the left inferior prefrontal cortex, and general memory when stored in the angular gyrus, among other regions. Taxonomic and encyclopedic information made contributions limited largely to conceptual memory, in perirhinal and prefrontal regions, respectively.
This is—to our knowledge—the first evidence of how different kinds of representations contribute to different types of memory tests. One general observation of these data is that representations are multifaceted and their impact on subsequent memory depends on representation type, test type, and region location. The current study attempts to expand the list of reliable taxonomy of representation types, based on unique (but interrelated) visual and semantic feature information. The 6-way taxonomy used here is based on the strong influences in the visual and semantic processing literatures, but clearly other reasonable classifications are also possible. Such a set of findings helps to expand our view on the importance of regions outside those typically found in similar RSA analyses of visual properties based on DNN information (Devereux et al. 2018; Fleming and Storrs 2019). Thus, many regions appear to be guided by the general principle of transfer-appropriate processing (Morris et al. 1977; Park and Rugg 2008), such that congruency between the underlying representational information and the form in which it is being tested leads to successful memory. Nonetheless, we also find evidence for regions outside those traditionally associated with the processing of early or late visual information making significant contributions to lasting representations for objects. We offer 2 hypotheses for this pattern of findings: first is the hypothesis that the nature of representations varies depending on the region in which they are located, whereas a second—not mutually exclusive—hypothesis is that the nature of representations is constant but what varies is the role they play within brain networks. The first hypothesis could be examined by further examining one kind of representation with multiple RSA analyses and multiple tasks, and the second by connecting representations with brain networks, perhaps via representational connectivity analyses. Furthermore, our results suggest that each region stores not just one type of information but a combination of different types. The path to clarifying the complexity of representation types, representation locations, test types, and their interactions is long and winding road, but we believe the current study is a step in the right direction.
Notes
The authors would like to thank Aude Oliva and Wilma Bainbridge for help in the conception of this project, and Alex Clarke for helpful comments on the manuscript.
Funding
National Institute of Aging (R01AG036984, K01AG053539).
References
Worsley KJ, Friston KJ. (1995). Analysis of fMRI time-series revisited–again.