


Abstract
To go beyond the disconnectivity hypothesis of schizophrenia, directed (effective) connectivity was measured between 94 brain regions, to provide evidence on the source of the changes in schizophrenia and a mechanistic model. Effective connectivity (EC) was measured in 180 participants with schizophrenia and 208 controls. For the significantly different effective connectivities in schizophrenia, on average the forward (stronger) effective connectivities were smaller, whereas the backward connectivities tended to be larger. Further, higher EC in schizophrenia was found from the precuneus and posterior cingulate cortex (PCC) to areas such as the parahippocampal, hippocampal, temporal, fusiform, and occipital cortices. These are backward effective connectivities and were positively correlated with the positive symptoms of schizophrenia. Lower effective connectivities were found from temporal and other regions and were negatively correlated with the symptoms, especially the negative and general symptoms. Further, a signal variance parameter was increased for areas that included the parahippocampal gyrus and hippocampus, consistent with the hypothesis that hippocampal overactivity is involved in schizophrenia. This investigation goes beyond the disconnectivity hypothesis by drawing attention to differences in schizophrenia between backprojections and forward connections, with the backward connections from the precuneus and PCC implicated in memory stronger in schizophrenia.
Introduction
Schizophrenia is a disorder often characterized by positive, cognitive, and negative symptoms (Mueser and McGurk 2004), which may have different neurobiological bases (Rolls et al. 2008; Rolls 2012a). The positive (psychotic or thought disorder) symptoms may include hallucinations, delusions, and paranoia. The cognitive symptoms may include a failure to maintain attention, and deficits in short-term memory that is required to maintain attention. The negative symptoms may include reduced emotion and motivation, including reduced hedonia. It has been shown that the major difference between patients is in the negative symptoms (Rolls et al. 2017), measured with the positive and negative syndrome scale (PANSS) (Kay et al. 1987).
The etiology and neuropathophysiological mechanism of this debilitating and severe disorder remain unclear. Evidence for structural and functional deficits in the brain of schizophrenia has been developed into a disconnectivity hypothesis (Friston and Frith 1995). More direct evidence for the disconnectivity hypothesis comes mainly from functional magnetic resonance imaging (fMRI) studies, particularly resting-state fMRI studies, which have shown widespread functional disconnectivity in distributed brain networks in schizophrenia (Khamsi 2012; Smith 2012; Friston et al. 2016; Northoff and Duncan 2016). However, very consistent patterns and principles of altered connectivity in schizophrenia remain somewhat elusive (Meyer-Lindenberg 2010; Whitfield-Gabrieli and Ford 2012; Northoff and Duncan 2016). In one study, first-episode patients had many differences in functional connectivity (FC) involving the inferior frontal gyri (Broca’s area), and these changes were correlated with delusion / blunted affect (Li et al. 2017).
Resting state FC, which reflects correlations in the activity between brain areas, is widely used to help understand human brain function in health and disease (Deco and Kringelbach 2014; Cheng et al. 2016). Here we go beyond FC to effective connectivity (EC) between different brain areas to measure directed influences of human brain regions on each other. EC is conceptually very different, for it measures the effect of one brain region on another in a particular direction, and can in principle therefore provide information more closely related to the causal processes that operate in brain function, that is, how one brain region influences another. In the context of disorders of brain function, the EC may provide evidence on which brain regions may have altered function, and then influence other brain regions, by comparing EC in patients and control participants.
In this paper we utilize a new approach to the measurement of EC in which each brain area has a simple dynamical model, and known anatomical connectivity is used to provide constraints (Gilson et al. 2016; Gilson et al. 2018; Rolls et al. 2018). This helps the approach to measure the EC between the 94 automated anatomical atlas (AAL2) (Rolls et al. 2015) brain areas using resting-state fMRI. (The names of the AAL2 areas are shown in Supplementary Table S1, and the areas can be viewed with the Mricron viewer.) Moreover, we show how the approach can be used to measure the differences in EC between different groups of individuals, using as an example EC in the healthy brain and in individuals with schizophrenia. This results in the first brain-wide resting state effective-connectivity neuroimaging analysis of schizophrenia.
Materials and Methods
Participants
There were 180 patients with a diagnosis of schizophrenia, and 208 healthy controls. The patients were from Taiwan (Veteran General Hospital, Taipei), and the Center for Biomedical Research Excellence (COBRE, http://fcon_1000.projects.nitrc.org/indi/retro/cobre.html) (Mayer et al. 2013; Cheng et al. 2015a). All patients were diagnosed according to the DSM-IV diagnostic criteria by qualified psychiatrists using a best estimate procedure that utilized all available clinical information including a diagnostic interview, clinical case notes, the clinician’s observations, and informant reports. Symptom severity was measured using the PANSS assessment (Kay et al. 1987) given to all patients either one week before the MRI scan or one week after it. All patients were medicated. Table S2 provides a summary of the demographic information and the psychiatric diagnosis of the participants, and fuller information is provided in the Supplementary material.
Data acquisition and preprocessing
All the Taiwan and COBRE imaging data were acquired using a 3-T Siemens Trio Tim MRI scanner with an 8- or a 12- channel phased array head coil. Participants were instructed to relax, hold still, keep their eyes closed, and think of nothing in particular. The Supplementary material provides additional details of the imaging acquisition.
Resting-state fMRI data were preprocessed using FMRIB Software Library (FSL) (Jenkinson et al. 2012) and Analysis of Functional NeuroImages (AFNI) (Cox 1996). For each individual, the preprocessing steps included slice-timing correction (FSL slicetimer), motion correction (FSL mcflirt), spatial smoothing by a 3D Gaussian kernel (FWHM = 6 mm), despiking motion artifacts using the Brain-Wavelet Toolbox (Patel et al. 2014), registering to a 3 × 3 × 3 mm3 standard space by first aligning the functional image to individual T1 structural images using boundary based registration (Greve and Fischl 2009) and then to standard space using FSL’s linear and non-linear registration tool (FSL flirt and fnirt), white matter signal, cerebrospinal fluid signal. The global signal was not regressed out for reasons provided by (Cheng et al. 2016). Care was taken to avoid any effects of head motion by regressing out nuisance covariates including Friston’s 24-head motion parameters, and by excluding data from participants with any head motion >0.5 mm. In addition, mean head motion was regressed out of all analyses. Further, no significant differences in head motion were found between the patients and controls. No temporal filtering was used (in order to provide the best time resolution for the EC, but the linear changes in the blood oxygenation-level dependent (BOLD) signal time series were regressed out to remove any linear trends in the data). We checked and confirmed that the main results shown in this paper, for example, the difference between the connectivity in the forward and backward directions in schizophrenia described below, were not found only with this filtering, for very similar results were obtained when the full dataset was re-preprocessed with the high pass temporal filtering set to the more usual 0.01 Hz, so that the temporal filter was 0.01–max Hz, as shown in the Supplementary material. All the images were manually checked to ensure successful preprocessing. The resulting time courses were used for the construction and analysis of the brain network.
After preprocessing, the whole brain (gray matter) was parcellated into 94 anatomically defined regions using the automated anatomical labeling atlas (AAL2; Rolls et al. 2015) that includes a useful parcellation of the orbitofrontal cortex. The time series were extracted in each region by averaging the signals of all voxels within that region. The names of the regions are provided in Supplementary Table S1.
EC measurement
Introduction
A classical approach to measuring EC is dynamic causal modeling (DCM) (Friston 2009; Valdes-Sosa et al. 2011; Bajaj et al. 2016). DCM is often used with circuits consisting of a priori selected brain regions to test hypotheses on the interactions between the considered regions. Here we instead use a network model with simpler assumptions than those typically used in DCM to perform a large-scale connectivity analysis involving many brain areas (Gilson et al. 2016). This allows for the very efficient calculation of maximum-likelihood EC estimates for a large number (94) of nodes, individually for a large cohort of participants. In this way we target significant EC differences for all existing connections (as determined by diffusion tensor imaging [DTI]) that characterize schizophrenia with FDR correction and without preliminary knowledge, expecting a distributed pattern of abnormal EC links across the brain. Our estimation procedure (Gilson et al. 2016) iteratively optimizes a network model such that it reproduces the empirical cross-covariances between ROIs, which are canonically related to the cross-spectral density used in recent studies that apply DCM to resting-state fMRI data (Friston et al. 2014; Razi et al. 2017). The model uses an exponential approximation of BOLD autocovariance (locally over a few TRs) and discards very slow-frequency fluctuations. Moreover, by using data without temporal filtering, we were able to dispense with a model of haemodynamic mapping neuronal activity to fMRI signals, as the corresponding time constants are faster (Friston 2002). Finally, we place positivity constraints on extrinsic or between node connections—in line with known neuroanatomy and previous modeling studies (Marreiros et al. 2008). A last simplification compared to DCM includes a fixed (but plausible) form of endogenous neuronal fluctuations (Σ in our model) that were characterized by a single (variance) parameter in each region or node. In spite of these differences, we still borrow the term “effective connectivity” from the DCM literature as our connectivity estimates relate to directional interactions between ROIs in the brain network. This model-based approach has been successfully applied to identify changes in the cortical coordination between rest and movie viewing (Gilson et al. 2018), and to EC in depression (Rolls et al. 2018).
Compared to DCM the new method used here (Gilson et al. 2016) is computationally more efficient and thus can analyze larger networks because it limits the degrees of freedom for each brain region by utilizing a simpler model of each brain region, and because it uses some structural connectivity information from, for example, DTI. Further, the new EC method focuses on transitions between fMRI “activity states” across successive time points (Mitra et al. 2015) and does not include details about hemodynamics like the Balloon model (Friston et al. 2000). The estimated EC measures the strengths of causal interactions from one brain area to another, via the proxy of BOLD fluctuations; it provides a single number that lumps together the effects of the strength of the synapse, and neurotransmitter release, etc. The synaptic conductivity interpretation also relates to our earlier neuron-level models in which the synaptic conductivity between modules is a key parameter that specifies how much one module influences another module (Rolls et al. 2012). The new method has the additional advantage that each brain region or module has its own Σ parameter that specifies the variance of the module’s activity, which may be related to the intrinsic excitability of the region. In relation to our integrate-and-fire models, the parameter w + that defines the strength of the recurrent collateral synapses within the attractor network (Rolls et al. 2012) may relate to the Σ parameter in the current EC approach (Gilson et al. 2016), because the local feedback influenced by w + influences the fluctuations of the activity, for example, how readily an area will transition to a high-firing rate state. That is, Sigma corresponds in the model to the spontaneous activity (its variance) of a region, and this propagates via the effective connectivities to the other nodes in the recurrent network. A higher value for Sigma compared relative to controls indicates more fluctuating activity, which could reflect a pathological increase of activity.
The EC model and algorithm used here is closely related to the linearized version of the DCM that is used for the resting state (Friston et al. 2014; Frassle et al. 2017) and for task-related fMRI (Gilson et al. 2018). Although the hemodynamics of the filtering is properly modeled for DCM, the complex nonlinearity is simplified in the EC algorithm used here (Gilson et al. 2016), which enables it to be applied to a whole-brain parcellation with many nodes (in this case, the 94 nodes of the AAL2 atlas). Instead of the model comparison used by DCM to find the best network topology, the current algorithm uses structural data (from DTI) to specify possible connections in the model, thereby simplifying the operation of the model because some links with no known anatomical connection are excluded. The implication is that significant differences of EC identified with this algorithm (here schizophrenia vs. controls) are expected to reflect significant changes in the corresponding DCM.
Within a cortical hierarchy of connectivity (e.g., from primary visual cortex V1 to the inferior temporal cortex; Rolls 2012b), the forward connections between any pair of cortical areas up through the hierarchy are thought to be stronger than the backprojections based on a wealth of evidence (Rolls 2016a), and there are useful asymmetries in the terminations of the forward and backward projections that facilitate this (Pandya et al. 2015; Rolls 2016a). This ensures that sensory input dominates the processing, rather than imagination. In the present investigation, we refer to the EC in terms of how region 1 influences region 2, and refer to forward and backward connectivity mainly in the Discussion. The EC algorithm used here was validated by the forward versus backward connectivities in the healthy controls. For example, the EC was greater from the inferior temporal cortex to the medial orbitofrontal cortex (0.04 vs. 0.03), which is predicted to be forward connectivity (Rolls 2016a, 2019). In another example, the EC was greater from the inferior temporal cortex to the parahippocampal gyrus (0.04 vs. 0.02), which is predicted to be forward connectivity (Rolls 2016a). In another example, the EC was greater from the inferior temporal cortex to the hippocampus (0.03 vs. 0.02), which is predicted to be forward connectivity (Rolls 2016a). Further examples can be seen in the whole Table of effective connectivities between all 94 AAL2 area in a different group of healthy participants available elsewhere (Rolls et al. 2018).
Overview
The approach used to calculate EC follows that described by Gilson et al. (2016). EC measures the individual efficacy of each existing connection between two brain regions, that is, how much one brain region influences another. Our approach provides a signature for each subject in the high-dimensional space of EC connections (>3000), which is then used to investigate differences between schizophrenia patients and healthy controls. The estimated EC values reflect the combined effects of synaptic efficacies between the regions, the types and concentrations of neurotransmitters in the target regions, etc.
The dynamics for each brain region are described by a multivariate Ornstein–Uhlenbeck process; each region receives fluctuating inputs (white noise) that propagates via the EC to other nodes, which shapes the correlation pattern at the global level, that is, the FC. Here the focus is on transitions of fMRI measurements across successive TRs, which have been shown to convey information about conditions such as waking versus sleeping (Mitra et al. 2015). The EC model captures this information via the covariances with non-zero time shifts (spatiotemporal FC) and the resulting EC contains information about directed connectivity. Both EC and the local input variance are optimized such that the model best reproduces statistics of observed fMRI signals measured by the empirical spatiotemporal FC, which are canonically related to the cross spectra used to tune a resting-state DCM (Friston et al. 2014).
Details about the optimization are provided by Gilson et al. (2016) for resting-state fMRI data and are summarized next. The skeleton for the EC is provided by structural data obtained using DTI, from which we infer the existence of connections. This usefully reduces the number of parameters to estimate and enhances the estimation procedure at the level of individual subjects: from all possible 942 – 94 = 8742 connections, we specify that many are not present anatomically as direct projections, so in the model we need to optimize only 39% of the possible connections. The DTI connectivity matrix was set to just 0 (no connection) or 1 (for a connection) between the AAL2 94 regions (Rolls et al. 2015), based on the DTI atlas used by Gilson et al. (2016). The algorithm thus limits the number of parameters being considered, by excluding connections in the model for which there is no anatomical basis for a direct connection between brain areas, and uses the structural connectivity in this way. A key advantage of the approach is that it does not have to limit the number of nodes considered in the EC model by any prior hypothesis involving selecting only some nodes for analysis, except those with no known direct anatomical connection. Because DTI may miss inter-hemispheric connections between homotopic regions between the two hemispheres (Hagmann et al. 2008; Messe et al. 2014), we set these as being present, and allowed the algorithm to tune the strengths of these just as for the other effective connectivities. In the present investigation the 1’s in the connectivity matrix were the same as those established for the human brain and used previously (Gilson et al. 2016). The AAL2 (Rolls et al. 2015) was used to parcellate the brain into 94 regions, because this number of regions provides a suitable number of FC links without too many degrees of freedom; because its parcellation of the orbitofrontal cortex region which is of special interest in relation to depression (Rolls 2016b) has been remade to relate to useful divisions and descriptions; and because it has been found to be useful in related investigations (Cheng et al. 2016). Limiting the number of parameters to estimate in the whole-brain dynamic model is crucial to obtain robust individualized EC estimates. On the other hand, the AAL2 corresponds to about 3450 EC link parameters (for 39.46% density), which is a sufficiently rich space to extract complex patterns to differentiate between patients and controls. Our choice aimed to solve this trade-off. We note that this approach to the estimation of EC is being widely used (Gilson 2018; Gilson et al. 2018; Pallares et al. 2018; Rolls et al. 2018; Senden et al. 2018).
Empirical covariances
Dynamic cortical model
The model comprised |$N=94$| interconnected cortical regions. The activity |${x}_i$| of each region is governed by an Ornstein–Uhlenbeck process and evolves depending on the activity of other populations: |$\frac{{\mathrm{dx}}_i}{\mathrm{dt}}=\frac{-{x}_i}{\tau_x}+{\sum}_{j\ne i}{C}_{\mathrm{ij}}{x}_j+{\mathrm{dB}}_i$|. Here, the time constant |${\tau}_x$| corresponds to an exponential decay and is calibrated from the empirical data (see Eq. 2); |${\mathrm{dB}}_i$| is white Gaussian noise with covariance matrix |$\varSigma$|, where the input variances sit on the diagonal and are zero elsewhere. These input fluctuations propagate via the EC embodied by the matrix |$C$| (its skeleton is determined by DTI). All variables |${x}_i$| have zero mean and the theoretical spatiotemporal covariances are defined by |${Q}_{\mathrm{ij}}^{\tau }=\Big\langle {x}_i^t{x}_j^{t+\tau}\Big\rangle$|, where the angular brackets denote averaging over randomness of the inputs; we use two time shifts: |$\tau =0$| and |$\tau =1$| TR.
The mathematical mappings between matrices |$C$|, |${Q}^0$|, and |${Q}^1$| are given by Lyapunov equation |${\mathrm{JQ}}^0+{Q}^0{J}^T+\varSigma =0$| and |${Q}^1={Q}^0\mathrm{expm}\big(\,{J}^T\big)$|, where the Jacobian of the dynamical system |${J}_{\mathrm{ij}}=-\frac{\delta \mathrm{ij}}{\tau_x}+{C}_{\mathrm{ij}}$| depends on the mean activity of the network (|${\delta}_{\mathrm{ij}}$| is the Kronecker delta); the superscript T denotes the matrix transpose; expm denotes the matrix exponential. These two consistency equations allow for the quick estimation of the predicted FC matrices, without simulating the network.
In the current form of the EC algorithm, there is no hemodynamic model (Gilson et al. 2016), but any possible difference in the hemodynamics between schizophrenics and controls is unlikely to account for the results described here, in that it is very unlikely, for example, that this could lead to the decrease in the forward connectivity and the increase in the backward connectivity for the links that are significantly different between schizophrenics and controls. Further, Figure 3A shows that in people with schizophrenia, across the whole brain the weaker EC links tend to be increased in strength relative to controls, and the strong EC links tend to be decreased in strength relative to controls (r = 0.39, P < 0.0001), and it is unlikely that any difference in haemodynamic responses between schizophrenics and controls would account for exactly these effects shown in Figure 3A. However, we note that it would nevertheless be of interest in future research to investigate possible differences in the haemodynamics between people with schizophrenia and controls, even though this is unlikely given the above arguments to be able to account for all the differences in the forward versus backward connectivity of almost all of the EC links described here that are significantly different in schizophrenia. Further information about the mathematical model is provided in the Supplementary material in the Section ‘The dynamic cortical model for EC’.
Parameter estimation procedure
We tune the model such that its covariance matrices |${Q}^0$| and |${Q}^1$| reproduce the empirical |${\hat{Q}}^0$| and |${\hat{Q}}^1$|. We summarize the essential steps of the procedure described in Gilson et al. (2016) that iteratively optimizes the network parameters |$C$| and |$\varSigma$|. At each step, the Jacobian |$J$| is calculated from the current value of |$C$|. Then, the model FC matrices |${Q}^0$| and |${Q}^{\tau }$| are calculated from the consistency equations, using the Bartels–Stewart algorithm to solve the Lyapunov equation. The desired Jacobian update is the matrix |${\delta J}^T={\big({Q}^0\big)}^{-1}\big[{\delta Q}^0+{\delta Q}^1\mathrm{expm}\big(-{\mathrm{J}}^T\big)\big]$|, which aims to reduce the FC error between the empirical and model FC, as determined by the two difference matrices |${\delta Q}^0={\hat{Q}}^0-{Q}^0$| and |${\delta Q}^1={\hat{Q}}^1-{Q}^1$|. Finally, the connectivity update is |${\delta C}_{\mathrm{ij}}={\eta}_C{\delta J}_{\mathrm{ij}}$| for existing connections. We impose non-negativity of the EC values during the optimization. The input variances are tuned according to |${\delta \varSigma}_{\mathrm{ii}}=-{\eta}_{\varSigma}\Big({J\delta Q}_{\mathrm{ii}}^0+{\delta Q}_{\mathrm{ii}}^0{J}^T\Big)$|. We use |${\eta}_C=0.0001$| and |${\eta}_{\varSigma }=0.1$|.
The approach has been shown to be robust, in that it has been shown that the EC measured in this way conveys relevant information about subject and (task) conditions, thereby making EC a useful connectivity measure for biomarkers (Pallares et al. 2018). EC measured with this algorithm was found to be more robust than FC in an analysis of this issue (Pallares et al. 2018). The choice of |${\eta}_C$| and |${\eta}_{\varSigma }$| is in line with a previous study that explored the estimation of EC (Gilson et al. 2016). They are also in a similar range to those used for biomarkers (Pallares et al. 2018).
The EC algorithm produces values for the EC between every pair of nodes (apart from those set to zero by the anatomical mask) in the AAL2 atlas, and every connection in the resulting EC matrix is a direct connection. For clarification, the optimization method that tunes the EC weights takes into account the network effects (Gilson et al. 2016). This means that the observed correlations (FC0 and FC1) are generated by the EC weights while incorporating indirect interactions. In essence this is like partial correlations compared to Pearson correlations for a graphical model, the former often being a sparse matrix even when the second is a full matrix. Of course, it is possible that any one node in the model may have internal connections in addition to those being measured by the algorithm, with one example being the hippocampus which has dentate to CA3 to CA1 internal connectivity (Rolls 2018). The algorithm deals with the interaction of the specified nodes, and not of all the internal interactions between the neurons within each node. But the EC algorithm (Gilson et al. 2016) itself does measure direct effects between the nodes in the model, which in the present research are the 94 brain areas in the automated anatomical labeling atlas AAL2 (Rolls et al. 2015).
In addition, the EC algorithm does allow negative effectivity connectivities to be calculated, which might reflect, for example, inhibition from one area to another, but when this was checked, any negative EC values in the AAL2 matrix were few and small in magnitude, with only one exceeding a threshold of −0.03, and only 35/3450 link parameters between −0.01 and −0.03. In further checks, it was found that the correlation between the EC values with the standard clipping of effective connectivities at zero and allowing them to become negative was high (r = 0.99, across the whole group and for all links), so that the conclusions reached in this paper are very little affected by whether the links are clipped at zero or not. Further, the finding reported in the results below that the difference between the forward and backward effective connectivities was lower in schizophrenia was confirmed also when the algorithm was allowed to run with effective connectivities that could assume negative values. For example, the difference between the forward and backward effective connectivities was considerably smaller in the schizophrenia group than in the controls (t = 3.77, P = 1.86e-4) with the clipping at zero as shown below. This finding was confirmed when there was no clipping of effective connectivities at zero (t = 4.86, P = 1.7e-6).
The goodness of the fit of the model used to generate the EC to the empirical data was assessed as follows. The correlation between the FC produced by the EC model and the empirical FC measured between all AAL2 areas was 0.67 (with 0.08 standard error), which provided evidence of a satisfactory operation of the model, in line with what was reported by Gilson et al. (2016).
Normalization of model estimates
Normalization of the EC within each individual was performed by performing the z-score over the matrix elements for each EC matrix within each participant: (ECij – mean (ECij))/std (ECij) for all EC links (performed over existing links corresponding to 1’s in the structural connectivity matrix). The aim of this was to enable each participant’s data to contribute similarly to the statistics calculated across participants. We note that small effective connectivities will appear in the tables in this paper as negative, but this is only due to the removal of the mean value. All EC links computed by the algorithm are in fact positive. Any difference between patients and controls that is described as negative in fact refers only to a decrease of EC. A similar normalization within each individual was used for the Σ values. An increase of a Σ value can be interpreted as an increase of the variance in an AAL2 region. These normalisations were used for the statistical calculations. Table 1 shows the mean of the EC values not normalized (because a negative EC would have no meaning). Table 2 shows the mean of the Σ values normalized within each participant because this better reflects the statistical values.
EC links that are different between patients with schizophrenia and controls
| Region 1 (R1) | Region 2 (R2) | t value of R1 to R2 | P value of R1 to R2 | EC of R1 to R2 in CON | EC of R1 to R2 in SCZ | t value of R2 to R1 | P value of R2 to R1 | EC of R2 to R1 in CON | EC of R2 to R1 in SCZ | F/B ratio in CON | F/B ratio in SCZ |
|---|---|---|---|---|---|---|---|---|---|---|---|
| Amygdala_L | Postcentral_L | −5.2193 | 1.80E-07 | 0.0263 | 0.0188 | 0.2086 | 8.35E-01 | 0.0315 | 0.0338 | 1.1958 | 1.8022 |
| Amygdala_L | Insula_L | −4.4472 | 8.70E-06 | 0.0184 | 0.0135 | 0.2348 | 8.14E-01 | 0.0383 | 0.0470 | 2.0809 | 3.4830 |
| Frontal_Sup_2_L | Supp_Motor_Area_L | 4.6475 | 3.36E-06 | 0.0403 | 0.0601 | 1.8255 | 6.79E-02 | 0.0295 | 0.0359 | 1.3658 | 1.6750 |
| Fusiform_L | Lingual_L | −5.3568 | 8.47E-08 | 0.0899 | 0.0819 | 0.6311 | 5.28E-01 | 0.0418 | 0.0473 | 2.1479 | 1.7318 |
| Fusiform_L | Lingual_R | −4.4415 | 8.94E-06 | 0.0771 | 0.0722 | 0.7594 | 4.48E-01 | 0.0301 | 0.0342 | 2.5635 | 2.1106 |
| Fusiform_L | Cuneus_R | −4.4318 | 9.35E-06 | 0.0579 | 0.0514 | 0.8655 | 3.87E-01 | 0.0174 | 0.0203 | 3.3292 | 2.5390 |
| Fusiform_L | Occipital_Sup_L | −4.2990 | 1.72E-05 | 0.0623 | 0.0543 | 1.1122 | 2.66E-01 | 0.0222 | 0.0255 | 2.8040 | 2.1239 |
| Heschl_L | Temporal_Mid_L | −5.3753 | 7.65E-08 | 0.0194 | 0.0138 | −2.5027 | 1.23E-02 | 0.0325 | 0.0268 | 1.6761 | 1.9488 |
| Heschl_L | Cingulate_Mid_L | −4.7948 | 1.63E-06 | 0.0377 | 0.0302 | −1.8460 | 6.49E-02 | 0.0389 | 0.0370 | 1.0322 | 1.2246 |
| Heschl_L | Temporal_Sup_L | −4.6520 | 3.29E-06 | 0.0582 | 0.0524 | −0.0540 | 9.57E-01 | 0.0751 | 0.0781 | 1.2904 | 1.4917 |
| Heschl_L | Heschl_R | −4.3079 | 1.65E-05 | 0.0733 | 0.0659 | −1.2915 | 1.97E-01 | 0.0699 | 0.0686 | 1.0493 | 0.9603 |
| Heschl_L | Precentral_L | −4.2601 | 2.04E-05 | 0.0221 | 0.0177 | −4.4511 | 8.54E-06 | 0.0513 | 0.0424 | 2.3164 | 2.3977 |
| Heschl_R | Temporal_Pole_Sup_R | −4.5764 | 4.73E-06 | 0.0346 | 0.0306 | −3.3522 | 8.02E-04 | 0.0532 | 0.0489 | 1.5406 | 1.5953 |
| Pallidum_L | Thalamus_L | −5.1315 | 2.87E-07 | 0.0497 | 0.0411 | 0.2162 | 8.29E-01 | 0.0308 | 0.0342 | 1.6151 | 1.2025 |
| Pallidum_R | Thalamus_R | −5.0929 | 3.53E-07 | 0.0424 | 0.0347 | −1.9382 | 5.26E-02 | 0.0313 | 0.0308 | 1.3545 | 1.1262 |
| Pallidum_R | Thalamus_L | −4.6029 | 4.17E-06 | 0.0421 | 0.0348 | −0.6891 | 4.91E-01 | 0.0269 | 0.0275 | 1.5666 | 1.2640 |
| Pallidum_R | Frontal_Inf_Oper_R | −4.5095 | 6.50E-06 | 0.0382 | 0.0312 | −1.7284 | 8.39E-02 | 0.0226 | 0.0209 | 1.6929 | 1.4934 |
| Paracentral_Lobule_L | Postcentral_L | −6.6846 | 2.32E-11 | 0.0541 | 0.0413 | 1.1861 | 2.36E-01 | 0.0733 | 0.0871 | 1.3559 | 2.1072 |
| Paracentral_Lobule_L | Postcentral_R | −6.2891 | 3.19E-10 | 0.0513 | 0.0415 | 0.7514 | 4.52E-01 | 0.0638 | 0.0768 | 1.2451 | 1.8488 |
| Paracentral_Lobule_L | Precentral_R | −5.6940 | 1.24E-08 | 0.0472 | 0.0368 | 0.0314 | 9.75E-01 | 0.0847 | 0.0979 | 1.7939 | 2.6569 |
| Paracentral_Lobule_L | Occipital_Sup_L | −4.8917 | 1.00E-06 | 0.0396 | 0.0301 | 1.6293 | 1.03E-01 | 0.0262 | 0.0351 | 1.5128 | 0.8578 |
| Paracentral_Lobule_L | Precentral_L | −4.3740 | 1.22E-05 | 0.0358 | 0.0293 | −1.6939 | 9.03E-02 | 0.0775 | 0.0836 | 2.1627 | 2.8543 |
| Paracentral_Lobule_R | Postcentral_L | −4.9811 | 6.32E-07 | 0.0450 | 0.0355 | 0.7350 | 4.62E-01 | 0.0672 | 0.0798 | 1.4943 | 2.2521 |
| Paracentral_Lobule_R | Postcentral_R | −4.8783 | 1.07E-06 | 0.0498 | 0.0421 | 1.4725 | 1.41E-01 | 0.0701 | 0.0854 | 1.4086 | 2.0267 |
| Paracentral_Lobule_R | Precentral_R | −4.7478 | 2.06E-06 | 0.0420 | 0.0333 | −0.4239 | 6.72E-01 | 0.0842 | 0.0941 | 2.0051 | 2.8290 |
| ParaHippocampal_L | Occipital_Sup_L | −5.0958 | 3.47E-07 | 0.0317 | 0.0204 | 1.4964 | 1.35E-01 | 0.0087 | 0.0101 | 3.6303 | 2.0178 |
| ParaHippocampal_L | Occipital_Mid_L | −4.8364 | 1.32E-06 | 0.0365 | 0.0284 | 2.2489 | 2.45E-02 | 0.0176 | 0.0255 | 2.0792 | 1.1162 |
| ParaHippocampal_L | Lingual_L | −4.6352 | 3.57E-06 | 0.0482 | 0.0365 | −0.4049 | 6.86E-01 | 0.0161 | 0.0165 | 2.9964 | 2.2064 |
| ParaHippocampal_R | Lingual_R | −6.1206 | 9.32E-10 | 0.0671 | 0.0493 | 0.9885 | 3.23E-01 | 0.0141 | 0.0161 | 4.7627 | 3.0576 |
| ParaHippocampal_R | Calcarine_R | −5.8300 | 5.54E-09 | 0.0642 | 0.0455 | 2.3091 | 2.09E-02 | 0.0145 | 0.0181 | 4.4251 | 2.5134 |
| ParaHippocampal_R | Temporal_Pole_Sup_R | −5.8127 | 6.15E-09 | 0.0533 | 0.0412 | −0.7388 | 4.60E-01 | 0.0292 | 0.0295 | 1.8276 | 1.3958 |
| ParaHippocampal_R | Occipital_Mid_R | −5.8126 | 6.15E-09 | 0.0606 | 0.0472 | −0.3197 | 7.49E-01 | 0.0203 | 0.0223 | 2.9769 | 2.1175 |
| ParaHippocampal_R | Cuneus_R | −5.7365 | 9.67E-09 | 0.0537 | 0.0373 | 1.3852 | 1.66E-01 | 0.0089 | 0.0106 | 6.0032 | 3.5131 |
| ParaHippocampal_R | Occipital_Sup_R | −5.0802 | 3.77E-07 | 0.0428 | 0.0318 | −1.0477 | 2.95E-01 | 0.0115 | 0.0105 | 3.7183 | 3.0431 |
| ParaHippocampal_R | Insula_R | −4.2807 | 1.86E-05 | 0.0340 | 0.0219 | 0.3900 | 6.97E-01 | 0.0135 | 0.0158 | 2.5126 | 1.3889 |
| Postcentral_R | Lingual_R | −4.2540 | 2.10E-05 | 0.0452 | 0.0376 | −2.9510 | 3.17E-03 | 0.0233 | 0.0200 | 1.9413 | 1.8838 |
| Precentral_L | Postcentral_L | −4.7826 | 1.73E-06 | 0.0897 | 0.0822 | 2.4831 | 1.30E-02 | 0.0569 | 0.0688 | 1.5752 | 1.1952 |
| Precentral_L | Supp_Motor_Area_L | 4.5363 | 5.73E-06 | 0.0726 | 0.0942 | −2.3719 | 1.77E-02 | 0.0452 | 0.0450 | 1.6058 | 2.0930 |
| Precentral_L | Heschl_L | −4.4511 | 8.54E-06 | 0.0513 | 0.0424 | −4.2601 | 2.04E-05 | 0.0221 | 0.0177 | 2.3164 | 2.3977 |
| Precuneus_L | Fusiform_L | 5.3789 | 7.49E-08 | 0.0023 | 0.0054 | 3.1195 | 1.81E-03 | 0.0396 | 0.0525 | 17.0610 | 9.6510 |
| Precuneus_L | ParaHippocampal_L | 5.0288 | 4.94E-07 | 0.0068 | 0.0125 | −1.8669 | 6.19E-02 | 0.0605 | 0.0568 | 8.9613 | 4.5589 |
| Precuneus_L | Parietal_Sup_L | 4.7247 | 2.30E-06 | 0.0254 | 0.0402 | 1.1738 | 2.40E-01 | 0.0521 | 0.0634 | 2.0464 | 1.5770 |
| Precuneus_L | Fusiform_R | 4.2981 | 1.72E-05 | 0.0021 | 0.0042 | 3.3588 | 7.83E-04 | 0.0302 | 0.0423 | 14.3434 | 10.1715 |
| Precuneus_R | ParaHippocampal_L | 5.4387 | 5.37E-08 | 0.0069 | 0.0141 | −1.7725 | 7.63E-02 | 0.0550 | 0.0538 | 7.9936 | 3.8070 |
| Precuneus_R | Fusiform_L | 5.0988 | 3.42E-07 | 0.0032 | 0.0070 | 2.5356 | 1.12E-02 | 0.0390 | 0.0500 | 12.0392 | 7.0871 |
| Precuneus_R | ParaHippocampal_R | 4.7037 | 2.56E-06 | 0.0074 | 0.0127 | −1.9131 | 5.57E-02 | 0.0740 | 0.0720 | 9.9728 | 5.6650 |
| Precuneus_R | Occipital_Mid_R | 4.5290 | 5.93E-06 | 0.0074 | 0.0156 | 3.1990 | 1.38E-03 | 0.0333 | 0.0495 | 4.5179 | 3.1816 |
| Precuneus_R | Parietal_Sup_L | 4.4302 | 9.42E-06 | 0.0196 | 0.0338 | 1.3378 | 1.81E-01 | 0.0398 | 0.0503 | 2.0255 | 1.4908 |
| Putamen_R | Frontal_Inf_Oper_R | −5.1022 | 3.36E-07 | 0.0445 | 0.0373 | −2.4688 | 1.36E-02 | 0.0261 | 0.0240 | 1.7066 | 1.5528 |
| Putamen_R | SupraMarginal_R | −4.3114 | 1.62E-05 | 0.0515 | 0.0438 | −2.8078 | 4.99E-03 | 0.0206 | 0.0164 | 2.4960 | 2.6648 |
| Rolandic_Oper_L | Fusiform_L | −4.3516 | 1.35E-05 | 0.0302 | 0.0254 | −2.6644 | 7.71E-03 | 0.0367 | 0.0322 | 1.2174 | 1.2678 |
| Supp_Motor_Area_L | Rolandic_Oper_L | −5.6160 | 1.95E-08 | 0.0368 | 0.0264 | −2.8934 | 3.81E-03 | 0.0381 | 0.0362 | 1.0345 | 1.3688 |
| Supp_Motor_Area_L | Insula_L | −4.5579 | 5.17E-06 | 0.0341 | 0.0274 | −0.3866 | 6.99E-01 | 0.0443 | 0.0460 | 1.2991 | 1.6803 |
| Supp_Motor_Area_L | Precentral_R | −4.3974 | 1.10E-05 | 0.0423 | 0.0372 | 4.0272 | 5.65E-05 | 0.0658 | 0.0860 | 1.5563 | 2.3131 |
| Supp_Motor_Area_R | Precentral_R | −5.6360 | 1.74E-08 | 0.0629 | 0.0544 | 3.1723 | 1.51E-03 | 0.0620 | 0.0764 | 1.0157 | 0.7125 |
| Supp_Motor_Area_R | Insula_R | −5.5575 | 2.74E-08 | 0.0531 | 0.0435 | −0.8708 | 3.84E-01 | 0.0309 | 0.0303 | 1.7195 | 1.4360 |
| Supp_Motor_Area_R | Rolandic_Oper_R | −5.0939 | 3.51E-07 | 0.0619 | 0.0543 | −0.3774 | 7.06E-01 | 0.0319 | 0.0354 | 1.9388 | 1.5333 |
| Supp_Motor_Area_R | Postcentral_L | −4.7120 | 2.45E-06 | 0.0509 | 0.0434 | 3.7217 | 1.98E-04 | 0.0372 | 0.0487 | 1.3703 | 0.8900 |
| Supp_Motor_Area_R | Putamen_R | −4.5465 | 5.45E-06 | 0.0251 | 0.0181 | −2.9881 | 2.81E-03 | 0.0319 | 0.0297 | 1.2721 | 1.6419 |
| Supp_Motor_Area_R | Frontal_Inf_Oper_R | −4.2597 | 2.05E-05 | 0.0512 | 0.0447 | −2.4420 | 1.46E-02 | 0.0396 | 0.0407 | 1.2930 | 1.0976 |
| Temporal_Mid_L | Cuneus_R | −4.4098 | 1.03E-05 | 0.0304 | 0.0218 | −0.1722 | 8.63E-01 | 0.0111 | 0.0117 | 2.7507 | 1.8676 |
| Temporal_Pole_Mid_L | Temporal_Sup_L | −5.6735 | 1.40E-08 | 0.0391 | 0.0263 | −2.4005 | 1.64E-02 | 0.0200 | 0.0175 | 1.9574 | 1.4983 |
| Temporal_Pole_Mid_L | Occipital_Mid_L | −5.6373 | 1.73E-08 | 0.0303 | 0.0202 | 0.5535 | 5.80E-01 | 0.0094 | 0.0113 | 3.2127 | 1.7809 |
| Temporal_Pole_Mid_L | Occipital_Inf_L | −4.9666 | 6.82E-07 | 0.0436 | 0.0324 | 0.9313 | 3.52E-01 | 0.0095 | 0.0102 | 4.5905 | 3.1892 |
| Temporal_Pole_Mid_L | Fusiform_L | −4.6470 | 3.37E-06 | 0.0409 | 0.0354 | 0.8199 | 4.12E-01 | 0.0278 | 0.0335 | 1.4710 | 1.0554 |
| Temporal_Pole_Mid_L | Calcarine_L | −4.4301 | 9.42E-06 | 0.0420 | 0.0316 | 2.4475 | 1.44E-02 | 0.0067 | 0.0094 | 6.2522 | 3.3733 |
| Temporal_Pole_Mid_L | Lingual_L | −4.3218 | 1.55E-05 | 0.0399 | 0.0294 | 0.1528 | 8.79E-01 | 0.0110 | 0.0111 | 3.6268 | 2.6606 |
| Temporal_Pole_Mid_L | Temporal_Pole_Sup_L | −4.2944 | 1.75E-05 | 0.0856 | 0.0748 | 1.9048 | 5.68E-02 | 0.0325 | 0.0402 | 2.6341 | 1.8578 |
| Temporal_Pole_Mid_R | Temporal_Sup_R | −5.1966 | 2.03E-07 | 0.0593 | 0.0443 | −1.4504 | 1.47E-01 | 0.0262 | 0.0272 | 2.2682 | 1.6280 |
| Temporal_Pole_Mid_R | Fusiform_R | −4.8828 | 1.05E-06 | 0.0427 | 0.0347 | 0.5730 | 5.67E-01 | 0.0215 | 0.0242 | 1.9857 | 1.4370 |
| Temporal_Pole_Mid_R | Calcarine_R | −4.8335 | 1.34E-06 | 0.0463 | 0.0306 | 2.4275 | 1.52E-02 | 0.0083 | 0.0128 | 5.5968 | 2.3925 |
| Temporal_Pole_Mid_R | Occipital_Inf_R | −4.7653 | 1.89E-06 | 0.0563 | 0.0417 | 1.0171 | 3.09E-01 | 0.0104 | 0.0131 | 5.4233 | 3.1793 |
| Temporal_Pole_Mid_R | Frontal_Med_Orb_R | −4.7334 | 2.21E-06 | 0.0868 | 0.0706 | −0.2756 | 7.83E-01 | 0.0211 | 0.0233 | 4.1105 | 3.0305 |
| Temporal_Sup_L | Lingual_L | −4.6948 | 2.67E-06 | 0.0496 | 0.0419 | −2.0835 | 3.72E-02 | 0.0293 | 0.0283 | 1.6914 | 1.4811 |
| Temporal_Sup_L | Cuneus_L | −4.6358 | 3.55E-06 | 0.0448 | 0.0337 | −1.5585 | 1.19E-01 | 0.0171 | 0.0154 | 2.6275 | 2.1915 |
| Temporal_Sup_L | Occipital_Sup_L | −4.5831 | 4.58E-06 | 0.0364 | 0.0287 | 0.7577 | 4.49E-01 | 0.0165 | 0.0190 | 2.2047 | 1.5093 |
| Thalamus_L | Thalamus_R | −5.7941 | 6.87E-09 | 0.0771 | 0.0651 | −4.9874 | 6.12E-07 | 0.0830 | 0.0732 | 1.0770 | 1.1248 |
| Thalamus_R | Thalamus_L | −4.9874 | 6.12E-07 | 0.0830 | 0.0732 | −5.7941 | 6.87E-09 | 0.0771 | 0.0651 | 1.0770 | 1.1248 |
| Thalamus_R | ParaHippocampal_R | 4.8102 | 1.51E-06 | 0.0115 | 0.0199 | 3.0187 | 2.54E-03 | 0.0308 | 0.0392 | 2.6860 | 1.9657 |
Links are shown if their EC value in either direction exceeds the threshold of 0.03, and if there is a significant difference (P < 0.05) using FDR correction for multiple comparisons between patients and controls, for which the uncorrected significance level must be P < 0.0012. A negative value for z indicates a weaker effective connectivity link in patients with schizophrenia. Here we only show the top 80 links.
Summary of the main differences in EC in schizophrenia
| Region 1 | Region 2 (a set of regions) | z value of region 1 to 2 EC | z value of region 2 to 1 EC | EC of region 1 to 2 in HC | EC of region 1 to 2 in SCZ | EC of region 2 to 1 in HC | EC of region 2 to 1 in SCZ |
|---|---|---|---|---|---|---|---|
| Precuneus_L | Hippocampus_L, ParaHippocampal_L, Occipital_Mid_L, Fusiform_L, Parietal_Sup_L, Paracentral_Lobule_L, Temporal_Sup_R, Paracentral_Lobule_R, Fusiform_R, Occipital_Mid_R, Hippocampus_R | 4.229 | 0.510 | 0.0074 | 0.0134 | 0.0406 | 0.0465 |
| Precuneus_R | ParaHippocampal_L, Occipital_Mid_L, Fusiform_L, Parietal_Sup_L, Temporal_Sup_R, Parietal_Sup_R, Occipital_Mid_R, ParaHippocampal_R, Hippocampus_R, Frontal_Sup_2_R | 4.325 | 0.638 | 0.0104 | 0.0170 | 0.0441 | 0.0511 |
| Cingulate_Post_R | Temporal_Mid_L, Temporal_Pole_Mid_R, Temporal_Mid_R, ParaHippocampal_R | 3.679 | −0.298 | 0.0081 | 0.0132 | 0.0558 | 0.0582 |
| ParaHippocampal_L | Calcarine_L, Cuneus_L, Lingual_L, Occipital_Sup_L, Occipital_Mid_L, Occipital_Inf_L, Parietal_Sup_L, Temporal_Mid_L | −4.273 | 1.146 | 0.0405 | 0.0311 | 0.0140 | 0.0167 |
| ParaHippocampal_R | Temporal_Pole_Sup_R, Parietal_Sup_R, Fusiform_R, Occipital_Inf_R, Occipital_Mid_R, Occipital_Sup_R, Lingual_R, Cuneus_R, Calcarine_R, Insula_R, Rectus_R, Olfactory_R | −4.796 | 0.432 | 0.0534 | 0.0416 | 0.0183 | 0.0205 |
| Temporal_Sup_L | Cuneus_L, Lingual_L, Occipital_Sup_L | −4.638 | −0.961 | 0.0436 | 0.0348 | 0.0210 | 0.0209 |
| Temporal_Pole_Mid_L | Olfactory_L, OFCpost_L, Calcarine_L, Lingual_L, Occipital_Sup_L, Occipital_Mid_L, Occipital_Inf_L, Fusiform_L, Temporal_Sup_L, Temporal_Pole_Sup_L, Temporal_Mid_L | −4.477 | 0.424 | 0.0476 | 0.0374 | 0.0190 | 0.0216 |
| Temporal_Pole_Mid_R | Temporal_Mid_R, Temporal_Pole_Sup_R, Temporal_Sup_R, Fusiform_R, Occipital_Inf_R, Occipital_Mid_R, Occipital_Sup_R, Lingual_R, Cuneus_R, Calcarine_R, ParaHippocampal_R, OFCpost_R, OFCmed_R, Rectus_R, Frontal_Med_Orb_R, Olfactory_R | −4.185 | 0.422 | 0.0548 | 0.0441 | 0.0199 | 0.0225 |
| Fusiform_L | Frontal_Inf_Orb_2_L, Cuneus_L, Lingual_L, Occipital_Sup_L, Occipital_Mid_L, Lingual_R, Cuneus_R, Calcarine_R | −4.201 | 0.862 | 0.0620 | 0.0549 | 0.0244 | 0.0280 |
| Fusiform_R | Occipital_Sup_L, Precuneus_L, Occipital_Sup_R, Lingual_R, Cuneus_R | −2.382 | 0.433 | 0.0635 | 0.0613 | 0.0230 | 0.0247 |
| Amygdala_L | OFCpost_L, Insula_L, Postcentral_L, SupraMarginal_L | −4.265 | −0.758 | 0.0230 | 0.0176 | 0.0337 | 0.0352 |
| Cingulate_Ant_R | Cingulate_Mid_L, Cingulate_Post_R, Cingulate_Mid_R | −3.871 | −1.330 | 0.0596 | 0.0546 | 0.0414 | 0.0410 |
| Frontal_Sup_Medial_R | Cingulate_Mid_L, Cingulate_Mid_R, Cingulate_Ant_R | −3.521 | −1.146 | 0.0307 | 0.0264 | 0.0514 | 0.0533 |
| Supp_Motor_Area_L | Rolandic_Oper_L, Insula_L, Cingulate_Mid_L, Postcentral_L, Putamen_R, Frontal_Inf_Oper_R, Precentral_R, | −4.167 | 0.399 | 0.0345 | 0.0285 | 0.0429 | 0.0491 |
| Supp_Motor_Area_R | Cingulate_Mid_L, Postcentral_L, Putamen_R, Postcentral_R, Cingulate_Mid_R, Insula_R, Rolandic_Oper_R, Frontal_Inf_Tri_R, Frontal_Inf_Oper_R, Precentral_R | −4.518 | 0.385 | 0.0491 | 0.0424 | 0.0382 | 0.0430 |
| Precentral_L | Rolandic_Oper_L, Supp_Motor_Area_L, Postcentral_L, Heschl_L, | −2.214 | −1.754 | 0.0672 | 0.0664 | 0.0400 | 0.0417 |
| Precentral_R | Supp_Motor_Area_L, Parietal_Inf_R, Occipital_Mid_R | 1.590 | −1.874 | 0.0517 | 0.0633 | 0.0258 | 0.0237 |
| Postcentral_R | Occipital_Mid_R, Lingual_R, Supp_Motor_Area_R, | −1.308 | −3.205 | 0.0382 | 0.0385 | 0.0355 | 0.0326 |
| Paracentral_Lobule_L | Precentral_L, Cingulate_Mid_L, Occipital_Sup_L, Postcentral_L, Parietal_Sup_L, Postcentral_R, Precentral_R, | −5.094 | 0.422 | 0.0434 | 0.0347 | 0.0566 | 0.0661 |
| Paracentral_Lobule_R | Cingulate_Mid_L, Postcentral_L, Parietal_Sup_L, Postcentral_R, Precentral_R | −4.230 | 0.590 | 0.0425 | 0.0354 | 0.0602 | 0.0711 |
| Heschl_L | Precentral_L, Cingulate_Mid_L, Postcentral_L, SupraMarginal_L, Temporal_Sup_L, Temporal_Mid_L, Heschl_R | −4.344 | −2.163 | 0.0401 | 0.0344 | 0.0530 | 0.0500 |
| Heschl_R | Temporal_Mid_R, Temporal_Pole_Sup_R, Temporal_Sup_R | −4.051 | −1.953 | 0.0360 | 0.0332 | 0.0571 | 0.0560 |
| Pallidum_R | Thalamus_L, Thalamus_R, SupraMarginal_R, Insula_R, Frontal_Inf_Oper_R | −4.317 | −1.920 | 0.0408 | 0.0342 | 0.0250 | 0.0234 |
| Putamen_R | SupraMarginal_R, Cingulate_Mid_R, Insula_R, Frontal_Inf_Oper_R | −4.271 | −2.662 | 0.0450 | 0.0397 | 0.0271 | 0.0239 |
A positive value for z indicates a higher EC in SCZ.
Statistical analysis of EC
Two-tailed, two-sample t-tests were performed on the normalized EC to identify significantly altered EC links in patients compared to controls within each imaging center that provided resting-state fMRI data. The effects of age, gender ratios, head motion, and education were regressed within each dataset in this step by general linear models (Barnes et al. 2010; Di Martino et al. 2014). After obtaining the t-test results for each center, the Liptak–Stouffer z-score method (Liptak 1958), which has been described in detail in our previous studies (Cheng et al. 2015a, 2015b, 2016), was then used to combine the results from the individual datasets. We note that in DCM, a threshold value for the EC may be applied, to make it likely that only biologically relevant values are considered (Stephan et al. 2010). In the current investigation we considered only EC values greater than a threshold value of 0.03 for a similar reason, and note that this provides a way to limit the number of links considered to a tractable set. The conclusions for the links described here would not be affected if a different threshold was chosen. In particular, altering the threshold does not alter the significance of the links, but merely how many links are assessed for significance. With a threshold of 0.03, 196 links were significantly different between schizophrenics and controls (P < 0.01 FDR corrected). When a lower threshold of 0.02 was used, more links were found to be significantly different between schizophrenics and controls, but all of the 196 links reported here were still present, so the results reported are robust to different thresholds. In general, the additional links selected with a threshold of 0.02 were less significantly different between schizophrenics and controls, and are not considered further here.
Analysis in terms of forward versus backward connectivity
The connections between adjacent cortical areas in a sensory hierarchy can usually be classified as forward (from the sensory input) versus backward (from an upper region in the hierarchy to the preceding region) (Rolls 2016a). Forward connectivity is often characterized by connections from layer 2–3 pyramidal cells forwards to layers 4, and 2 and 3, of the next cortical area. Backprojections between adjacent cortical areas in a hierarchy typically arise from the deep layers of the cerebral cortex, mainly layer 5, and project back mainly to layer 1 of the preceding cortical area (Markov et al. 2013, 2014a, 2014b; Markov and Kennedy 2013; Rolls 2016a). Give the termination on the apical dendrites in layer 1, far from the cell bodies, the backprojections are likely to be weaker than the forward connections, with effects reducing the backprojecting efficacy including shunting on the dendrites produced by other inputs to pyramidal cells. It is also crucial for attention and memory recall that the top-down or backprojections are weaker than the forward connections, so that attentional biasing and memory recall does not dominate over bottom-up forward inputs (Rolls and Deco 2002; Fuster 2008; Rolls 2016a). In areas of the brain apart from sensory hierarchies there may also be similar asymmetries for systems level functional reasons, for example, that short-term memory processing in prefrontal cortical areas does not dominate perceptual processing in the temporal and parietal areas that utilize the prefrontal cortex for short-term memory (Goldman-Rakic 1996). Because this asymmetry of the strength of the connectivity between brain regions is so important functionally, and usually has an anatomical basis, we have designated some of the effective connectivities analyzed in this investigation as forward or backward based on the strengths in each direction, as well as information about the anatomy of the different brain areas being connected (Rolls 2016a). It is at the same time the case that the effective connectivities can change to some extent based on whether sensory inputs versus memory recall (for example) is being performed, but nevertheless the forward and backward connectivity difference between many brain areas is large (as shown in the Results), and the concept of forward versus backward connectivity is utilized in this paper as an interesting way to characterize the functional differences that may be different between the patients and the controls.
Clinical correlates
We also investigated whether the differences in EC between patients and controls were correlated with symptoms assessed by the PANSS and illness duration. We used the Liptak–Stouffer z-score method (Liptak 1958) to combine the data from the different neuroimaging sites for this analysis, for this provides a principled way to take into consideration possible differences in these measures between sites. Specifically, we calculated the partial correlation between the normalized effective connectivities and the clinical scores, with head motion, age, sex, and education as covariates so that they did not contribute to the correlation between the ECs and the clinical scores, in each individual center. Then we used the Liptak–Stouffer z-score method to combine the results from the individual datasets (Liptak 1958).
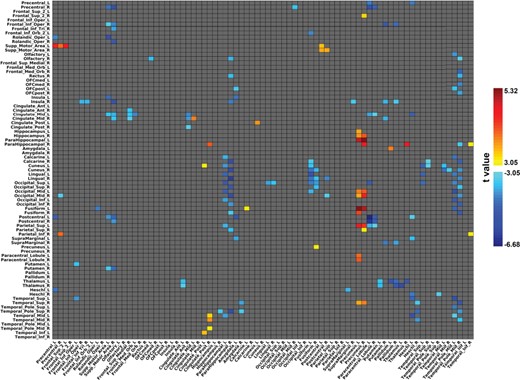
The matrices of differences in effective connectivity between schizophrenia patients and controls. The axes are the AAL2 areas, shown in their numbered order and with their names in Supplementary Table S1. The effective connectivity matrix has the index j for the columns and the index i for the rows. The matrix is thus non-symmetric, and the effective connectivity is always from j to i. The effective connectivity between any pair of links is shown in one direction in the upper right of the matrix, and in the opposite direction in the lower left.
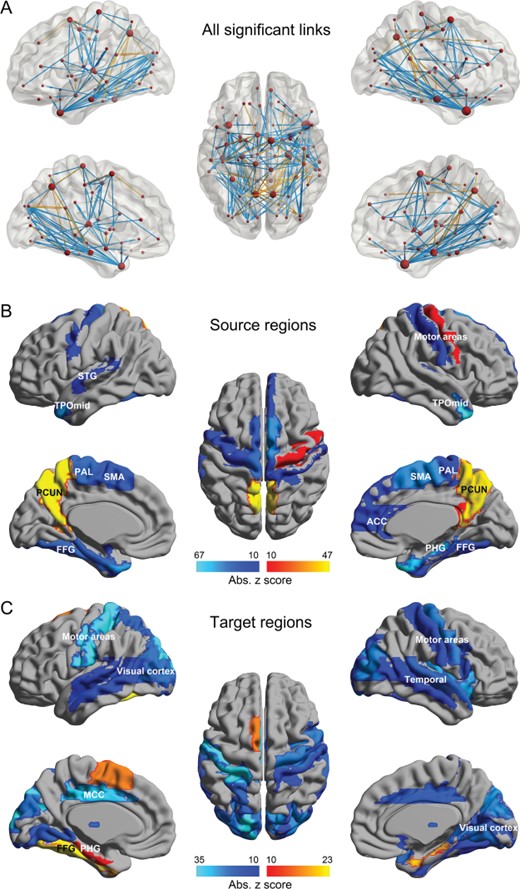
(A) Differences in effective connectivity between patients with schizophrenia and controls. The links shown are those with significantly different effective connectivity after FDR P < 0.01 correction. Yellow indicates that the effective connectivity is increased in patients, and blue that it is decreased. (B) The AAL2 atlas areas from which the effective connectivities were significantly different in patients with schizophrenia. (C) The AAL2 atlas areas to which the effective connectivities were significantly different in patients with schizophrenia. There were 196 such links in (B) and (C) significant with FDR correction, P < 0.01, and with effective connectivity values in at least one direction that were greater than 0.03.
Classification of individuals as with schizophrenia or controls using the EC
To further test the connectivities as diagnostic features for schizophrenia, we applied a support vector machine (SVM) approach using the whole EC or FC matrix as a biomarker to test how well this could discriminate schizophrenia patients from the healthy controls. These SVM classifiers were implemented by using MATLAB’s fitcsvm.m, fitPosterior.m, and predict.m functions. Specifically, the polynomial kernel was used in the SVM classifier. All parameters including regularization parameter C, the polynomial kernel function order and the loss function were determined by the default setting of MATLAB.
Results
Differences of EC between patients with schizophrenia and controls
Table 1 shows the top 80 links with the most significant differences in EC between patients with schizophrenia and controls. In order to focus on links with a reasonable strength of EC that is likely to be meaningful in value (Rolls et al. 2018) as well as significantly different in schizophrenia, links are shown if their EC value in either direction exceeds the threshold of 0.03, and if there is a significant difference between patients and controls using FDR correction (corrected P < 0.01) for multiple comparisons, for which the significance level must be P < 0.0012 (Benjamini and Hochberg 1995). Figure 1 shows similar information in diagrammatic form, and includes all links (196 links in total) that satisfy the two criteria just described. Figure 2A shows these links between AAL2 nodes on views of the brain. Figure 2B shows the main areas with on average increases or decreases in their EC directed to other areas (Fig. 2C) in schizophrenia. Together, Figures 1 and 2 and Table 1 show, for example, that the main area with increases in EC directed toward other brain areas is the precuneus (and to a lesser extent the right precentral gyrus). Areas with mainly decreases in FC directed to other brain regions in schizophrenia include the parahippocampal gyrus, temporal cortical areas, the anterior cingulate cortex, and medial prefrontal cortex (Fig. 2B).
Source regions of altered EC
Some of the quantitative changes in EC for the main regions are summarized in Tables 1–3, which show not only the statistically significant differences in EC in schizophrenia, but also the EC values in both directions in both the healthy controls and the patients with schizophrenia, as follows. Figure 1 complements this description. (Supplementary Tables S3 and S4 show the FC differences between the patients with schizophrenia and the healthy controls, for comparison).
First, the precuneus has high effective connectivities in schizophrenia directed to areas that include the parahippocampal and hippocampal cortices, temporal, fusiform and occipital areas, and superior parietal and paracentral cortices (Table 2). The direction of this increase of EC is the direction that is the weaker, which we refer to as a backprojection. The EC is almost not different between schizophrenics and controls in the forward direction.
Second, the EC from the closely related posterior cingulate cortex (PCC) to parahippocampal and temporal cortices is higher in schizophrenia (Table 2). The direction of this increase of EC is the direction that is the weaker, which we refer to as a backprojection. The EC is almost not different between schizophrenics and controls in the forward direction.
Third, the effective connectivities from the parahippocampal cortex to temporal, occipital, and calcarine mainly visual areas is lower in schizophrenia. This is the stronger direction of the connectivity. Some of these reduced effective connectivities were to medial orbitofrontal cortex areas (Rectus, OLF) and the insula.
Fourth, the EC from the temporal pole to medial orbitofrontal cortex areas (Rectus, OFCmed, OFCpost, Frontal_Med_Orb (ventromedial prefrontal cortex), OLF) were lower in schizophrenia. This is the stronger direction of the connectivity. The effective connectivities from temporal cortical areas to other temporal cortical areas and to occipital, calcarine, and lingual areas were also lower in schizophrenia.
Fifth, the fusiform gyrus (involved in face and other visual perception) has low EC in schizophrenia to the lateral orbitofrontal cortex (FrontalInfOrb2, involved in non-reward), to the precuneus and cuneus, and to early visual cortical areas. This is the stronger direction of the connectivity.
Sixth, the anterior cingulate cortex and the adjoining superior medial prefrontal cortex have low EC in schizophrenia to cingulate cortex regions.
Seventh, Heschl’s gyrus (auditory) has low EC to temporal and some other areas.
Eighth, a number of motor/somatosensory regions (e.g., precentral, postcentral, paracentral, supplementary motor area) have low EC to other motor and other areas (Tables 1 and 2).
Target regions of altered EC
Tables 1 and 3 show areas that receive different EC from other areas in schizophrenia.
First, the parahippocampal gyrus receives increased EC in schizophrenia from temporal cortex areas (involved in perception), from the precuneus (involved in the sense of self), and from the posterior cingulate (involved in memory). This is the weaker direction of the connectivity.
Second, many temporal cortical areas and early visual cortical areas receive low EC in schizophrenia.
Summary of the main differences in EC in schizophrenia
| Region 1 (a set of regions) | Region 2 | z value of region 1 to 2 EC | z value of region 2 to 1 EC | EC of region 1 to 2 in HC | EC of region 1 to 2 in SCZ | EC of region 2 to 1 in HC | EC of region 2 to 1 in SCZ |
|---|---|---|---|---|---|---|---|
| Cingulate_Post_L, ParaHippocampal_L, Fusiform_L, Temporal_Sup_L, Temporal_Mid_L, Temporal_Sup_R | Cuneus_L | −2.653 | 0.517 | 0.0414 | 0.0358 | 0.0179 | 0.0211 |
| Fusiform_L, Temporal_Mid_L, Temporal_Pole_Mid_R, Temporal_Mid_R, Fusiform_R, ParaHippocampal_R | Cuneus_R | −4.315 | 0.713 | 0.0487 | 0.0398 | 0.0130 | 0.0147 |
| Temporal_Inf_R, Temporal_Pole_Mid_R, Thalamus_R, Precuneus_R, Cingulate_Post_R | ParaHippocampal_R | 2.720 | −0.430 | 0.0215 | 0.0273 | 0.0478 | 0.0512 |
| Frontal_Inf_Oper_L, Heschl_L, Temporal_Pole_Mid_L | Temporal_Sup_L | −4.789 | −0.889 | 0.0460 | 0.0389 | 0.0430 | 0.0442 |
| ParaHippocampal_L, Heschl_L, Temporal_Pole_Mid_L, Cingulate_Post_R | Temporal_Mid_L | −2.305 | −0.799 | 0.0306 | 0.0287 | 0.0351 | 0.0367 |
| Temporal_Pole_Mid_R, Heschl_R, Cingulate_Post_R | Temporal_Mid_R | −1.294 | 0.750 | 0.0342 | 0.0334 | 0.0413 | 0.0480 |
| Temporal_Pole_Mid_R, Heschl_R, Amygdala_R, ParaHippocampal_R, Hippocampus_R | Temporal_Pole_Sup_R | −4.297 | −0.292 | 0.0478 | 0.0421 | 0.0386 | 0.0408 |
| Precuneus_L, Temporal_Pole_Mid_R, Heschl_R, Precuneus_R, Amygdala_R | Temporal_Sup_R | −0.990 | −0.790 | 0.0286 | 0.0254 | 0.0427 | 0.0444 |
| Rolandic_Oper_L, Calcarine_L, Precuneus_L, Temporal_Pole_Mid_L, Precuneus_R | Fusiform_L | 0.960 | 0.286 | 0.0187 | 0.0192 | 0.0411 | 0.0457 |
| Precuneus_L, Temporal_Pole_Mid_R, ParaHippocampal_R | Fusiform_R | −1.357 | 2.274 | 0.0350 | 0.0326 | 0.0305 | 0.0395 |
| ParaHippocampal_L, Lingual_L, Fusiform_L, Paracentral_Lobule_L, Temporal_Sup_L, Temporal_Pole_Mid_L, Fusiform_R, Lingual_R | Occipital_Sup_L | −4.333 | 0.372 | 0.0468 | 0.0389 | 0.0253 | 0.0283 |
| Temporal_Pole_Mid_R, Fusiform_R, ParaHippocampal_R | Occipital_Sup_R | −4.101 | 0.080 | 0.0468 | 0.0386 | 0.0170 | 0.0175 |
| ParaHippocampal_L, Fusiform_L, Precuneus_L, Temporal_Pole_Mid_L, Precuneus_R | Occipital_Mid_L | −1.232 | 2.206 | 0.0289 | 0.0262 | 0.0274 | 0.0375 |
| Precuneus_L, Temporal_Pole_Mid_R, Precuneus_R, Postcentral_R, ParaHippocampal_R, Precentral_R | Occipital_Mid_R | −1.393 | 0.133 | 0.0336 | 0.0307 | 0.0247 | 0.0292 |
| ParaHippocampal_L, Fusiform_L, Temporal_Sup_L, Temporal_Pole_Mid_L | Lingual_L | −4.752 | −0.426 | 0.0569 | 0.0474 | 0.0246 | 0.0258 |
| Fusiform_L, Temporal_Pole_Mid_R, Postcentral_R, Fusiform_R, ParaHippocampal_R | Lingual_R | −4.555 | −0.339 | 0.0657 | 0.0572 | 0.0227 | 0.0236 |
| Fusiform_L, Temporal_Pole_Mid_R, Temporal_Sup_R, ParaHippocampal_R | Calcarine_R | −4.351 | 1.481 | 0.0475 | 0.0359 | 0.0145 | 0.0175 |
| OFCmed_L, Temporal_Pole_Mid_R, ParaHippocampal_R | Olfactory_R | −3.650 | −1.341 | 0.0544 | 0.0455 | 0.0260 | 0.0259 |
| Supp_Motor_Area_L, Pallidum_R, Putamen_R, Supp_Motor_Area_R | Frontal_Inf_Oper_R | −4.316 | −2.082 | 0.0419 | 0.0354 | 0.0319 | 0.0316 |
| Pallidum_R, Putamen_R, SupraMarginal_R, ParaHippocampal_R, Supp_Motor_Area_R, Frontal_Inf_Tri_R, Frontal_Inf_Oper_R | Insula_R | −4.036 | −1.671 | 0.0475 | 0.0420 | 0.0342 | 0.0331 |
| Supp_Motor_Area_L, Frontal_Med_Orb_L, Paracentral_Lobule_L, Heschl_L, Paracentral_Lobule_R, Cingulate_Ant_R, Frontal_Sup_Medial_R, Supp_Motor_Area_R | Cingulate_Mid_L | −3.916 | −0.002 | 0.0386 | 0.0327 | 0.0380 | 0.0418 |
| Cingulate_Mid_L, Putamen_R, Cingulate_Ant_R, Frontal_Sup_Medial_R, Supp_Motor_Area_R | Cingulate_Mid_R | −2.181 | −0.715 | 0.0442 | 0.0440 | 0.0580 | 0.0614 |
| Precentral_L, Frontal_Sup_2_L, Postcentral_L, Precentral_R | Supp_Motor_Area_L | 4.203 | −2.269 | 0.0551 | 0.0740 | 0.0387 | 0.0379 |
| Supp_Motor_Area_L, Paracentral_Lobule_L, Paracentral_Lobule_R, Occipital_Mid_R, Supp_Motor_Area_R | Precentral_R | −4.816 | 0.689 | 0.0439 | 0.0363 | 0.0704 | 0.0810 |
| Paracentral_Lobule_L, Paracentral_Lobule_R, Supp_Motor_Area_R | Postcentral_R | −5.081 | 1.951 | 0.0521 | 0.0451 | 0.0554 | 0.0686 |
| Precentral_L, Supp_Motor_Area_L, Amygdala_L, Paracentral_Lobule_L, Heschl_L, Paracentral_Lobule_R, Supp_Motor_Area_R | Postcentral_L | −4.830 | 1.545 | 0.0484 | 0.0410 | 0.0522 | 0.0619 |
| ParaHippocampal_L, Precuneus_L, Paracentral_Lobule_L, Paracentral_Lobule_R, Precuneus_R | Parietal_Sup_L | −0.350 | 0.770 | 0.0336 | 0.0359 | 0.0336 | 0.0408 |
| Cingulate_Ant_L, Putamen_L, Pallidum_L, Thalamus_R, Pallidum_R | Thalamus_L | −4.402 | −1.482 | 0.0462 | 0.0398 | 0.0403 | 0.0404 |
| Cingulate_Ant_L, Putamen_L, Thalamus_L, Pallidum_R | Thalamus_R | −4.476 | −2.480 | 0.0433 | 0.0370 | 0.0465 | 0.0448 |
A positive value for z indicates a higher EC in SCZ.
Third, many motor and somatosensory areas receive low EC in schizophrenia.
Forward EC links tend to decrease in schizophrenia, and backward to increase in strength
Figure 3A makes the interesting point that strong effective connectivities tend to decrease in schizophrenia; and weak effective connectivities to increase in schizophrenia. Figure 3B makes a similar point for the functional connectivities in schizophrenia. This may be one prototypical rule for the changes in effective and FC in schizophrenia.
We hypothesized that what is shown in Figure 3A might be because in schizophrenia the stronger EC between any two areas, which normally conveys information forward from one cortical area to another from, for example, the sensory input up through a cortical hierarchy (Rolls 2016a), might tend to be reduced; and the weaker, “backward” or “top-down” effective connectivities might increase or show less difference in schizophrenia. To assess this, for each of the 196 links that had significantly different effective connectivities in schizophrenia, the forward versus backward direction was defined using the mean values from the whole group (controls and schizophrenics). (The forward direction was defined for the present analyses as the direction in which the EC was stronger.) Then the mean difference across participants between the value in the controls and the patients was calculated for each link. This was done separately for the forward and the backward link directions. A paired t-test was then performed of these differences across all 196 links. The t value for the forward links was −3.19, indicating that these links had lower values in the Forward direction in schizophrenia than in controls (P = 0.0017). The t value for the Backward links was 2.02 (P = 0.045), indicating that the mean of these links in the backward direction was higher in schizophrenia than in controls. The difference between the forward and backward effective connectivities was considerably smaller in the schizophrenia group than in the controls (t = 3.77, P = 1.86e-4).
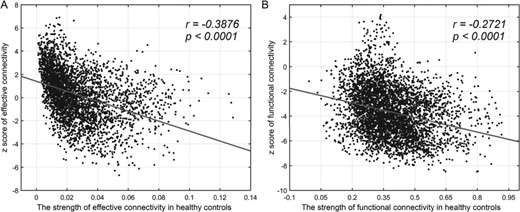
(A) The differences in effective connectivities (measured by the z score) in schizophrenia as a function of their strength in healthy controls. The links included are those that meet the two criteria used elsewhere, of a value for the EC > 0.03, and significantly different between patients and controls. (B) The differences in functional connectivities for the same links as in A in schizophrenia as a function of their strength in healthy controls. The links included are the same as those in A. Linear regression lines are shown for convenience, and provide evidence for a negative correlation between the difference in effective or FC in schizophrenia, and the strength of the effective connectivity.
In summary, these analyses provide evidence that for the effective connectivities that are significantly different in schizophrenia, the strength in the forward direction is smaller in schizophrenia, and in the backward direction is significantly higher in schizophrenia (as shown in Supplementary Fig. S2 and in the Supplementary material).
As a control to test whether these effects were specific for schizophrenia, the same analyses were performed in datasets of 338 individuals with major depressive disorder and 350 controls; and of 394 people with autism and 473 controls. The results are shown in Supplementary Figure S2 and show that for the significantly different effective connectivities in schizophrenia, on average the forward (stronger) effective connectivities were smaller, whereas the backward connectivities were little different or a little higher, in schizophrenia. The same selective lower forward EC was not found for the same links in separate populations with depression and with autism, suggesting that this pattern of smaller forward connectivity in schizophrenia for these links and relatively similar backprojections was characteristic of the population with schizophrenia. Details are provided in the Supplementary material.
Correlation between the effective connectivities and the schizophrenia symptom scores and the duration of the illness
The correlations between the mean PANSS scores for the positive, negative, and general symptoms, and for the total PANSS score (PANSS), and the illness duration, are shown in Table 4.
The correlations between effective connectivity and clinical variables
| EC: region 1 to region 2 | Clinical variable | r value | P value | EC: region 1 to region 2 | Clinical variable | r value | P value | ||
|---|---|---|---|---|---|---|---|---|---|
| Amygdala_R | Temporal_Sup_R | Duration | −0.158 | 0.0346 | Precuneus_R | Occipital_Mid_L | General score | 0.284 | 0.0001 |
| Cingulate_Ant_R | Cingulate_Mid_L | General score | −0.147 | 0.0478 | Precuneus_R | Occipital_Mid_L | PANSS | 0.299 | 0.0000 |
| Cingulate_Ant_R | Cingulate_Post_R | General score | −0.180 | 0.0134 | Precuneus_R | Fusiform_L | Positive score | 0.147 | 0.0490 |
| Cingulate_Ant_R | Cingulate_Post_R | PANSS | −0.186 | 0.0109 | Precuneus_R | Parietal_Sup_L | Positive score | 0.220 | 0.0029 |
| Frontal_Med_Orb_L | Cingulate_Mid_L | Duration | −0.187 | 0.0118 | Precuneus_R | Parietal_Sup_L | Duration | 0.148 | 0.0478 |
| Frontal_Sup_2_L | Supp_Motor_Area_L | Duration | 0.167 | 0.0259 | Precuneus_R | Temporal_Sup_R | Positive score | 0.200 | 0.0073 |
| Fusiform_L | Frontal_Inf_Orb_2_L | Positive score | −0.168 | 0.0243 | Precuneus_R | Temporal_Sup_R | Negative score | 0.165 | 0.0275 |
| Fusiform_L | Frontal_Inf_Orb_2_L | Duration | −0.176 | 0.0184 | Precuneus_R | Temporal_Sup_R | PANSS | 0.209 | 0.0049 |
| Fusiform_L | Occipital_Mid_L | Duration | −0.204 | 0.0060 | Precuneus_R | Occipital_Mid_R | Positive score | 0.277 | 0.0002 |
| Fusiform_R | Occipital_Sup_R | Duration | −0.191 | 0.0097 | Precuneus_R | Occipital_Mid_R | Negative score | 0.220 | 0.0031 |
| Fusiform_R | Cuneus_R | Duration | −0.165 | 0.0261 | Precuneus_R | Occipital_Mid_R | General score | 0.317 | 0.0000 |
| Lingual_L | Occipital_Sup_L | Duration | −0.160 | 0.0299 | Precuneus_R | Occipital_Mid_R | PANSS | 0.360 | 0.0000 |
| Occipital_Mid_R | Precentral_R | Positive score | −0.148 | 0.0480 | Precuneus_R | Frontal_Sup_2_R | Positive score | 0.144 | 0.0498 |
| Paracentral_Lobule_L | Occipital_Sup_L | Duration | −0.162 | 0.0275 | Supp_Motor_Area_R | Cingulate_Mid_L | Duration | −0.170 | 0.0217 |
| Paracentral_Lobule_L | Postcentral_R | Duration | −0.148 | 0.0478 | Supp_Motor_Area_R | Postcentral_L | Duration | −0.158 | 0.0345 |
| ParaHippocampal_R | Parietal_Sup_R | Negative score | −0.157 | 0.0357 | Supp_Motor_Area_R | Rolandic_Oper_R | Duration | −0.163 | 0.0295 |
| ParaHippocampal_R | Occipital_Inf_R | General score | −0.165 | 0.0263 | SupraMarginal_R | Insula_R | General score | −0.156 | 0.0365 |
| ParaHippocampal_R | Occipital_Sup_R | Negative score | −0.146 | 0.0389 | Temporal_Inf_R | Parietal_Inf_R | Positive score | 0.222 | 0.0027 |
| ParaHippocampal_R | Occipital_Sup_R | Duration | −0.230 | 0.0019 | Temporal_Inf_R | Parietal_Inf_R | General score | 0.160 | 0.0326 |
| ParaHippocampal_R | Cuneus_R | Negative score | −0.174 | 0.0158 | Temporal_Inf_R | Parietal_Inf_R | PANSS | 0.193 | 0.0095 |
| ParaHippocampal_R | Cuneus_R | Duration | −0.241 | 0.0011 | Temporal_Pole_Mid_L | Calcarine_L | Duration | −0.182 | 0.0144 |
| ParaHippocampal_R | Olfactory_R | Negative score | −0.240 | 0.0010 | Temporal_Pole_Mid_L | Occipital_Mid_L | General score | −0.159 | 0.0335 |
| ParaHippocampal_R | Olfactory_R | PANSS | −0.199 | 0.0069 | Temporal_Pole_Mid_L | Occipital_Inf_L | General score | −0.183 | 0.0137 |
| Postcentral_R | Lingual_R | Duration | −0.156 | 0.0376 | Temporal_Pole_Mid_L | Occipital_Inf_L | PANSS | −0.166 | 0.0263 |
| Precentral_R | Occipital_Mid_R | PANSS | −0.166 | 0.0256 | Temporal_Pole_Mid_L | Occipital_Inf_L | Duration | −0.217 | 0.0034 |
| Precuneus_L | Occipital_Mid_L | Positive score | 0.223 | 0.0027 | Temporal_Pole_Mid_L | Temporal_Mid_L | Duration | −0.211 | 0.0045 |
| Precuneus_L | Occipital_Mid_L | General score | 0.209 | 0.0039 | Temporal_Pole_Mid_R | Temporal_Mid_R | Duration | −0.185 | 0.0128 |
| Precuneus_L | Occipital_Mid_L | PANSS | 0.246 | 0.0006 | Temporal_Pole_Mid_R | Temporal_Sup_R | Duration | −0.188 | 0.0111 |
| Precuneus_L | Occipital_Mid_L | Duration | 0.148 | 0.0484 | Temporal_Pole_Mid_R | Calcarine_R | Positive score | −0.179 | 0.0160 |
| Precuneus_L | Fusiform_L | Positive score | 0.227 | 0.0022 | Temporal_Pole_Mid_R | Calcarine_R | Negative score | −0.163 | 0.0297 |
| Precuneus_L | Parietal_Sup_L | Positive score | 0.243 | 0.0010 | Temporal_Pole_Mid_R | Calcarine_R | General score | −0.170 | 0.0229 |
| Precuneus_L | Parietal_Sup_L | PANSS | 0.148 | 0.0485 | Temporal_Pole_Mid_R | Calcarine_R | PANSS | −0.214 | 0.0040 |
| Precuneus_L | Temporal_Sup_R | Positive score | 0.164 | 0.0284 | Temporal_Pole_Mid_R | Calcarine_R | Duration | −0.235 | 0.0012 |
| Precuneus_L | Fusiform_R | Positive score | 0.188 | 0.0113 | Temporal_Pole_Mid_R | OFCmed_R | General score | −0.161 | 0.0312 |
| Precuneus_L | Occipital_Mid_R | Positive score | 0.151 | 0.0432 | Temporal_Pole_Mid_R | OFCmed_R | PANSS | −0.163 | 0.0275 |
| Precuneus_L | Occipital_Mid_R | General score | 0.179 | 0.0160 | Temporal_Pole_Mid_R | Olfactory_R | Negative score | −0.184 | 0.0137 |
| Precuneus_L | Occipital_Mid_R | PANSS | 0.187 | 0.0115 | Temporal_Pole_Mid_R | Olfactory_R | PANSS | −0.150 | 0.0446 |
| Precuneus_L | Hippocampus_R | Positive score | 0.192 | 0.0097 | Temporal_Pole_Sup_R | Heschl_R | Negative score | −0.155 | 0.0343 |
| Precuneus_R | Occipital_Mid_L | Positive score | 0.237 | 0.0014 | Thalamus_L | Thalamus_R | Duration | −0.223 | 0.0027 |
| Precuneus_R | Occipital_Mid_L | Negative score | 0.149 | 0.0456 | Thalamus_R | Thalamus_L | Duration | −0.228 | 0.0021 |
PANSS—positive and negative symptom total score. Positive, Negative, and General are the PANSS subscores. Duration—illness duration. Bold font shows correlations that pass FDR correction P < 0.05.
Most of the correlations were negative, indicating that weaker effective connectivities were associated with more severe symptoms. However, primarily for the precuneus, the correlations were positive, indicating that for the precuneus increased EC was associated with more severe symptoms.
For the precuneus, 11 of the EC links were correlated with the positive symptom PANSS score, including links to the hippocampus, temporal and fusiform cortex, parietal cortex, and occipital cortex. Four of the precuneus links were associated with the negative score, and five (mostly to occipital areas) with the general PANSS score.
The low effective connectivities in schizophrenia from the fusiform gyrus were especially associated with illness duration. The low effective connectivities from the parahippocampal gyrus in schizophrenia were associated with the negative and general PANSS scores, and with illness duration. The low effective connectivities from the temporal cortical areas were especially associated with the negative and general PANSS symptoms and with illness duration.
In summary, the positive symptoms were especially likely to be associated with high effective connectivities from the precuneus; and the negative and general symptoms with low effective connectivities from areas such as the fusiform, temporal, and parahippocampal areas.
Differences in sigma in schizophrenia
Figure 4 and Table 5 show the differences in sigma in the population with schizophrenia.
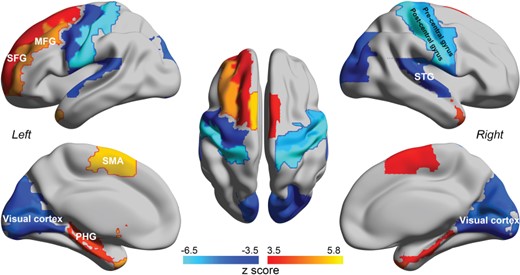
The results of the comparison of Σ between schizophrenia patients and healthy controls. This figure shows the AAL2 areas with significant differences after FDR correction (P < 0.05). Normalization of Σ was used across participants, applied in the same way as for the effective connectivity. Red–yellow indicates AAL2 regions with increased Σ, and blue with decreased Σ, in patients with schizophrenia (see Table 2).
Σ values for AAL2 regions significantly different (FDR corrected) between schizophrenia patients and controls
| Region | T value | P value | Region | T value | P value |
|---|---|---|---|---|---|
| Postcentral_R | −6.491 | 8.52E-11 | Temporal_Pole_Mid_R | 4.240 | 2.24E-05 |
| Postcentral_L | −6.377 | 1.81E-10 | Lingual_L | −4.199 | 2.69E-05 |
| Precentral_R | −5.751 | 8.85E-09 | Heschl_R | −4.107 | 4.00E-05 |
| Caudate_L | 5.735 | 9.77E-09 | Hippocampus_L | 4.087 | 4.37E-05 |
| Caudate_R | 5.667 | 1.46E-08 | Cuneus_L | −4.084 | 4.43E-05 |
| Supp_Motor_Area_L | 5.329 | 9.86E-08 | ParaHippocampal_L | 4.051 | 5.11E-05 |
| Temporal_Pole_Mid_L | 5.066 | 4.07E-07 | OFClat_L | 4.013 | 6.01E-05 |
| Rolandic_Oper_R | −5.052 | 4.38E-07 | Temporal_Sup_R | −3.997 | 6.43E-05 |
| Calcarine_R | −4.962 | 6.98E-07 | Lingual_R | −3.861 | 1.13E-04 |
| Frontal_Mid_L | 4.871 | 1.11E-06 | ParaHippocampal_R | 3.850 | 1.18E-04 |
| Calcarine_L | −4.833 | 1.34E-06 | Occipital_Mid_R | −3.825 | 1.31E-04 |
| Occipital_Sup_L | −4.804 | 1.55E-06 | Supp_Motor_Area_R | 3.772 | 1.62E-04 |
| Cuneus_R | −4.635 | 3.57E-06 | Frontal_Sup_L | 3.723 | 1.97E-04 |
| Occipital_Sup_R | −4.441 | 8.94E-06 | Precentral_L | −3.657 | 2.55E-04 |
| Temporal_Sup_L | −4.384 | 1.16E-05 | Rolandic_Oper_L | −3.598 | 3.21E-04 |
A negative value for z indicates a lower sigma value in schizophrenia patients.
Sigma is high in schizophrenia in areas such as the parahippocampal gyrus and hippocampus; the temporal pole; the superior frontal gyrus; the lateral orbitofrontal cortex; and the caudate nucleus and supplementary motor area. This is consistent with greater signal fluctuations in these regions. The result obtained with the approach used here is consistent with a previous finding that voxel-wise signal variance was increased in schizophrenia (Yang et al. 2014).
Sigma is low in schizophrenia in areas such as the cuneus, early visual cortical areas, Heschl’s gyrus (auditory), and somatomotor areas such as the postcentral and precentral gyri.
Differences of FC between patients with schizophrenia and controls
For reference, we show in Supplementary Table S3 the top 80 links with the most significant differences in FC (measured by the Pearson correlation) between patients with schizophrenia and controls. Supplementary Table S4 shows the functional connectivities for the top 80 links with the most significant differences in EC between people with schizophrenia and controls. The first point of interest is that all the functional connectivities in these sets of links (apart from 1) were lower in schizophrenics than controls, whereas for the effective connectivities, higher effective connectivities were found for some precuneus and PCC effective connectivities (Supplementary Table S4). Second, there were 196 effective connectivities that were significantly different with FDR correction (P < 0.01) between schizophrenics and controls, whereas there were 3050 FC links that were significant with FDR (P < 0.01), and 1411 with Bonferroni correction (P < 0.01, see Fig. S1). The large number of significantly different functional connectivities in this analysis is of interest. We note that this is the first time that we have used unfiltered data for the functional connectivities. Third, prominent among the most different functional connectivities between schizophrenics and controls were links involving the inferior frontal gyrus and the motor cortex (Rolandic operculum).
These comparisons are of interest, for they elucidate one way in which effective connectivities can provide information that is not available from the functional connectivities.
Prediction of schizophrenia from the EC and FC
To further test the connectivities as diagnostic features of schizophrenia, we applied a SVM approach using the whole EC and FC as a biomarker to test how well this could discriminate schizophrenia patients from the healthy controls. We used a 10-fold cross-validation strategy to estimate the generalization of this classifier and to estimate its accuracy, sensitivity, and specificity. Table 6 shows that it is possible to predict (using an SVM) schizophrenia from the EC in the COBRE dataset from the Taiwan dataset and vice versa with a mean accuracy of 75.3%. This is a useful cross-validation. Table 6 also shows that this cross-validation prediction is a little better from the EC (75.3%) than from the FC (72.83%). Further, with the two datasets combined, the prediction of schizophrenia from the effective connectivities was 84.81%, and from the functional connectivities was 80.04% (Table 6). The importance of the EC links involving the precuneus is attested to by the results shown in Supplementary Table S5, which show that the prediction from the effective connectivities of who is schizophrenic is 69.02% correct based only on the precuneus effective connectivities.
The result of classification, that is, of which individuals have schizophrenia from the connectivities
| Classification model | EC | FC | ||||||
|---|---|---|---|---|---|---|---|---|
| Accuracy | AUC | Sensitivity | Specificity | Accuracy | AUC | Sensitivity | Specificity | |
| Taiwan only | 87.32 | 95.12 | 86.03 | 88.49 | 81.09 | 89.13 | 78.11 | 83.78 |
| COBRE only | 79.86 | 88.81 | 76.72 | 82.39 | 75.22 | 84.46 | 69.69 | 79.67 |
| Taiwan predict COBRE | 76.15 | 82.61 | 67.24 | 83.33 | 71.53 | 78.18 | 65.52 | 76.39 |
| COBRE predict Taiwan | 74.52 | 80.35 | 75.61 | 73.53 | 74.13 | 82.19 | 73.17 | 75.00 |
| All: Taiwan + COBRE | 84.81 | 91.94 | 83.80 | 85.68 | 80.04 | 87.78 | 76.19 | 93.40 |
Discussion
A key finding of this investigation in schizophrenia is the high EC directed away from the precuneus and the closely related PCC (Figs 1, 2, and 5 and Tables 1 and 2). The connectivity in the strong (or forward) direction in schizophrenia to the precuneus is similar to that in the healthy controls, and it is in the weak direction that the EC is higher in schizophrenia than in controls. An implication is that the normally weak backprojections from the precuneus to the areas that project to the precuneus are higher in schizophrenia than in controls. It is suggested that by influencing other areas too much by its backrojections, the precuneus may contribute to the symptoms of schizophrenia. The areas to which the backprojections from the precuneus are higher in schizophrenia than in controls include the parahippocampal and hippocampal cortices (Tables 1 and 2). The areas to which the backprojections from the PCC are higher in schizophrenia than in controls include the parahippocampal and temporal cortices (Tables 1 and 2).
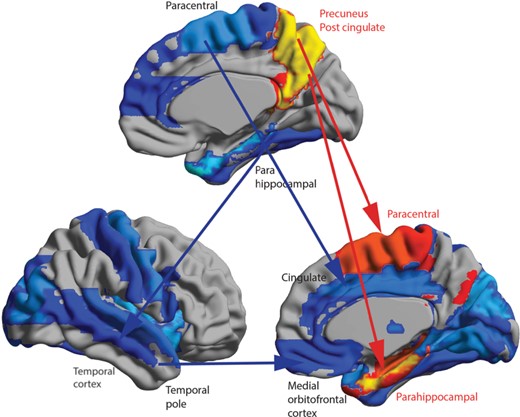
Summary of some of the main differences in effective connectivity in schizophrenia. The source regions (Region 1) are shown in the upper view of the brain, and the target regions (Region 2) in the two lower views of the brain. The AAL2 areas with these differences show higher effective connectivity in red to yellow; and lower effective connectivity in blue. The two main higher effective connectivities are shown here. Further lower effective connectivities were found than can be indicated in arrows, with the further details shown in Tables 1 and 4.
We should therefore consider what the functions are of the precuneus and PCC. The precuneus is a medial parietal cortex region implicated in the sense of self, agency, autobiographical memory, and spatial function (Cavanna and Trimble 2006; Freton et al. 2014), and this may relate to the altered sense of self that is a feature of schizophrenia. The precuneus and the adjoining retrosplenial cortex (areas 29 and 30) (Kobayashi and Amaral 2000, 2003, 2007) (both included in the AAL2 area precuneus used here; Rolls et al. 2015) are key regions related to spatial function, memory, and navigation (Cavanna and Trimble 2006; Freton et al. 2014; Bubb et al. 2017). The retrosplenial cortex provides connections to and receives connections from the hippocampal system, connecting especially with the parahippocampal gyrus areas TF and TH, and with the subiculum (Kobayashi and Amaral 2003, 2007; Bubb et al. 2017). The precuneus can be conceptualized as providing access to the hippocampus for spatial and related information from the parietal cortex (given the rich connections between the precuneus and parietal cortex; Kobayashi and Amaral 2003, 2007; Vogt 2009). This increased EC from the precuneus to the hippocampal system is of special interest as it may contribute to the overactivity of the hippocampus in schizophrenia, which is consistent with the high sigma parameter in schizophrenia discussed below. Further, the precuneus has rich connectivity with the PCC (Vogt 2009), which provides a pathway into the hippocampal memory system (Rolls 2018; Rolls and Wirth 2018). The precuneus is part of the default mode network, which becomes more active when tasks are not being performed in the world, and instead internal thoughts and processing are occurring.
The PCC is also a key region of the default mode network with strong connectivity in primates with the entorhinal cortex and parahippocampal gyrus, and thus with the hippocampal memory system (Vogt and Pandya 1987; Vogt 2009; Bubb et al. 2017). The posterior cingulate region (including the retrosplenial cortex) is consistently engaged by a range of tasks that examine episodic memory including autobiographical memory, and imagining the future, and also spatial navigation and scene processing (Auger and Maguire 2013; Leech and Sharp 2014).
The proposal that we now make based on the findings described here and the evidence about the functions of the precuneus and PCC just considered is that the high backprojection effective connectivities from the precuneus may relate to increased internal thoughts about the self in schizophrenia, the world in which the self exists, and the relatively greater role of these internal thoughts that are not dominated by the sensory inputs from the word, which normally keep the self in contact with the real world and with real-word inputs. Correspondingly, we propose that the high backprojection effective connectivities from the PCC in schizophrenia may relate to increased memory-related internal thoughts involving relatively higher dominance of memories over the normal forward real-world sensory inputs that normally keep us in contact with the real world.
Consistent with this relative dominance of backprojection inputs from the precuneus and PCC over bottom-up sensory and related inputs from the real world, we found that most other effective connectivities that were different in schizophrenia involved low effective connectivities. These included low effective connectivities from Heschl’s gyrus to temporal and some other areas, which might reduce the effects of external auditory input relative to internally generated auditory-related phenomena such as hearing internally generated voices. Perhaps correspondingly, the fusiform gyrus (involved in face and other visual perception; Kanwisher et al. 1997; Caspers et al. 2015) has low EC in schizophrenia to the lateral orbitofrontal cortex and to the precuneus and cuneus, which may reduce the impact of signals from the real world relative to internally generated scenarios. Thus, the proposal we make is that the reduced forward inputs to high-order areas such as the precuneus and PCC involved in the sense of self and of memories about the self, and the increased backward projections from the precuneus and PCC, lead to internally generated scenarios about the self becoming detached from and dominating the forward inputs normally brought to these regions from the real world.
Figure 3A makes the interesting point that strong effective connectivities tend to decrease in schizophrenia; and weak effective connectivities to increase in schizophrenia. Figure 3B makes a similar point for the functional connectivities in schizophrenia. In both cases, an important point is that there is a negative correlation between the difference in effective (or functional) connectivity in schizophrenia and the connectivity value. This may be one prototypical rule for the changes in effective and FC in schizophrenia. The decrease in the strong effective connectivities is consistent with the disconnection hypothesis (Friston and Frith 1995). An implication is that the difference between the forward (defined as stronger) and backward (defined as weaker) EC between a pair of brain areas tends to be reduced in schizophrenia. As shown in the Results, across all links the forward connectivities (i.e., in the stronger direction) tended to be weaker in schizophrenia, with relatively little difference for the backward effective connectivities (those in the weaker direction). Moreover, this pattern was not found in the same way for the same EC links in two other mental disorders, depression and autism. An implication of this is that the feedforward sensory inputs from the world are less effective in schizophrenia; and that the top-down backward connectivities that mediate the effects of memory recall and attention (Rolls 2016a) show little difference in schizophrenia. This would tend to disconnect the individual from the world; and enclose the patient in an imaginary world too dominated by internal representations not corrected toward reality by sensory information from the world. Put in another way, if top-down signals are increased relative to bottom-up signals this would increase the importance of priors, that is, beliefs, at the cost of sensory signals, representing a possible mechanism for the emergence of hallucinations and delusions (Tschacher et al. 2017). In this sense, the present findings go beyond the disconnection hypothesis of schizophrenia (Friston and Frith 1995).
Another finding was of reduced effective connectivities between somatomotor and related areas (Tables 1,2, and 3), and these may relate to the reduced sense of agency and being in control in schizophrenia.
Sigma was high in schizophrenia in the parahippocampal gyrus and hippocampus. This is consistent with greater signal (or signal fluctuations) in these regions. Consistent with this, hippocampal glutamate is increased in unmedicated schizophrenia, and a decrease of regional cerebral blood flow in the hippocampus produced by antipsychotics correlates with their efficacy (Birur et al. 2017). It is suggested that the reduced GluN1 receptor in the dentate gyrus may decrease pattern separation in the dentate (Das et al. 2014; Scott and Tamminga 2018), and lead to increased less sparse firing in CA3, which may make memories more similar to each other in schizophrenia, and promote a low memory capacity and frequent entries into the same few basins of attraction, corresponding to being confined to a space with a few over-stable memories. The high EC from the precuneus to the hippocampal system may contribute to the hippocampal overactivity in schizophrenia, we suggest.
The lateral orbitofrontal cortex, the temporal pole, and superior frontal gyrus also had a high sigma in schizophrenia. In the case of the temporal pole, it had reduced effective connective directed to a number of regions (Tables 2 and 3).
Sigma is low in schizophrenia in areas such as the cuneus, early visual cortical areas, Heschl’s gyrus (auditory), and somatomotor areas such as the postcentral and precentral gyri. This is consistent with low-signal fluctuations in these regions in schizophrenia, and is also consistent with the hypothesis described above that there is reduced forward input from the world in schizophrenia, relative to the greater influence of top-down backprojections from areas such as the precuneus and PCC.
An important advantage of EC compared to FC in this investigation is that the EC measure shows that it is EC directed away from the precuneus and PCC that is increased in schizophrenia. An implication is that these are key regions that underlie schizophrenia. Moreover, as shown here, these normally weak backprojection effective connectivities from the precuneus are not only stronger in schizophrenia, but are correlated with the positive symptoms of schizophrenia. Another important advantage is that the measurement of EC enabled the discovery that the forward effective connectivities are reduced more than in the backward direction for the significantly different connections in schizophrenia (Fig. 5), which could not have been analyzed or understood with measures of FC, which reflect correlations and not directed effects between areas.
In the present investigation lower effective connectivities were found between many brain regions in schizophrenia (Tables 1–3; Figs 1–3). This is consistent with the hypothesis that one of the changes in schizophrenia is increased noise in these areas, due to reduced stability of cortical attractor networks in some brain regions (Loh et al. 2007a, 2007b; Rolls et al. 2008; Rolls and Deco 2011; Rolls 2012a).
The findings described here point toward two key potential advances in understanding the neurological basis of schizophrenia. First, increased EC from systems involving the precuneus, and PCC that are implicated in representations of the self, agency, and autobiographical memory may be a contributor to the often changed sense of self and agency in schizophrenia. Second, the generally reduced forward EC, but relatively similar backward EC, in schizophrenia compared to controls, may tend to result in over-emphasis on the internal world, with relative disconnection from the reality of the external world. This paper shows how taking EC into account can be very important in understanding the functions of the cerebral cortex, because it enables the forward and the backward connectivity between every pair of brain regions to be estimated. Having stronger forward than backward connectivity is crucial for the operation of many cortical systems, including systems for sensory processing, memory storage and recall, and top-down attention (Rolls 2016a), and the approach utilized here enables this issue to be investigated for a large number of different cortical and related areas. In this paper, we show how this may be important in understanding some mental disorders, such as schizophrenia.
Funding
Shanghai Science and Technology Innovation Plan [No. 15JC1400101 and No. 16JC1420402 to J.F.], the National Natural Science Foundation of China [Grant No. 71661167002 and No. 91630314 to J. F.], The 111 Project [No.B18015 to J.F.], Shanghai Municipal Science and Technology Major Project [No.2018SHZDZX01 to J.F.] and ZJLab, National Natural Sciences Foundation of China [No.81701773, 11771010 to W.C.], Sponsored by Shanghai Sailing Program [No. 17YF1426200 to W.C.], Natural Science Foundation of Shanghai [No. 18ZR1404400 to W.C.], Ministry of Science and Technology, Taiwan [NSC100-2911-I-010-010, NSC101-2911-I-010-009, NSC100-2628-E-010-002-MY3, NSC102-2321-B-010-023, and NSC103-2911-I-010-501 to C.P.L.], National Health Research Institutes [NHRI-EX103-10310EI to C.P.L], Ministry of Health and Welfare of Taiwan (DOH102-TD-PB-111-NSC006 to C.P.L), Academia Sinica, Taipei, Taiwan [to C.P.L.], Human Brain Project (grant FP7-FET-ICT-604102 and H2020-720270 HBP SGA1 to G.D.) and the Marie Sklodowska-Curie Action (grant H2020-MSCA-656547 to M.G.).
Notes
Edmund T. Rolls, Wei Cheng and Jianfeng Feng contributed to the design of the study. Chun-Yi Zac Lo; Albert C. Yang; Shih-Jen Tsai; Mu-En Liu; Ching-Po Lin contributed to the collection of the data. Wei Cheng, Edmund T. Rolls, Matthieu Gilson, Gustavo Deco, and Weikang Gong contributed to the analysis of the data and the preparation of the manuscript. Edmund T. Rolls and Wei Cheng participated in writing the paper. All collaborators had an opportunity to contribute to the interpretation of the results and to the drafting of the manuscript. Conflict of Interest: None declared.
References
Author notes
Edmund T Rolls and Wei Cheng contributed equally to this work.