


Abstract
The medial prefrontal cortex (mPFC) is closely involved in many higher-order cognitive functions, including learning to associate temporally discontiguous events (called temporal associative learning). However, direct evidence for the role of mPFC and the neural pathway underlying modulation of temporal associative motor learning is sparse. Here, we show that optogenetic inhibition of the mPFC or its axon terminals at the pontine nuclei (PN) during trace intervals or whole trial period significantly impaired the trace eyeblink conditioning (TEC), but had no significant effects on TEC during the conditioned stimulus or intertrial interval period. Our results suggest that activities associated with the mPFC–PN projection during trace intervals is crucial for trace associative motor learning. This finding is of great importance in understanding the mechanisms and the relevant neural pathways underlying mPFC modulation of temporal associative motor learning.
Introduction
Learning to associate temporally discontiguous events (called temporal associative learning; e.g., trace conditioning) is difficult but necessary for the formation of episodic and working memories (Suh et al. 2011; Gilmartin et al. 2013; Kitamura et al. 2014). Indeed, numerous studies demonstrate that trace conditioning, a commonly used procedure of Pavlovian associative learning typified by the insertion of a stimulus-free temporal gap (i.e., trace interval) between the presentations of a conditioned stimulus (CS) and an unconditioned stimulus (US), requires an increased number of trials for learning to occur (Beylin et al. 2001; Kishimoto et al. 2006; Caro-Martin et al. 2015). Trace conditioning also requires the participation of multiple forebrain regions, including the medial prefrontal cortex (mPFC), motor cortex for successful learning (Han et al. 2003; Simon et al. 2005; Gilmartin et al. 2013; Hasan et al. 2013; Siegel and Mauk 2013; Ammann et al. 2016). In contrast, the mPFC is not directly involved in delay conditioning, where the CS overlaps with the US (Han et al. 2003; Oswald et al. 2006; Leal-Campanario et al. 2007; Gilmartin and Helmstetter 2010).
Prior work with primates showed that the PFC mediates working memory via persistent neural activity during the temporal intervals in delayed response tasks (Fuster and Alexander 1971; Fuster 1973; Compte et al. 2003). Subsequently, several lines of indirect evidence suggests that persistent activity of mPFC neurons occured during the stimulus-free temporal gap is crucial for temporal associative learning (Baeg et al. 2001; Takehara-Nishiuchi and McNaughton 2008; Siegel et al. 2012; Gilmartin et al. 2013; Siegel and Mauk 2013). For instance, several studies found that a subset of neurons in mPFC show sustained firing during the trace interval in trace fear conditioning (Baeg et al. 2001; Gilmartin and McEchron 2005). Similarly, persistent activity in the mPFC is also observed during the trace interval in trace eyeblink conditioning (TEC) (Takehara-Nishiuchi and McNaughton 2008; Siegel et al. 2012; Siegel and Mauk 2013). Moreover, multiple studies showed that electrical, pharmacological, or genetic lesions of mPFC retarded trace fear conditioning and TEC, providing further support for this hypothesis (Simon et al. 2005; Takehara-Nishiuchi et al. 2005; Gilmartin and Helmstetter 2010). However, in vivo cellular electrophysiology studies did not establish a causal relationship between mPFC neuronal activities and specific behaviors. Moreover, time resolutions from inactivation and lesion approaches are poor for addressing the role of mPFC persistent activity during the trace interval of trace conditioning. Fortunately, optogenetic approaches allow us to instantaneously inhibit the neuronal activity of mPFC, which provides a valuable opportunity to directly test our hypothesis. In addition, because mPFC neurons project to many different brain regions, including pontine nuclei (PN), the reticulotegmental nucleus, the dorsal raphe nucleus, the dorsal thalamus, and hypothalamus (Boele et al. 2010; Maeng et al. 2010; Warden et al. 2012; Xu and Sudhof 2013; Moya et al. 2014), it is desirable to clarify which projection pathways are specifically involved in modulation of the temporal associative motor learning. It is well established that the PN converges CS-related afferents and conveys them to the cerebellum via mossy fibers to support associative motor learning (Thompson 2005). We recently showed that the delay eyeblink conditioning (DEC) cued with an extremely weak CS was modulated by mPFC–PN projections (Wu et al. 2017). Thus, we tested the hypothesis that activity of subpopulations of excitatory neurons in the caudal mPFC that project to the PN during a stimulus-free temporal gap is crucial for the TEC, a typical form of temporal associative motor learning.
Materials and Methods
Animals
Adult male Sprague Dawley rats, weighing 350–400 g (3–4 months) at the time of virus injection, were individually housed in standard cages on a 12:12 light/dark cycle with free access to food and water ad libitum. Behavioral experiments were performed during the light cycle. The room temperature was maintained at 25 ± 1°C. All animal procedures were approved by the Animal Care Committee of the Third Military Medical University and were performed in accordance with the principles outlined in the National Institutes of Health Guide for the Care and Use of Laboratory Animals.
Virus Injection
Rats were anaesthetized with a mixture of ketamine (100 mg/kg, i.p., Gutian, Fujian, China) and xylazine (9 mg/kg, i.p., Sigma-Aldrich, St. Louis, MO, USA) and fixed in a stereotaxic apparatus (Model 942, David Kopf Instruments, Tujunga, California, USA) as described previously (Wu et al. 2015, 2017). The virus was injected using a glass micropipette (tip diameter 10–20 μm) attached to a 5 μL Hamilton microsyringe (51 189, Stoelting, Wood Dale, Illinois, USA). The injection rate (0.05 μL/min) was controlled by a stereotaxic microsyringe pump (53 311, Stoelting). After injection, the needle was left in place for 5 additional minutes and then slowly withdrawn. For optogenetic inhibition of the bilateral caudal mPFC and of its axon terminals in the right PN, rats were bilaterally microinjected with 0.5 μL of pAAV 2/9-CaMKIIα-eNpHR3.0-EYFP [Viral titers: 2.24 × 10¹³ genome copy (GC)/mL] or pAAV 2/9-CaMKIIα-EYFP (Viral titers: 1.30 × 10¹³ GC/mL) into the mPFC [anteroposterior (AP) + 1.92 mm from bregma, mediolateral (ML) ± 0.9 mm, dorsoventral (DV) −3.0 mm] (Fig. 1A,B). These above vectors were obtained from AddGene and packaged by Obio Technology (Shanghai, China).
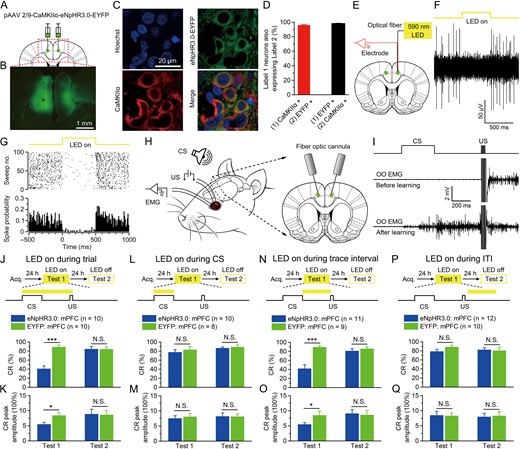
Optogenetic inhibition of the mPFC during trace interval impairs the TEC retrieval. (A) Rats were injected with pAAV 2/9-CaMKIIα-eNpHR3.0-EYFP or pAAV 2/9-CaMKIIα-EYFP targeting the bilateral caudal mPFC. (B) Example of eNpHR3.0-EYFP expression in the bilateral caudal mPFC. (C) Representative images showing cell-specific eNpHR3.0-EYFP expression (green) in pyramidal neurons (red) in mPFC. (D) Statistics of expression in pyramidal neurons (428 cells, from 4 rats). (E) Schematic of in vivo optogenetic inhibition and recording in the right caudal mPFC. (F,G) Continuous 590-nm LED illumination (250 ms, 15 mW/mm2) of the mPFC expressing eNpHR3.0-EYFP in anesthetized rats inhibited neuronal firing in a temporally precise, stable, and reversible manner. (H) Behavioral diagram. For TEC training, a 500-ms, 2-kHz, 85-dB pure tone were presented as a conditioned stimuli (CS), and 4 electrodes were implanted in the upper left eyelid, 2 for electrical stimulation as a unconditioned stimuli (US) and the other 2 for recording the EMG activity of the orbicularis oculi (OO) muscle. For optogenetic inhibition of the bilateral caudal mPFC, 2 fiber-optic cannulae were implanted with an angle of 15°. (I) Upper panel: The conditioning paradigm illustrating the timing of the CS and the US. Middle and lower panels: Representative OO EMG before and after learning. (J–Q) Top: Training and illumination phase protocol. Bottom: Effects of the caudal mPFC optogenetic inhibition during the whole trial (J,K), CS (L,M), trace interval (N,O), or ITI (P,Q) period on CR% and CR peak amplitude of TEC retrieval (N.S., not significant, *P < 0.05, ***P < 0.001; 2-tailed unpaired Student’s t-test). Data are represented as mean ± s.e.m.
Immunohistochemistry
For immunohistochemistry experiments, rats were injected with an overdose of 10% chloral hydrate (1000 mg/kg, i.p., Kelong, Chengdu, China) and perfused transcardiacally with physiological saline followed by cold 4% paraformaldehyde (PFA; prepared in 0.1 M of phosphate buffer, pH 7.4). The brains were removed from the skull and stored in 4% PFA at 4°C for 24 h, then transferred to a 30% sucrose solution at 4°C for 48 h. About 30 μm-thick coronal sections were cut on a freezing microtome (CM3050 S, Leica, Germany) and collected in cold phosphate buffer saline (PBS, 0.01 M, pH 7.4). For immunostaining, each slice was placed in PBST (PBS + 0.3% Triton X-100) with 2% normal bovine serum albumin for 1 h then incubated with primary antibody at 4°C for 24 h (Mouse anti-CaMKIIα 1:100, C265, Sigma-Aldrich). Slices then underwent 3 wash steps for 10 min each in PBST, followed by 2 h incubation with secondary antibody (Goat anti-mouse conjugated to AlexaFluor568). Slices were washed with PBST (once, 10 min) and incubated for 10 min with Hoechst (1:2000, 861 405, Sigma-Aldrich), and then underwent 3 more wash steps of 10 min each in PBST, followed by mounting and coverslipping on microscope slides. Confocal fluorescence images were acquired on a Carl Zeiss LSM 780 scanning laser microscope (Germany) using a 10 × air objective or a 40 × oil immersion objective.
Electrophysiological Verification of Optogenetics
The virus-infected rats were anaesthetized by 10% chloral hydrate (400 mg/kg, i.p., Kelong) and their heads were placed in a stereotaxic apparatus (Model 942, David Kopf). An optrode consisting of a fiber-optic cannula (ceramic ferrule: diameter 1.25 mm; optical fiber: 200 μm core diameter, 0.39 NA, FT200EMT, Thorlabs, Newton, New Jersey, USA) with a multi-wire electrode tightly coupled with an optical fiber, with the tips of the electrodes extending approximately 300 μm beyond the tip of optical fiber was used for light-emitting diode (LED) illumination and extracellular or field excitatory postsynaptic potentials (fEPSPs) recordings in the anaesthetized rats. In order to verify the effects of LED illumination of the axon terminals in the PN of eNpHR3.0—expressing mPFC pyramidal neurons, the fEPSPs in PN evoked by electrical stimulation of the mPFC were recorded pre, during and post the PN illumination, respectively (see below, Fig. 3D–F). Electrodes were made of 16 individually insulated nichrome wires (17.78 μm inner diameter, 761 000, A-M Systems, Sequim, WA, USA), attached to a 20-pin connector. Extracellular and fEPSPs signals were bandpass filtered (0.3–5 kHz and 0.3–500 Hz, respectively), amplified (1000×) using a 16-channel microelectrode amplifier (model 3600, A-M Systems, Sequim, WA, USA) and acquired with a data acquisition system (Powerlab 16/35, ADInstuments, New South Wales, Australia) with a sampling rate of 20 kHz. Spike data were analyzed with NeuroExplorer 4 (MicroBrightField, Williston, VT, USA), a neurophysiological data analysis software.
To confirm the physiological effect of LED illumination of eNpHR3.0 on mPFC neuronal activities, The optrode (as described above) was slowly lowered to the right caudal mPFC using a hydraulic micromanipulator (PC-5N, Narishige, Tokyo, Japan) in anesthetized rats transduced in the bilateral caudal mPFC (Fig. 1E) with the pAAV 2/9-CaMKIIα-eNpHR3.0-EYFP virus. The optical fiber was connected to a 590-nm LED (M590F1, Thorlabs, Newton, New Jersey, USA) controlled by a pulse stimulator (Master-9, A.M.P.I., Jerusalem, Israel). The power density of light emitted from the optrode was calibrated to 15 mW/mm2. After spontaneous firing of neurons was detected, constant 590 nm LED illumination (100 epochs of 250 ms, separated by a variable interval of 20–40 s) reliably suppressed neural activities in a temporally precise, stable, and reversible manner (Fig. 1F,G).
To verify the effects of LED illumination of axon terminals of eNpHR3.0—expressing mPFC pyramidal neurons in the PN, anesthetized rats expressing pAAV 2/9-CaMKIIα-eNpHR3.0-EYFP in the bilateral caudal mPFC were implanted with an concentric stimulating electrode aimed at the right caudal mPFC (AP + 1.92 mm, ML 0.90 mm, DV −3.00 mm) and with the optrode (as described above) aimed at the right PN (AP −7.32 mm, ML 0.90 mm, DV −10.00 mm) using 2 hydraulic micromanipulators (PC-5N, Narishige; Fig. 3D). fEPSPs were evoked in the right PN by single 50 μs, square, cathodal pulses (stimulus intensities ranged from 50 to 120 μA) applied to the right caudal mPFC pre, during (LED on), and post delivering constant 50 epochs of 500-ms LED illumination (590 nm, 25 mW/mm2), separated by a variable interval of 20–40 s, to the caudal mPFC axon terminals in the PN. As expected, the slope of the fEPSPs evoked at the right caudal mPFC was significantly decreased by optogenetic illumination of the caudal mPFC axon terminals in the right PN (Fig. 3E,F).
Surgery
All of the rats used for behavior training were anaesthetized with a mixture of ketamine (100 mg/kg, i.p., Gutian, Fujian, China) and xylazine (9 mg/kg, i.p., Sigma-Aldrich) and fixed in a stereotaxic apparatus (Model 942, David Kopf) after virus expression. For delivering the shock US and recording the differential electromyography (EMG) activity of the ipsilateral orbicularis oculi (OO) muscle, rats were implanted with 4 electrodes, made of insulated stainless steel wires (76.2 μm inner diameter, 790 900, A-M Systems) in the upper eyelid of the left eye. One pair of electrodes for delivering the shock US was implanted subdermal caudal to the left eye. The second pair of electrodes was implanted into the ipsilateral OO muscle to record its EMG activity. The electrode tips were bent as a hook to facilitate a stable insertion in the upper eyelid (Fig. 1H). Moreover, a bare silver wire (0.1 mm in diameter) was connected to 4 stainless steel skull screws as a ground. In addition, for optogenetic inhibition of the bilateral caudal mPFC, 2 fiber-optic cannulae (optical fiber: 200 μm core diameter, 0.39 NA, FT200EMT, Thorlabs) were implanted with an angle of 15°. Tips of optical fibers were 300 μm over the virus injection sites in mPFC for each hemisphere, with the coordinates of AP + 1.92 mm, ML ± 0.98 mm, DV −2.71 mm; (Figs. 1H and 2A). For optogenetic inhibition of the caudal mPFC axon terminals in the right PN, a fiber-optic cannula (optical fiber: 200 μm core diameter, 0.39 NA, FT200EMT, Thorlabs) was lowered to 0.3 mm over the right PN (AP −7.32 mm, ML 0.9 mm, DV −9.7 mm, Figs 3G and 4A). The wires were connected to an 8-pin mini-strip connector. The mini-strip connector and fiber-optic cannula were cemented to the skull with dental cement. After the surgery, the animals were allowed 1 week of recovery.
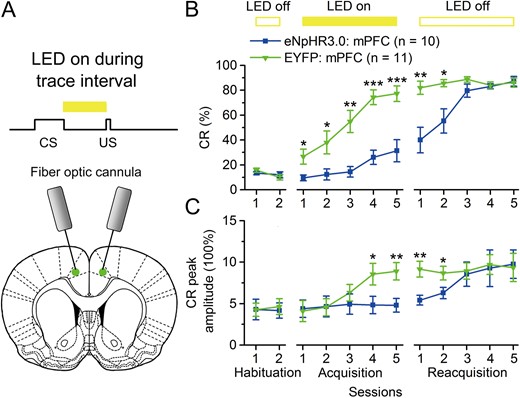
Optogenetic inhibition of the mPFC during trace interval also impairs the TEC acquisition. (E) Scheme for optical fiber implant site and 590-nm LED illumination pattern to bilateral caudal mPFC during trace interval period. (B,C) Effects of optogenetic inhibition of the caudal mPFC during the trace interval period on CR% and CR peak amplitude of TEC acquisition (*P < 0.05, **P < 0.05,***P < 0.001; 2-way ANOVA with repeated measures followed by Tukey post hoc test). Data are represented as mean ± s.e.m.
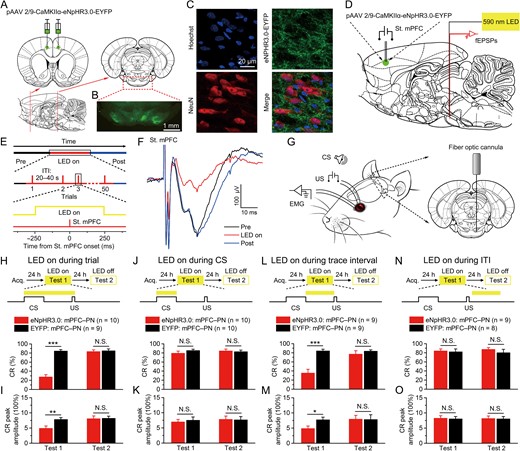
Optogenetic inhibition of the mPFC axon terminals in the right PN during trace interval impairs the TEC retrieval. (A) Rats were bilaterally injected with pAAV 2/9-CaMKIIα-eNpHR3.0-EYFP or pAAV 2/9-CaMKIIα-EYFP into the caudal mPFC. (B) Example of robust eNpHR3.0-EYFP expression in the axon terminals of caudal mPFC in the PN. (C) Representative images showing images of eNpHR3.0-EYFP-positive axons (green) innervating target neurons in the PN (NeuN, red). (D–F) Schematic depicting a concentric stimulating electrode and an optrode implanted in vivo for stimulating neurons in the right caudal mPFC, optogenetic inhibition of caudal mPFC axon terminals in the right PN, and for recording in fEPSPs in the right PN, respectively (D). Time line for examination of the effect of optogenetic inhibition on fEPSPs. Top: The full experiment was divided into 3 epochs, i.e., pre LED on epoch, LED on epoch, and post LED on epoch. Middle: Each epoch consisted of 50 trials, separated by a variable interval of 20–40 s. Bottom: Only during LED on epoch, the continuous 590-nm illumination (25 mW/mm2) was delivered 250 ms before electrical stimulation of the right caudal mPFC and lasted 500 ms (E). The slope of the fEPSPs evoked at the right caudal mPFC was significantly decreased by optogenetic illumination of the caudal mPFC axon terminals in the right PN (F). (G) Behavioral diagram. For optogenetic inhibition of the caudal mPFC axon terminals in the right PN, a fiber-optic cannula was lowered to 0.3 mm over the right PN. (H–O) Top: Training and illumination phase protocol. Bottom: Effects of optogenetic inhibition of caudal mPFC axon terminals in the right PN during the whole trial (H,I), CS (J,K), trace interval (L,M), or ITI (N,O) period on CR% and CR peak amplitude of TEC retrieval (N.S., not significant, *P < 0.05, **P < 0.01, ***P < 0.001; 2-tailed unpaired Student’s t-test). Data are represented as mean ± s.e.m.

Optogenetic inhibition of the mPFC axon terminals in the right PN also impairs the TEC acquisition. (A) Scheme for optical fiber implant site and 590-nm LED illumination pattern to the right PN during trace interval period. (B,C) Effects of optogenetic inhibition of the caudal mPFC axon terminals in the right PN during the trace interval period on CR% and CR peak amplitude of TEC acquisition (*P < 0.05, **P < 0.05,***P < 0.001; 2-way ANOVA with repeated measures followed by Tukey post hoc test). Data are represented as mean ± s.e.m.
Behavioral Procedures
Prior to acquisition training, all rats underwent 2 initial 50 min habituation sessions in a plastic box (35 × 25 × 20 cm), housed within a sound- and light-attenuating chamber. For providing a baseline spontaneous blink rate, the EMG activity of the OO muscle of each rat was recorded for 2 habituation sessions in the same way as the conditioning session, except that no stimuli were presented (see below).
In the TEC paradigm, the CS was a 350-ms, 2-kHz, 85-dB pure tone with either (tested by sound level meter, type 2240, Brüel & Kjær, made in Denmark). The US was a 50-ms periorbital electrical shock (100 Hz, 1 ms pulse duration, square, cathodal pulse), delivered from a stimulus isolator (ISO-Flex, A.M.P.I., Jerusalem, Israel), controlled by a pulse stimulator (Master-9, A.M.P.I.). The intensity of the shock US was carefully calibrated to give the minimal current required to elicit a discrete eyeblink response (2–3 mA). The US intensity was set before the first acquisition session and was not changed during the rest of the experiment. The daily conditioning session (day) consisted of ten 10-trial blocks, each of which comprised 9 CS–US paired trials and 1 CS-alone trial. The trials were separated by a variable intertrial interval of 20–40 s (with a mean of 30 s). During all of the CS–US paired trials, a 500-ms stimulus-free trace interval was interposed between the CS termination and the US onset (Fig. 1I).
LED Illumination Designs in Optogenetic Manipulations During Behavior
For optogenetic manipulations during behavior, an external optical fiber (200 μm core diameter, 0.39 NA, FT200EMT, Thorlabs), connected to a 590-nm LED (M590F1, Thorlabs), was coupled to an implanted optical fiber through a ceramic sleeve. The yellow LED (590 nm) illumination was controlled by a pulse stimulator (Master-9, A.M.P.I.). The power intensity of LED illumination at each fiber tip in brain tissue was measured with a digital optical power and energy meter (PM100D, Thorlabs) and was adjusted to meet experimental requirement. During acquisition and test training with optogenetic manipulations, the starting and ending of LED illumination was different according to their group assignments. The LED illumination delivery during entire CS–US period (900 ms; i.e., LED on during trial; e.g., Fig. 1J) on each trial was started simultaneous with CS onset and ended simultaneous with US offset. The LED illumination delivery during the CS period (350 ms; i.e., LED on during CS; e.g., Fig. 1L) on each trial was started simultaneous with CS onset and ended simultaneous with CS offset. The LED illumination delivery during the trace interval period (500 ms; i.e., LED on during trace interval; e.g., Fig. 1N) on each trial was started simultaneous with CS offset and ended simultaneous with US onset. The LED illumination was delivered randomly for 500 ms during the intertrial interval (ITI) period (i.e., LED on during ITI; e.g., Fig. 1P) on each trial. In addition, for optogenetic inhibition of the bilateral caudal mPFC or of the caudal mPFC axon terminals in the right PN, the rats received continuous 590-nm LED illumination with 15 mW/mm2 or 25 mW/mm2, respectively.
Behavioral Data Analysis
EMG activity of the OO muscle and the LFP signals were bandpass filtered (0.1–3 kHz) using an 16-channel differential amplifier (model 3500, A-M Systems) and acquired with a data acquisition system (Powerlab 16/35, ADInstuments) with a sampling rate of 10 kHz.
EMG data were analyzed off-line for quantification of conditioned responses (CRs) with the help of a home-made program. The collected EMG data were full-wave rectified and integrated with a 1-ms time constant. The integrated EMG activity was calculated to the standard score compared to the mean of the baseline activity for the 0–300 ms before the CS onset in each trial. Thus, the EMG amplitude is given as a percentage of the baseline (100%) averaged EMG amplitude. The 2.5 times greater than the averaged standard EMG activity during the baseline period of each trial was defined as the trial threshold. If the standard EMG amplitude during baseline period exceeded the trial threshold and lasted ≥10 ms, the trial was regarded as a hyperactivity trial and excluded from further analysis. Moreover, a trial was considered to contain the CR if the standard EMG amplitudes exceeded the trial threshold and lasted ≥10 ms during the period between CS offset and US onset (i.e., CR period) (Hasan et al. 2013; Gruart et al. 2015). The percentage of CR (CR%) was defined as the ratio of the number of trials containing the CR to the total number of valid trials. Usually, the percentage of the valid trial is more than 95%. The CR peak amplitude was defined as the maximum amplitude change from the baseline during the CR period. Note that only trials containing CRs were selected for analysis of CR peak amplitude.
Histology
After behavioral experiments, rats were deeply anaesthetized with an overdose of 10% chloral hydrate (1000 mg/kg, i.p., Kelong) and perfused transcardiacally with physiological saline followed by cold 4% PFA (prepared in 0.1 M of phosphate buffer, pH 7.4). The brains were removed from the skull and stored in 4% PFA at 4°C for 24 h, then transferred to a 30% sucrose solution at 4°C for 48 h. 40 μm-thick coronal sections were cut on a freezing microtome (CM3050 S, Leica) and collected in cold phosphate buffer saline (PBS, 0.01 M, pH 7.4). Slices underwent 3 more wash steps of 10 min each in PBS, followed by mounting and coverslipping on microscope slides. The extents of virus expression and placements of fiber-optic cannula were carefully checked, and their images were acquired using an Olympus BX53 F fluorescence microscope (Japan) using a 2 × air objective.
Statistical Analysis
All of the data were expressed as the mean ± standard error of the mean (s.e.m.). The statistical significance was determined by a 2-tailed unpaired Student’s t-test, or by a 2-way ANOVA with repeated measures followed by a separate 1-way ANOVA or by a separate 1-way ANOVA with repeated measures and Tukey post hoc test using the SPSS software for the Windows package (v. 18.0). A value of P < 0.05 was considered to be statistically significant.
Results
Optogenetic Inhibition of the mPFC During Trace Interval Impairs the TEC Retrieval
To test the impact of activity of the caudal mPFC pyramidal neurons during stimulus-free temporal gap on the temporal associative motor learning, we selectively inhibited caudal mPFC pyramidal neurons using optogenetic approaches. Rats were stereotaxically and bilaterally injected with plasmid adeno-associated virus (pAAV) encoding either the third-generation chloride pump halorhodopsin fused in-frame to enhanced yellow fluorescent protein (eNpHR3.0-EYFP) only EYFP under control of the calcium/calmodulin-dependent protein kinase IIα (CaMKIIα) promoter (pAAV-CaMKIIα-eNpHR3.0-EYFP or pAAV-CaMKIIα-EYFP) into the caudal mPFC (Fig. 1A,B). We then validated the specificity and efficacy of this targeting strategy in vitro. 95.8 ± 0.9% of CaMKIIα-immunopositive cells expressed eNpHR3.0-EYFP and the promoter also provided high specificity near virus injection sites, because 98.4 ± 0.3% of eNpHR3.0-EYFP-expressing cells were CaMKIIα-immunopositive cells (Fig. 1C,D). To assess the physiological effects of eNpHR3.0 on mPFC neuronal activity, we performed optrode recordings in anesthetized rats (Fig. 1E) and confirmed that continuous illumination of excitatory mPFC neurons with 590-nm LED light inhibited neuronal firing in a temporally precise, stable, and reversible manner (Fig. 1F,G).
First, we investigated the effects of real-time optogenetic inhibition of the caudal mPFC pyramidal neurons during the entire CS–US period (whole trial) on the TEC retrieval. A dual fiber-optic cannula was implanted over the bilateral caudal mPFC 4 weeks after virus injection (Fig. 1H and Supplementary Fig. 1C). One week after surgery, the rats received the acquisition training of TEC for 5 consecutive days and then tested 24 h later. For optogenetic inhibition of the caudal mPFC during whole trial, the LED illumination was applied during the whole trial on each trial throughout the test 1 (Fig. 1J). As expected, we found that optogenetic inhibition of the mPFC during whole trial caused significant deficits in TEC retrieval (Fig. 1J,K and Supplementary Fig. 1A; test 1). This result was confirmed by performing a 2-tailed unpaired Student’s t-test of the CR% (t(18) = 6.058, P < 0.001) and CR peak amplitude (t(18) = 2.446, P = 0.025) during test 1. However, there were no significant differences in the CR% or CR peak amplitude between eNpHR3.0-EYFP: mPFC group and EYFP: mPFC group on the next day in the absence of the optogenetic inhibition (Fig. 1J,K and Supplementary Fig. 1B; test 2; 2-tailed unpaired Student’s t-test; t(18) = 0.036, P = 0.972 and t(18) = 0.120, P = 0.906, respectively).
Next, to test the effect of real-time optogenetic inhibition of the caudal mPFC pyramidal neurons during the CS period on the TEC retrieval, another 2 groups of rats underwent the same scheme as abovementioned eNpHR3.0-EYFP: mPFC group and EYFP: mPFC group and were then tested retrieval 24 h later. We found that optogenetic inhibition of the PFC pyramidal neurons during the CS period had no significant effects on the CR% or CR peak amplitude (Fig. 1L,M and Supplementary Fig. 2A; test 1; 2-tailed unpaired Student’s t-test; t(16) = 0.960, P = 0.351 and t(16) = 0.077, P = 0.939, respectively). Similarly, there were no significant differences in the CR% or CR peak amplitude between the 2 groups on the next day without the optogenetic inhibition (Fig. 1L,M and Supplementary Fig. 2B; test 2; 2-tailed unpaired Student’s t-test; t(18) = 0.412, P = 0.686 and t(18) = 0.550, P = 0.590, respectively).
We next tested whether real-time optogenetic inhibition of the caudal mPFC pyramidal neurons during the trace interval could affect the TEC retrieval. Another 2 additional groups of rats underwent the same scheme as abovementioned eNpHR3.0-EYFP: mPFC group and EYFP: mPFC group and were then tested retrieval 24 h later. Importantly, optogenetic inhibition of the caudal mPFC pyramidal neurons during the trace interval produced significant deficits in the CR% and CR peak amplitude (Fig. 1N,O and Supplementary Fig. 3A; test 1; 2-tailed unpaired Student’s t-test; t(18) = 4.833, P < 0.001 and t(18) = 2.179, P = 0.043, respectively). In contrast, the deficits in the CR% and CR peak amplitude were not observed between the 2 groups on the next day in the absence of the optogenetic inhibition (Fig. 1N,O and Supplementary Fig. 3B; test 2; 2-tailed unpaired Student’s t-test; t(18) = 0.681, P = 0.504 and t(18) = 0.913, P = 0.893, respectively).
Finally, we also tested the effect of optogenetic inhibition of the caudal mPFC pyramidal neurons during the intertrial interval (ITI) period on the TEC retrieval. Another 2 additional groups of rats underwent the same scheme as abovementioned eNpHR3.0-EYFP: mPFC group and EYFP: mPFC group and were then tested retrieval 24 h later. As expected, optogenetic inhibition of the mPFC during the ITI did not significantly impair the CR% and CR peak amplitude (Fig. 1P,Q and Supplementary Fig. 4A; test 1; 2-tailed unpaired Student’s t-test; t(20) = 1.426, P = 0.169 and t(20) = 0.187, P = 0.853, respectively). Moreover, there were no significant differences in the CR% or CR peak amplitude between the 2 groups on the next day without the optogenetic inhibition (Fig. 1P,Q and Supplementary Fig. 4B; test 2; 2-tailed unpaired Student’s t-test; t(20) = 0.192, P = 0.850 and t(20) = 0.196, P = 0.846, respectively). Taken together, these results suggest that activity of pyramidal neurons in the caudal mPFC during trace interval is critical for the TEC retrieval.
Optogenetic Inhibition of the mPFC During Trace Interval also Impairs the TEC Acquisition
Next, to assess whether the real-time optogenetic inhibition of the caudal mPFC during the trace interval could also impair the TEC acquisition, another 2 groups of rats underwent the same scheme as abovementioned eNpHR3.0-EYFP: mPFC group and EYFP: mPFC group, except that the LED illumination was delivered during the trace interval on each trial across acquisition sessions 1–5 (Fig. 2A,B). As expect, optogenetic inhibition of the mPFC pyramidal neurons during the trace interval significantly impaired (not prevented) the acquisition of the TEC (Fig. 2B,C and Supplementary Fig. 5A,B). However, it should be noted here that there was a small increase in the CR% across acquisition sessions, which is not accompanied with a similar increase in the CR peak amplitude (Fig. 2B,C and Supplementary Fig. 5A,B). This result was confirmed by performing a 2-way repeated measure ANOVA on the CR% and CR peak amplitude. There was a significant group × session interaction (F(4,76) = 4.131, P = 0.004 and F(4,76) = 5.064, P = 0.001, respectively), and significant effects of the group (F(1,19) = 23.650, P < 0.001 and F(1,19) = 6.689, P = 0.009, respectively) and the session (F(4,76) = 22.014, P < 0.001 and F(4,76) = 6.624, P < 0.001, respectively). Furthermore, a separate 1-way ANOVA revealed that the CRs% of the eNpHR3.0: mPFC group were significantly lower than those of the EYFP: mPFC group on acquisition sessions 1–5 (F(1,19) = 6.362, P = 0.021; F(1,19) = 5.886, P = 0.025; F(1,19) = 15.725, P = 0.001; F(1,19) = 33.861, P < 0.001 and F(1,19) = 18.714, P < 0.001, respectively), and that the CR peak amplitudes of the eNpHR3.0: mPFC group were significantly lower than that of the EYFP: mPFC group on acquisition sessions 4 and 5 (F(1,19) = 4.771, P = 0.042 and F(1,19) = 9.223, P = 0.007, respectively). However, the effects of optogenetic inhibition were fully reversible, since the rats of eNpHR3.0: mPFC group increased their CRs% and CR peak amplitudes which reached an asymptotic level in a manner comparable to the EYFP: mPFC group on reacquisition sessions 1–5 (Fig. 2B,C and Supplementary Fig. 5A,B; 2-way repeated measure ANOVA; group × session interaction: F(4,76) = 9.947, P < 0.001 and F(4,76) = 1.238, P = 0.302; group effect: F(1,19) = 9.116, P = 0.007 and F(1,19) = 7.078, P = 0.012; session effect: F(4,76) = 13.382, P < 0.001 and F(4,76) = 7.535, P = 0.013, respectively). Further, a separate 1-way ANOVA revealed that the CRs% and CR peak amplitudes of the eNpHR3.0: mPFC group were significantly lower than those of the EYFP: mPFC group on reacquisition sessions 1 and 2 (F(1,19) = 13.900, P = 0.001 and F(1,19) = 9.804, P = 0.005 for CR%; F(1,19) = 10.710, P = 0.004 and F(1,19) = 4.852, P = 0.040 for CR peak amplitude). These data indicate that activity of pyramidal neurons in the caudal mPFC during trace interval is important for the TEC acquisition.
Optogenetic Inhibition of the mPFC Axon Terminals in the Right PN During Trace Interval Impairs the TEC Retrieval
Although the above data show that activity of pyramidal neurons in the caudal mPFC during trace interval plays a pivotal role in the acquisition and retrieval of TEC, it is unclear which neural pathways is involved in real-time modulation. The mPFC is known to project to several downstream brain regions, including the PN, the brainstem region crucial for eyeblink conditioning that projects to the cerebellum (Siegel et al. 2012; Moya et al. 2014; Farley et al. 2016). Moreover, the regions in the PN receiving mPFC projection demonstrated persistent neural activity during trace interval in TEC (Siegel et al. 2012), but the mPFC–PN projections has not been directly shown to have the causal effect on the TEC. To specifically label the mPFC–PN projection, we stereotaxically injected rats with pAAV-CaMKIIα-eNpHR3.0-EYFP or pAAV-CaMKIIα-EYFP into the mPFC (Fig. 3A), which led to robust NpHR3.0-EYFP or EYFP expression of caudal mPFC pyramidal neuron axon terminals in the PN (Fig. 3B,C). Then, we restrictedly inhibited the activities of mPFC axon terminals at the PN by selectively illuminating this region through a fiber-optic cannula implanted over the right PN (Fig. 3G). In anesthetized rats, in vivo recordings demonstrated that optogenetic inhibition of the caudal mPFC axon terminals in the PN significantly decreased the slope of field fEPSPs evoked by the electrical stimulation of the right caudal mPFC (Fig. 3D–F), which indicate the physiological effectiveness of the optogenetic inhibition of the caudal mPFC axon terminals in the PN.
First, we explored the effects of real-time optogenetic inhibition of the caudal mPFC pyramidal neuron axon terminals in the right PN during the whole trial on the TEC retrieval. A fiber-optic cannula was implanted over the right PN 4 weeks after virus injection (Fig. 3G and Supplementary Fig. 6C). One week after surgery, the rats received the acquisition training of TEC for 5 consecutive days and then tested 24 h later. For optogenetic inhibition of the mPFC axon terminals in right PN during whole trial, the LED illumination was delivered during the whole trial on each trial throughout the test 1 (Fig. 3H). As expected, we found that optogenetic inhibition of the caudal mPFC axon terminals in right PN during whole trial caused significant deficits in CR% and CR peak amplitude (2-tailed unpaired Student’s t-test; t(17) = 9.651, P < 0.001 and t(17) = 2.947, P = 0.009, respectively) during test 1 (Fig. 3H,I and Supplementary Fig. 6A). However, Statistical analysis using a 2-tailed unpaired Student’s t-test showed that there were no significant differences in the CR% or CR peak amplitude between eNpHR3.0-EYFP: mPFC–PN group and EYFP: mPFC–PN group on the next day in the absence of the optogenetic inhibition (Fig. 3H,I and Supplementary Fig. 6B; test 2; t(17) = 0.411, P = 0.686 and t(17) = 0.128, P = 0.900, respectively).
Next, to examine the effects of real-time optogenetic inhibition of the caudal mPFC pyramidal neuron axon terminals in the right PN during the CS period on the TEC retrieval, another 2 groups of rats underwent the same scheme as abovementioned eNpHR3.0-EYFP: mPFC–PN group and EYFP: mPFC–PN group and were then tested retrieval 24 h later. We found that optogenetic inhibition of the caudal mPFC axon terminals in the right PN during the CS period had no significant effects on the CR% or CR peak amplitude (Fig. 3J,K and Supplementary Fig. 7A; test 1; 2-tailed unpaired Student’s t-test; t(18) = 0.181, P = 0.858 and t(18) = 0.091, P = 0.929, respectively). Similarly, there were no significant differences in the CR% or CR peak amplitude between the 2 groups on the next day without the optogenetic inhibition (Fig. 3J,K and Supplementary Fig. 7B; test 2; 2-tailed unpaired Student’s t-test; t(18) = 0.354, P = 0.727 and t(18) = 0.128, P = 0.900, respectively).
We next investigated whether real-time optogenetic inhibition of the caudal mPFC pyramidal neuron axon terminals in the right PN during the trace interval could affect the TEC retrieval. Another 2 additional groups of rats underwent the same scheme as abovementioned eNpHR3.0-EYFP: mPFC–PN group and EYFP: mPFC–PN group and were then tested retrieval 24 h later. Importantly, optogenetic inhibition of the caudal mPFC axon terminals in the right PN during the trace interval produced significantly deficits in the CR% and CR peak amplitude (Fig. 3L,M and Supplementary Fig. 8A; test 1; 2-tailed unpaired Student’s t-test; t(16) = 5.410, P < 0.001 and t(16) = 2.509, P = 0.023, respectively). In contrast, the deficits in the CR% and CR peak amplitude were not observed between the 2 groups on the next day in the absence of the optogenetic inhibition (Fig. 3L,M and Supplementary Fig. 8B; test 2; 2-tailed unpaired Student’s t-test; t(16) = 0.823, P = 0.423 and t(16) = 0.183, P = 0.857, respectively).
Finally, we also test the effect of optogenetic inhibition of the caudal mPFC pyramidal neuron axon terminals in the right PN during the ITI period on the TEC retrieval. Another 2 additional groups of rats underwent the same scheme as abovementioned eNpHR3.0-EYFP: mPFC–PN group and EYFP: mPFC–PN group and were then tested retrieval 24 h later. As expected, optogenetic inhibition of the caudal mPFC axon terminals in the right PN during the ITI did not significantly impair the CR% and CR peak amplitude (Fig. 3N,O and Supplementary Fig. 9A; test 1; 2-tailed unpaired Student’s t-test; t(15) = 0.720, P = 0.783 and t(15) = 0.237, P = 0.816, respectively). Moreover, there were no significant differences in the CR% or CR peak amplitude between the 2 groups on the next day without the optogenetic inhibition (Fig. 3N,O and Supplementary Fig. 9B; test 2; 2-tailed unpaired Student’s t-test; t(15) = 0.927, P = 0.369 and t(15) = 0.023, P = 0.982, respectively). Taken together, these results suggest that persistent activity of mPFC axon terminals in the right PN during trace interval is crucial for the TEC retrieval.
Optogenetic Inhibition of the mPFC Axon Terminals in the Right PN During Trace Interval also Impairs the TEC Acquisition
Next, to assess whether the real-time optogenetic inhibition of the caudal mPFC pyramidal neuron axon terminals in the right PN during the trace interval could also abolish the TEC acquisition, another 2 groups of rats underwent the same scheme as abovementioned eNpHR3.0-EYFP: mPFC–PN group and EYFP: mPFC–PN group, except that the LED illumination was delivered during the trace interval on each trial across acquisition sessions 1–5 (Fig. 4A,B). As expect, optogenetic inhibition of the caudal mPFC axon terminals in the right PN during the trace interval significantly impaired (not prevented) the acquisition of the TEC (Fig. 4B,C and Supplementary Fig. 10A,B). However, it should be noted here that there was a small increase in the CR% across acquisition sessions, which is not accompanied with a similar increase in the CR peak amplitude (Fig. 4B,C and Supplementary Fig. 10A,B). This result was confirmed by performing a 2-way repeated measure ANOVA on the CR% and CR peak amplitude. There was a significant group × session interaction (F(4,68) = 7.756, P < 0.001 and F(4,68) = 4.196, P = 0.004, respectively), and significant effects of the group (F(1,17) = 25.539, P < 0.001 and F(1,17) = 7.828, P = 0.012, respectively) and the session (F(4,68) = 23.029, P < 0.001 and F(4,68) = 7.286, P < 0.001, respectively). Furthermore, a separate 1-way ANOVA revealed that the CRs% of the eNpHR3.0: mPFC–PN group were significantly lower than that of the EYFP: mPFC–PN group on acquisition sessions 2–5 (F(1,17) = 4.137, P = 0.013; F(1,17) = 17.963, P = 0.001; F(1,17) = 36.882, P < 0.001 and F(1,17) = 28.588, P < 0.001, respectively), and that the CR peak amplitudes of the eNpHR3.0: mPFC–PN group were significantly lower than those of the EYFP: mPFC–PN group on acquisition sessions 3–5 (F(1,17) = 6.159, P = 0.024; F(1,17) = 7.858, P = 0.012 and F(1,17) = 12.493, P = 0.003, respectively). In contrast, the effects of optogenetic inhibition were fully reversible, since the rats of eNpHR3.0: mPFC–PN group increased their CRs% and CR peak amplitudes which reached an asymptotic level in a manner comparable to the EYFP: mPFC–PN group on reacquisition sessions 1–5 (Fig. 4B,C and Supplementary Fig. 10A,B; 2-way repeated measure ANOVA; group × session interaction: F(4,68) = 15.447, P < 0.001 and F(4,68) = 1.860, P = 0.128; group effect: F(1,17) = 10.413, P = 0.005 and F(1,17) = 6.954, P = 0.018; session effect: F(4,68) = 15.089, P < 0.001 and F(4,68) = 3.821, P = 0.007, respectively). Further, a separate 1-way ANOVA revealed that the CRs% the eNpHR3.0: mPFC–PN group were significantly lower than those of the EYFP: mPFC–PN group on reacquisition sessions 1–3 (F(1,17) = 25.432, P < 0.001; F(1,17) = 10.501, P = 0.005 and F(1,17) = 5.060, P = 0.038, respectively), and that CR peak amplitudes of the eNpHR3.0: mPFC–PN group were significantly lower than those of the EYFP: mPFC–PN group on reacquisition sessions 1 and 2 (F(1,17) = 5.294, P = 0.034 and F(1,17) = 8.267, P = 0.0140, respectively). Together, these data indicate that the activity of subpopulation of excitatory neurons in the caudal mPFC that project to the PN during stimulus-free trace interval is crucial for the acquisition and retrieval of TEC.
Discussion
Using optogenetic approaches in freely moving rats, we probed the mechanism and the relevant neural pathways underlying the involvement of the mPFC in modulating TEC, a quintessential example of temporal associative motor learning. Our data show that optogenetic inhibition of the caudal mPFC or its axon terminals at the PN during the whole trial or trace interval significantly impaired the retrieval of TEC. Likewise, inhibition during the trace interval also significantly disrupted the acquisition of TEC. In contrast, optogenetic inhibition of the caudal mPFC or its axon terminals at the PN during the CS or ITI period had no significant effects on the retrieval of TEC. It is worth noting that animals with optogenetic inhibition of the mPFC or its axon terminals still exhibited some residual ability to learn. This result could be interpreted as follows: 1) optogenetic inhibition do not completely inhibit the whole effective regions of the mPFC or its axon terminals at the PN, thus limited learning was possible when a part of mPFC or its terminals was valid; 2) the role of totally or partially inhibited mPFC might be partially substituted for by other brain areas. Together, these results suggest that persistent activity during stimulus-free temporal gaps of a subpopulation of excitatory neurons in the caudal mPFC that project to the PN is crucial for temporal associative motor learning.
It is well established that the brainstem-cerebellar circuit is essential and sufficient for DEC under optimal learning conditions (Kim et al. 1998; Christian and Thompson 2003; Thompson 2005; Green and Arenos 2007; Weeks et al. 2007; Kalmbach et al. 2009; Plakke et al. 2009; ten Brinke et al. 2015; Sergaki et al. 2017). Several forebrain structures, such as the mPFC and hippcampus are required for TEC (Kronforst-Collins and Disterhoft 1998; Weible et al. 2000, 2003; McLaughlin et al. 2002; Powell et al. 2005; Simon et al. 2005; Takehara-Nishiuchi et al. 2005; Oswald et al. 2008, 2010; Gruart et al. 2015), but not for DEC under optimal learning conditions (Wu et al. 2012, 2013, 2017). For example, Weible and collaborators reported that lesions of the caudal mPFC impaired acquisition of TEC but not DEC in rabbits (Weible et al. 2000), which is in agreement with findings from an earlier study by Kronforst-Collins and Disterhoft (Kronforst-Collins and Disterhoft 1998) who demonstrated that lesions of the caudal mPFC caused significant deficits in the acquisition of TEC. McLaughlin et al. (McLaughlin et al. 2002) have reported that electrolytic lesions of the rostral mPFC substantially impaired TEC acquisition. Muscimol inactivation of the rostral mPFC also significantly retarded the acquisition and expression of TEC in rats (Takehara-Nishiuchi et al. 2005). Together, these studies suggest an effective modulation role of the mPFC in TEC. However, the nature of the mPFC modulation of TEC remained incompletely understood from these classical studies.
Pavlov (Pavlov 1927) initially suggested that formation of an association between the CS and US during trace conditioning depends upon a persistent neural representation of the CS across the trace interval. In support of this idea, recent studies have demonstrated that TEC requires an extra-cerebellar input to the cerebellum that persists beyond CS offset to occur in close temporal proximity with the US (Kalmbach et al. 2009, 2010). The CS-elicited sustained firing in the mPFC during the trace interval has been observed in rabbit and rodent and could provide the CS representation to support trace conditioning (Takehara-Nishiuchi and McNaughton 2008; Siegel et al. 2012; Siegel and Mauk 2013). Given that mPFC is implicated in working memory by its sustained neuronal activity (Wang 2001; Chang et al. 2002) and that cerebellar learning requires CS- and US-driven inputs to overlap in time (or nearly so), the mPFC could support TEC by maintaining a representation of the CS across the trace interval to converge with US-related neuronal activity. Our results directly support this possibility by demonstrating that optogenetic inhibition of the mPFC during the trace interval, but not during the CS or ITI period, significantly impairs the TEC. Interestingly, a recent study also directly showed that optogenetic inhibition of the prelimbic region of mPFC during the trace interval impaired the trace fear conditioning, an amygdala-mediated emotional learning (Gilmartin et al. 2013). Although different forms of associative learning rely on distinct neural substrates and circuits (Fanselow and Poulos 2005; Rudy 2009; Farley et al. 2016), these combined results indicate that the persistent activity of neurons in mPFC during stimulus-free temporal gap has a similar role in temporal associative learning. In addition, we have shown that mPFC is essential for the DEC with a weak CS but not for the DEC with a strong CS (Wu et al. 2012, 2017). However, the nature of the roles of mPFC in TEC and DEC may be different. The mPFC may provide an additional input into the cerebellum to bridge the trace interval in TEC, whereas the mPFC may act to amplify the CS input from the PN to cerebellum during DEC with a weak CS. Moreover, Caro-Martin et al. found that the mPFC seems to participate in the measurement of CS–US time intervals during eyeblink conditioning (Caro-Martin et al. 2015), which may be an additional way for mPFC modulation of the eyeblink conditioning.
Weiss and Disterhoft (Weiss and Disterhoft 1996) first proposed that forebrain structures, including the mPFC, are required to facilitate pontine inputs to the cerebellum to mediate TEC. More specifically, Clark et al. (Clark et al. 2002) suggested that forebrain structures extend mossy fiber activity into the trace interval. In support, anatomical work in rodents and rabbits demonstrates that the mPFC sends substantial synaptic projections to the PN, a brainstem region crucial for eyeblink conditioning by relaying CS signals to the cerebellum (Halverson and Freeman 2010; Moya et al. 2014). Moreover, a recent study has shown that a PN sub-region receiving mPFC projections also displays persistent activity similar to that observed in mPFC during the trace interval (Siegel et al. 2012), suggesting that mPFC activity may directly influence PN neurons activity via mPFC–PN projections. Our results also directly support this possibility by demonstrating that optogenetic inhibition of the caudal mPFC axon terminates at the PN during the trace interval, but not during the CS or ITI period, significantly disrupt the TEC.
It should be noted that the mPFC also sends direct projections to the motor cortex (Gabbott et al. 2005; Narayanan and Laubach 2006; Bedwell et al. 2014), which then sends direct projections to the facial nucleus and to the red nucleus (Grinevich et al. 2005; Ammann et al. 2016). Although previous studies reported that even large motor cortex lesions did not affect the acquisition or performance of either DEC or TEC in rabbits (Ivkovich and Thompson 1997), several recent studies indicated that the functional loss of NMDA receptor function in the motor cortex significantly impaired acquisition of CRs during the TEC in mice (Hasan et al. 2013), and that lidocaine inactivation of the motor cortex evoked a significant decrease in learning curves and in the amplitude of CRs during the DEC in rabbits (Ammann et al. 2016). Ammann et al. found that motor cortex neurons fired well in advance of the initiation of DEC (Ammann et al. 2016).
Thus, the motor cortex may also play a significant role in the acquisition and expression of the eyeblink conditioning. Therefore besides the mPFC–PN projections demonstrated in this study, mPFC–motor cortox projections may be a plausible pathway underlying the mPFC modulation of eyeblink conditioning and requires further examination in future studies
To our knowledge, this is the first study to demonstrate that optogenetic inhibition of mPFC or its axon terminals at the PN during the trace interval significantly impairs the acquisition and retrieval of TEC. Together with results from other previous studies, our findings clearly indicate that persistent activities from the mPFC–PN pathways during the trace interval is essential for temporal associative motor learning. The present results advance our understanding of the mechanisms and the relevant neural pathways underlying temporal associative motor learning.
Funding
This work was supported by grants from the National Natural Science Foundation of China (No. 81571161), Class General Financial Grant from the China Postdoctoral Science Foundation (No. 2014M562592), Special Financial Grant from the China Postdoctoral Science Foundation (No. 2014T81091), and Special Financial Grant from the Chongqing Postdoctoral Science Foundation (No. Xm2015030).
Notes
We would like to thank Professor Qian-Quan Sun from the Department of Zoology and Physiology, University of Wyoming, for the assistance with editing the manuscript. Conflict of Interest: None declared.
References
Author notes
Guang-yan Wu and Shu-lei Liu are contributed equally to this work