


Abstract
Although the cannabinoid CB1 receptor has been implicated in atherosclerosis, its cell-specific effects in this disease are not well understood. To address this, we generated a transgenic mouse model to study the role of myeloid CB1 signalling in atherosclerosis.
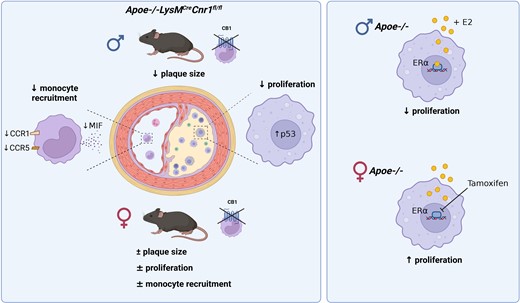
Here, we report that male mice with myeloid-specific Cnr1 deficiency on atherogenic background developed smaller lesions and necrotic cores than controls, while only minor genotype differences were observed in females. Male Cnr1-deficient mice showed reduced arterial monocyte recruitment and macrophage proliferation with less inflammatory phenotype. The sex-specific differences in proliferation were dependent on oestrogen receptor (ER)α-oestradiol signalling. Kinase activity profiling identified a CB1-dependent regulation of p53 and cyclin-dependent kinases. Transcriptomic profiling further revealed chromatin modifications, mRNA processing, and mitochondrial respiration among the key processes affected by CB1 signalling, which was supported by metabolic flux assays. Chronic administration of the peripherally restricted CB1 antagonist JD5037 inhibited plaque progression and macrophage proliferation, but only in male mice. Finally, CNR1 expression was detectable in human carotid endarterectomy plaques and inversely correlated with proliferation, oxidative metabolism, and inflammatory markers, suggesting a possible implication of CB1-dependent regulation in human pathophysiology.
Impaired macrophage CB1 signalling is atheroprotective by limiting their arterial recruitment, proliferation, and inflammatory reprogramming in male mice. The importance of macrophage CB1 signalling appears to be sex-dependent.
Time of primary review: 47 days
1. Introduction
Cardiovascular disease (CVD) is the leading cause of death worldwide. Although there have been significant advances in lipid-lowering therapies and positive results from initial clinical trials targeting inflammation in CVD patients, atherosclerosis remains a significant health burden. This is due to an increasing life expectancy and an aging population in our society, as well as an increased prevalence of lifestyle-related cardiometabolic risk factors. Improving CVD prevention and treatment of CVD remains a central concern in biomedical research, with the goal of more efficient and reliable identification of new targets for translation into drug development. In particular, the development of novel therapeutics that block atherosclerosis-specific inflammatory pathways without immunosuppressive side effects remains an unmet need to optimize immunotherapy for CVD.1
Endocannabinoids are a group of arachidonic acid-derived lipid mediators with pleiotropic cardiometabolic and immunomodulatory properties. Circulating endocannabinoid levels are elevated in patients with coronary artery disease,2 myocardial infarction,3 chronic heart failure,4 and obese patients with coronary endothelial dysfunction.5 In a mouse model of atherosclerosis, cannabinoid CB1 receptor antagonism with rimonabant inhibited plaque formation.6 Other investigators did not observe effects of rimonabant on plaque size, but found improved aortic endothelium-dependent vasodilation and decreased aortic reactive oxygen species (ROS) production and NADPH oxidase activity.7 More recently, the soybean isoflavone genistein was identified as a CB1 antagonist by in silico screening and was reported to inhibit plant-derived cannabinoid-mediated inflammation and oxidative stress in endothelial cells and plaque progression in a mouse model.8
Peripherally restricted CB1 antagonists, which are devoid of undesired neuronal effects in the brain, improved metabolic dysfunction in experimental mouse models.9–11 Liver-specific CB1 deficiency blunted glucocorticoid-induced dyslipidaemia, but not the obesity phenotype.9 Inducible adipocyte-specific Cnr1 deficiency was sufficient to protect adult mice from diet-induced obesity and associated metabolic changes and reversed the phenotype in obese mice.12 In pancreas-infiltrating macrophages, CB1 signalling exhibited pro-inflammatory effects through activation of the NLRP3 inflammasome complex, thereby contributing to beta-cell loss in experimental type 2 diabetes.13 The experimental in vivo evidence in this study was based on combined treatment with peripherally active CB1 antagonists and clodrononate liposomes for macrophage depletion or siRNA-mediated CB1 knockdown, but not cell-specific genetic Cnr1 depletion. In particular, CB1 siRNA treatment prevented hyperglycaemia, macrophage infiltration, and Nlrp3 expression, similar to the effects observed with JD5037 or clodronate treatment.
In atherosclerosis, monocyte-derived macrophages are the major leucocyte subset recruited to the activated endothelium and accumulate within plaques. In vitro data suggest a possible regulation of macrophage cholesterol metabolism by cannabinoids,14 although the in vivo relevance of this mechanism in plaque macrophages remains unexplored. The proposed role of CB1 in macrophage cholesterol metabolism and inflammatory signalling, as reported in experimental diabetes, suggests a critical role for CB1 in regulating the macrophage phenotype in the atherosclerotic plaque. However, studies based on cell-targeted genetic disruption of CB1 in macrophages in experimental atherosclerosis are still lacking.
To address this issue, we generated a myeloid cell-specific Cnr1-deficient mouse model to study the effects of myeloid CB1 signalling in early and advanced stages of atherosclerosis. In addition, we investigated the therapeutic benefit of peripheral CB1 antagonism in inhibiting plaque progression.
2. Methods
2.1 Animal model of atherosclerosis
Mice harbouring loxP-flanked Cnr1 alleles (Cnr1flox/flox)15 were crossed with apolipoprotein E-deficient mice (Apoe−/− mice, strain #002052, The Jackson Laboratory) expressing Cre recombinase under the control of the myeloid cell-specific lysozyme M promoter (LysMCre) to obtain mice with a myeloid cell-specific deletion of Cnr1. Male and female Apoe−/−LysMCre(+/−), Apoe−/−Cnr1flox/flox, and Apoe−/−LysMCre(+/−)Cnr1flox/flox mice aged 8 weeks were fed with Western diet (WD; 0.2% cholesterol, Ssniff, TD88137) for either 4 or 16 weeks. In some experiments, Apoe−/−LysMCre(+/−) and Apoe−/−LysMCre(+/−)Cnr1flox/flox female mice were fed with WD for 4 weeks and subjected to daily ip injections of 1 mg tamoxifen or vehicle for the last 3 days. In other experiments, Ldlr−/− mice were fed with WD for 4 weeks and subsequently randomly assigned into two groups receiving daily intraperitoneal injections of either JD5037 (3 mg/kg) or vehicle (10% DMSO, 40% PEG3000, 5% Tween-80, and 45% saline) for another 4 weeks with continued WD feeding. Organs for baseline phenotyping were collected from 8 weeks old mice kept on normal chow diet. Animals were housed in individual ventilated cages in groups of four to six mice in 12-h light–dark cycle, air-conditioned (23°C and 60% relative humidity) with free ad libitum access to food pellets and tap water. Mice were euthanized under deep anaesthesia with ketamine/xylazine, in order to collect blood via cardiac puncture and perfusion of organs before harvesting the heart, aorta, spleen, femurs, and livers. All animal experiments were approved by the local ethics committee (District Government of Upper Bavaria; license number: 55.2-1-54-2532-111-13 and 55.2-2532.Vet_02-18-114) and conducted in accordance with the guidelines from Directive 2010/63/EU of the European Parliament on the protection of animals used for scientific purposes.
2.2 Plasma cholesterol and triglyceride measurement
Total murine plasma cholesterol and triglyceride concentrations were measured with colorimetric assays (CHOD-PAP and CPO-PAP, Roche) using a microplate reader (Infinite F200 PRO, Tecan).
2.3 Plaque analysis in descending aorta
Oil-Red-O (ORO) stainings of the aorta including abdominal and thoracic aorta were performed after en face preparation and fixation in 4% PFA. The tissue was stained for 30 min in ORO solution (0.5% in isopropanol, Sigma Aldrich/Merck) at RT. Next, aortas were washed in 60% isopropanol until unspecific ORO-derived staining was removed from the endothelium. The aortas were rinsed briefly with running tap water before mounting in Kaiser’s glycerine gelatine mounting media. Tilescan images were acquired with a DM6000B fluorescence microscope. The lesions were quantified via Leica Application Suite LAS V4.3 software and calculated as percentage of total aortic surface.
2.4 Plaque histology and immunofluorescence
Hearts were embedded in Tissue-Tek O.C.T. compound (Sakura) for cutting 5 µm cross-sections at the level of the aortic roots. Aortic arches were fixed in 4% PFA and embedded in paraffin for longitudinal sectioning (5 µm). Aortic root sections were stained with ORO for lesion size quantification. Per mouse, eight sections with a distance of 50 µm from each other were analysed. Aortic arch slides were stained with haematoxylin and eosin and lesions were quantified on four sections per arch at 50 µm distance from each other. Digital images were acquired with a brightfield microscope (DM6000B, Leica). Immunostainings with antibodies listed in Supplementary material online, Tables S1–S3 were performed on 5 µm cryosections of the aortic root as detailed in Supplementary material online, Methods.
2.5 In situ hybridization
To determine the presence of CB1 in aortic root plaque macrophages, fluorescent in situ hybridization was performed by using a murine Cnr1 probe (VB6-17606, Affymetrix) and the ViewRNA™ Cell Plus Assay-Kit (Invitrogen) as detailed in Supplementary material online, Methods.
2.6 Laser capture microdissection
Aortic root sections (8–10 sections per mouse, 10 µm thick) from Apoe−/−LysMCre and Apoe−/−LysMCreCnr1flox/flox male mice collected after 4 weeks WD were mounted on RNase-free membrane metal frame slides (POL FrameSlide, Leica Microsystems). Following deparaffinization under RNase-free conditions, sections were dried. Lesions were cut using a laser microdissection system (CTR6000, Leica Microsystems) attached to a microscope (LMD7000, Leica Microsystems) and collected in lysis buffer of the RNA isolation kit (PAXgene Tissue miRNA kit, PreAnalytix).
2.7 Monocyte adoptive transfer
Monocytes were isolated from the bone marrow of Apoe−/−LysMCre and Apoe−/−LysMCreCnr1flox/flox mice by magnetic separation monocyte Isolation Kit (130-100-629, Miltenyi Biotec). The purified monocytes were labelled with carboxyfluorescein diacetate succinimidyl ester (CFSE, 10 μM, V12883, ThermoFisher) and 2.5 × 10⁶ cells injected intravenously via the tail vein. Both donor mice and Apoe−/− recipient mice were subjected to 4 weeks WD before adoptive cell transfer. After 48 h, the aorta and hearts were collected after organ perfusion to detect recruited CFSE+ monocytes within aortic root cryosections by fluorescence microscopy (DM6000B) and digested aortas using flow cytometry.
2.8 Flow cytometry
Femurs were centrifuged at 10 000 × g for 1 min after exposure of the distal metaphysis to collect the bone marrow cells. Bone marrow and blood erythrocytes were lysed with ammonium-chloride-potassium [ACK, NH4Cl (8024 mg/L), KHCO3 (1001 mg/L) EDTA.Na2·2H2O (3.722 mg/L)] buffer for 10 min at RT. The cell suspensions were subsequently blocked for 5 min with Fc-CD16/CD32 antibody and then stained for 30 min in the dark at 4° C with antibodies (see Supplementary material online, Table S4) to identify myeloid and lymphoid cell subsets. After gating for singlets and CD45+, the CD11b+ myeloid subsets were further gated as following: CD115+Ly6G− (monocytes), CD115−Ly6G+ (neutrophils). Surface expression levels of chemokine receptors CCR1, CCR5, and CXR2 were expressed as geometric mean fluorescence intensity. For measuring proliferation, cells were permeabilized (eBioscience, 00-8333-56) prior to staining with anti-Ki67. Flow cytometry data were acquired on a BD FACSCantoII flow cytometer (BD Biosciences) and analysed with FlowJo v10.2 software (Tree Star, Inc.). Total cell counts in blood and bone marrow samples were determined using CountBright absolute counting beads.
2.9 Flow cytometric cell sorting
Blood samples from Apoe−/− mice were subjected to red blood cell lysis and antibody stainings as described above for sorting CD19+ B cells, CD3+ T cells, CD115+ monocytes, and Ly6G+ neutrophils using a BD FACSAria III Cell Sorter (BD Biosciences). The sorted cells were deep frozen in 2 × TCL buffer plus (Qiagen) plus 1% beta-mercaptoethanol.
2.10 In vitro assays with bone marrow-derived macrophages
Bone marrow cells were cultured for 7–10 days with M-CSF as described in Supplementary material online, Methods to allow differentiation into bone marrow-derived macrophages (BMDMs). In some experiments, BMDMs were treated with oestradiol (10 nM), tamoxifen (1 µM), LPS (10 ng/mL), CB1 agonist ACEA (1 µM), or CB1 antagonist AM281 (10 µM). In case of combined LPS treatment with CB1 blocking, AM281 was added 15 min prior to LPS. The p53 inhibitor pifithrin-α (PFT-α; 25 µM) was added 5 min before stimulating the cells with ACEA or AM281. BMDM were incubated with DHR123 (2.5 µg/mL; 851000, Cayman) for ROS detection, MitoTracker (50 nM, ThermoFisher) or Dil-oxLDL (1 µg/mL) and subsequently measured with a FACS Canto-II. Cell proliferation was measured by flow cytometry after intracellular Ki67 staining. IL1β in BMDM supernatant was measured by DuoSet ELISA (R&D Systems). For nuclear p53 detection, cells were fixed with acetone, immunostained with anti-phospho-p53 and anti-rabbit-AF488 antibodies, and images were taken with a fluorescence microscope (DM6000B).
2.11 Quantitative real-time PCR
Total RNA from BMDM was isolated (peqGOLD, 13-6834-02, VWR Life Science) and reverse transcribed (PrimeScript RT reagent kit, TaKaRa). Real-time qPCR was performed with the QuantStudio™ 6 Pro Real-Time PCR System (ThermoFisher) using the GoTaq Probe qPCR Master Mix (Promega). Primers and probes were purchased from Life Technologies (see Supplementary material online, Table S5). Target gene expression was normalized to hypoxanthine guanine phosphoribosyltransferase (Hprt) gene expression and represented as fold change relative to the control group.
2.12 Droplet digital PCR
Total RNA from sorted cells was isolated, reverse transcribed and droplet digital PCR (ddPCR) was performed with the QX200 ddPCR™ system (Bio-Rad) as detailed in Supplementary material online, Methods.
2.13 RNA sequencing
BMDMs were isolated (n = 5 donor mice), cultured as described above and stimulated with ACEA for 24 h. Total RNA from lysed BMDMs was used for RNA sequencing and bioinformatics analysis as explained in the Supplementary material online, Methods.
2.14 Phospho kinase array
BMDMs isolated from four donor mice were treated with ACEA for 60 min and proteins extracted to determine serine-threonine kinase (STK) profiles using the PamChip® peptide Ser/Thr Kinase assay microarray systems on PamStation®12, respectively (PamGene International). Each STK-PamChip® array contains 144 individual phospho-site(s).
2.15 Extracellular flux analysis
Mitochondrial respiration in BMDMs was assessed using the Seahorse Cell Mito Stress Test in a Seahorse Analyzer XFe24 (Agilent) with some adjustments to the manufacturer’s protocol as detailed in Supplementary material online, Methods.
2.16 Human carotid artery plaques
Human carotid artery plaques were harvested during carotid artery endarterectomy (CEA) surgery, transported to the laboratory, and snap frozen. The patients’ characteristics are summarized in Supplementary material online, Table S6. RNA sequencing was performed as detailed in Supplementary material online, Methods. All patients provided written informed consent in accordance with the Declaration of Helsinki. The study has been approved by the local Ethics Committee of the Klinikum rechts der Isar of the Technical University Munich (diary numbers 2799/10 and 2799/10S).
2.17 Statistics
Statistical analyses were performed using GraphPad Prism version 8.0 or higher (GraphPad Software, Inc.). Outliers were identified with ROUT = 1, and normality of the data was tested via the D’Agostino–Pearson omnibus normality test. To compare two normally distributed groups of data without differences in the variances, an unpaired Student’s t-test was performed. For >2 groups, the data were compared by one-way or two-way ANOVA. For post hoc analysis, the Sidak, Tukey, or Dunett test was performed to correct for multiple comparisons and the Fisher Least Significant Difference test was used for planned comparisons. All data are shown as mean ± S.E.M. A two-tailed P < 0.05 was considered statistically significant.
3. Results
3.1 Inactivation of myeloid CB1 reduces early and advanced atherosclerotic plaque formation
We first confirmed the expression of the CB1 encoding gene Cnr1 in sorted mouse blood leucocytes using ddPCR, revealing highest mRNA levels in lymphocytes, and slightly lower levels in monocytes and neutrophils (see Supplementary material online, Figure S1A). In bone marrow-derived macrophages (BMDMs) isolated from Apoe−/− mice, inflammatory stimulation with oxLDL, LPS or both combined synergistically increased Cnr1 expression levels (see Supplementary material online, Figure S1B), which is in line with previous findings in macrophage cell lines.2,14 We subsequently crossbred Cnr1flox/flox mice with LysMCre mice, using the apolipoprotein E deficiency (Apoe−/−) background as a model of atherosclerosis. In situ hybridization combined with immunofluorescence staining confirmed Cnr1 expression by CD68+ plaque macrophages in aortic root sections of control mice (Apoe−/−LysMCre), while the Cnr1 signal was undetectable in plaques of mice with myeloid Cnr1 deficiency (Apoe−/−LysMCreCnr1flox/flox; Supplementary material online, Figure S1C). In cultured bone marrow-derived macrophages (BMDMs) obtained from Apoe−/−LysMCreCnr1flox/flox mice, qPCR analysis revealed a 50% lower Cnr1 expression level compared to Apoe−/−LysMCre controls (see Supplementary material online, Figure S1D). This is in accordance with the use of heterozygous LysMCre mice throughout our entire study, to avoid a full disruption of LysM expression due to the Cre insertion into the first coding ATG of the lysozyme M gene.16
After successful establishment of the mouse model, we asked whether depletion of CB1 in myeloid cells affected early stages of atherosclerotic plaque formation. For this purpose, we initially used two separate control groups, in order to exclude any effect of the Cnr1flox/flox or LysMCre transgene insertion on the atherosclerosis phenotype, independent of the myeloid Cnr1 depletion. In subsequent experiments, Apoe−/−LysMCre mice were consistently used as controls. After 4 weeks of WD feeding, male mice with myeloid Cnr1 deficiency had smaller plaques within the aortic roots compared to the Apoe−/−Cnr1flox/flox or Apoe−/−LysMCre control group (Figure 1A–D). Conversely, no effect of myeloid Cnr1 deficiency on early atherogenesis was observed in female mice. The smaller plaque size in males was linked to lower arterial macrophage accumulation, which was unaffected in females; nonetheless, both male and female plaques had a lower content of inflammatory iNOS+CD68+ macrophages (Figure 1E–G). However, myeloid Cnr1 deficiency did not affect plaque neutrophil counts (see Supplementary material online, Figure S2).
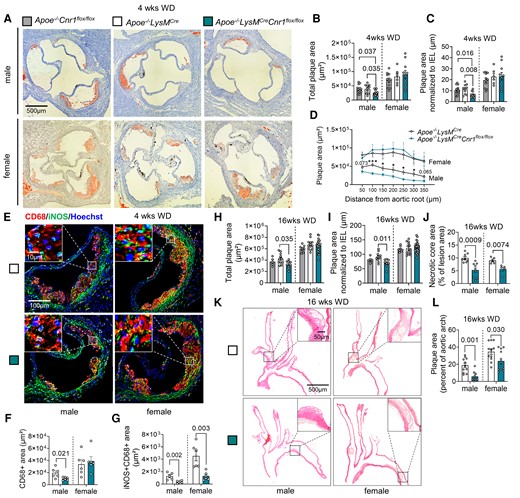
Impact of myeloid Cnr1 deficiency on atherogenesis and plaque progression. (A–D) Representative Oil-Red-O (ORO) stains of aortic roots of male (n = 12–15) and female (n = 6–11) Apoe−/−Cnr1flox/flox, Apoe−/−LysMCre, and Apoe−/−LysMCreCnr1flox/flox mice after 4 weeks of Western diet (WD); scale bar: 500 μm. (B) Quantification of absolute lesion area or (C) normalized to IEL. (D) Plaque area per aortic root section. (E) Double immunostaining of iNOS (green) and CD68 (red) in aortic root lesions of Apoe−/−LysMCre and Apoe−/−LysMCreCnr1flox/flox mice after 4 weeks of WD. Nuclei were counterstained with Hoechst 33342 (blue). Scale bar: 10 μm (top) and 100 µm (bottom). (F) Quantification of lesional macrophages and (G) inflammatory macrophages identified by combined positive CD68 and iNOS staining (n = 5–6). (H) Quantification of absolute lesion area or (I) normalized to IEL in aortic root sections after 16 weeks of WD (n = 5–21). (J) Necrotic core area quantified in Masson Trichrome-stained aortic root sections after 16 weeks of WD (n = 5–9). (K and L) Representative HE stains of aortic arches and plaque area quantification in male and female Apoe−/−LysMCre and Apoe−/−LysMCreCnr1flox/flox mice after 16 weeks of WD (n = 9–12); scale bar: 500 μm. Each dot represents one biologically independent mouse sample and all data are expressed as mean ± S.E.M. Two-sided unpaired Student’s t-test (D, F, G, J, and L), one-way ANOVA followed by Tukey test (B and C) or Dunnett T3 test (H and I) were used to determine the significant differences. Male and female were analysed independently (B–D, F–J, and L). Exact P-values are shown or indicated as ***P < 0.001 and *P < 0.05 in (D).
At advanced plaque stage after 16 weeks WD feeding, a lower aortic root plaque size was again only found in male Apoe−/−LysMCreCnr1flox/flox mice when compared to Apoe−/−LysMCre controls, with a similar phenotype observed in descending aortas (Figure 1H and I and Supplementary material online, Figure S3). However, the necrotic core size was smaller in both male and female aortic sinus plaques while other plaque components were comparable between genotypes, indicative of a more stable plaque phenotype in mice lacking CB1 (Figure 1J and Supplementary material online, Figure S4). Furthermore, the relative plaque area within aortic arches was smaller in both male and female Apoe−/−LysMCreCnr1flox/flox mice (Figure 1K and L). Depleting myeloid CB1 signalling also affected metabolic parameters upon long-term 16 weeks WD feeding, which were only significant in male mice and manifested as lower plasma cholesterol levels (see Supplementary material online, Figure S5). Together, these findings indicate that the effect of myeloid Cnr1 deficiency on the plaque phenotype appears to be stage- and vessel-dependent and affected by the biological sex.
3.2 Lack of myeloid CB1 reduces chemokine receptor expression and arterial monocyte recruitment
Monocyte recruitment from the blood is the major source for plaque macrophages, in particular during atherogenesis.17 We therefore asked whether myeloid Cnr1 deficiency affected circulating myeloid counts. We found higher levels of circulating monocytes in both male and female mice with myeloid Cnr1 deficiency after 4 weeks WD (Figure 2A and B), while neutrophil blood counts at this time point were only elevated in male, but not female Apoe−/−LysMCreCnr1flox/flox mice (see Supplementary material online, Figure S6A and B). Remarkably, an inverted pattern was observed at advanced stage of ≥12 weeks WD, with lower monocyte and neutrophil counts in Apoe−/−LysMCreCnr1flox/flox mice compared to Apoe−/−LysMCre controls (Figure 2A and B, Supplementary material online, Figure S6A and B). No significant differences in myeloid cell counts were observed in the bone marrow between the genotypes, neither at baseline nor in WD condition, except for a moderate difference in neutrophil counts of female at early and advanced stage (see Supplementary material online, Figure S6C–F). Furthermore, there was no difference in lymphocyte blood counts between the genotypes (see Supplementary material online, Figure S6G and H). Based on these findings, we hypothesized that the lack of CB1 in myeloid cells affects their arterial recruitment and possibly their life span.
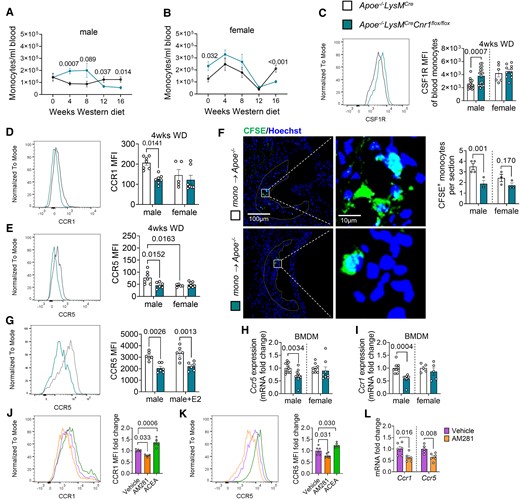
Impact of myeloid Cnr1 deficiency on circulating leucocyte counts, chemokine receptor expression, and arterial recruitment. (A, B) Number of circulating monocytes in male (7–19) and female (5–23) Apoe−/−LysMCre and Apoe−/−LysMCreCnr1flox/flox mice assessed by flow cytometry. (C) Flow cytometric analysis of colony-stimulating factor 1 receptor (CSF1R) expression on circulating monocytes after 4 weeks of WD (n = 6–18). (D, E) Flow cytometric analysis of CCR1 and CCR5 surface expression on circulating monocytes after 4 weeks of WD (n = 6–8). (F) Microscopy images and quantification of CFSE-labelled monocytes (green) recruited into aortic root lesions 48 h after injection into male Apoe−/− mice on WD for 4 weeks (n = 3–4), Nuclei were stained with Hoechst 33342 (blue); scale bar: 100 μm (left) and 10 µm (right). (G) Flow cytometric analysis of male BMDM treated with vehicle or 10 nM oestradiol (E2) for 24 h (n = 6). (H, I) Gene expression levels in untreated male and female BMDMs (n = 5–12). (J, K) Flow cytometric analysis of male BMDM from Apoe−/− mice treated with vehicle, 10 µM AM281 or 1 µM ACEA for 24 h (n = 4–6). (L) Gene expression levels in male Apoe−/− BMDMs treated with vehicle or 10 µM AM281 for 8 h (n = 5–6). Each dot represents one biologically independent mouse sample and all data are expressed as mean ± S.E.M. Two-sided unpaired Student’s t-test (A–C, F, H, I, and L), one-way ANOVA followed by Tukey test (J and K), two-way ANOVA followed by Tukey test (D, E, G). Male and female were analysed independently (A–I).
In support of a pro-survival effect on monocytes, we noted that circulating male Cnr1-deficient monocytes had significantly higher surface levels of CD115, also known as colony-stimulating factor-1 receptor (CSF1R) or macrophage-colony-stimulating factor receptor (M-CSFR; Figure 2C).18,19 Since plaque monocyte recruitment depends on the chemokine receptors CCR1 and CCR5,20 we analysed their surface expression on circulating monocytes after 4 weeks WD and observed significantly lower CCR1 and CCR5 expression levels in the blood of male Apoe−/−LysMCreCnr1flox/flox compared to Apoe−/−LysMCre mice, while no difference was found in females (Figure 2D and E). Lower CCR5 surface levels of male Cnr1-deficient monocytes were consistently detectable until the 16 weeks diet endpoint, while CCR1 expression levels were only different at early (4 and 8 weeks WD), but not later time points (12 to 16 weeks WD; Supplementary material online, Figure S7A–F). The surface levels of CXCR2 on neutrophils were comparable between the genotypes, suggesting that neutrophil recruitment is unaffected by myeloid Cnr1 deficiency (see Supplementary material online, Figure S7G–J). Furthermore, there was no difference in monocyte CCR2 expression levels between the genotypes, indicating that the differences in male blood monocyte counts between the genotypes were not due to a modulation of CCR2-dependent bone marrow mobilization (see Supplementary material online, Figure S7K and L). In support of a sex-dependent impact of arterial monocyte recruitment on plaque macrophage accumulation, a significant inverse correlation between plaque macrophages and circulating monocytes was only evident in males, but not females (see Supplementary material online, Figure S7M and N).
To strengthen our hypothesis that myeloid Cnr1 deficiency leads to lower arterial monocyte recruitment, we performed an adoptive transfer experiment. Fluorescently labelled monocytes isolated from Apoe−/−LysMCreCnr1flox/flox or Apoe−/−LysMCre mice were injected into Apoe−/− recipients pre-treated with WD for 4 weeks. Fluorescence microscopic analysis of male aortic root sections transplanted with male monocytes revealed a significantly lower number of plaque-infiltrated Cnr1-deficient vs. Cnr1-expressing monocytes, while the values in females did not reach significance (Figure 2F).
To study the CB1-dependent regulation of CCR1 and CCR5 expression in more detail, we moved to in vitro experiments with BMDMs isolated from Apoe−/−LysMCreCnr1flox/flox or Apoe−/−LysMCre mice. A lower CCR5 surface expression was reproducible in male, but not female Cnr1-deficient BMDMs (Figure 2G). Treatment with the potent oestrogen receptor ligand oestradiol at 10 nM concentration did not affect the CCR5 surface expression in male BMDMs, indicating that the sex-specific regulation of CCR5 by CB1 cannot be explained by differences in oestrogen signalling (Figure 2G). The qPCR analysis further revealed lower Ccr1 and Ccr5 mRNA levels in male Cnr1-deficient BMDMs (Figure 2H and I). Treatment of male Apoe−/− BMDMs with the selective synthetic CB1 agonist ACEA increased the CCR1 and CCR5 surface levels, whereas treatment with the CB1 antagonist AM281 led to lower surface levels compared to vehicle treated BMDMs (Figure 2J and K). Likewise, CB1 antagonism in male Apoe−/− BMDMs led to lower Ccr1 and Ccr5 mRNA levels (Figure 2L), which altogether suggests a direct regulatory effect of CB1 signalling on these chemokine receptors, possibly at the transcriptional or post-transcriptional level.
3.3 Lack of myeloid CB1 inhibits macrophage proliferation in a sex-dependent manner
Not only de novo recruitment, but also local proliferation determines the content of macrophages in the lesion.21 Co-immunostaining of macrophages and proliferation marker Ki67 revealed fewer proliferating macrophages per section in aortic roots of male Apoe−/−LysMCreCnr1flox/flox compared to Apoe−/−LysMCre mice after 4 weeks WD (Figure 3A and B). Again, no difference was detected between the genotypes in females, while the proliferation rate was generally lower in female vs. male plaque macrophages (Figure 3A and B). The same pattern was observed after 16 weeks diet (see Supplementary material online, Figure S8A and B). Taking into account that macrophage marker-expressing cells in the plaque could be of smooth muscle cell origin, we co-stained with the leucocyte marker CD45, indicating that the majority of counted Ki67+ CD68+ cells was of leucocyte origin. The proliferation phenotype was reproduced in vitro in male and female BMDMs, confirming lower proliferation rates in male Apoe−/−LysMCreCnr1flox/flox compared to Apoe−/−LysMCre macrophages (Figure 3C and D). We hypothesized that sex hormones might be involved in the sex-dependent regulation of proliferation and checked for hormone receptor expression in myeloid cells in public transcriptomic databases (immgen.com). Accordingly, macrophages express oestrogen receptor ERα (Esr1). We confirmed the expression of Esr1 in in vitro cultured macrophages by qPCR, revealing that male BMDM had lower Esr1 expression levels compared to females, while deficiency of Cnr1 resulted in elevated Esr1 levels in male BMDMs in comparison to their respective male controls (see Supplementary material online, Figure S8C). Interestingly, we also found that the Cnr1 expression level in male Apoe−/− BMDMs was higher compared to female Apoe−/− BMDMs (see Supplementary material online, Figure S8D). Next, we treated male BMDMs with oestradiol, which blunted the difference in proliferation between male Apoe−/−LysMCre and Apoe−/−LysMCreCnr1flox/flox BMDMs (Figure 3E). Moreover, the ERα antagonist tamoxifen dose-dependently increased the proliferation rate in female BMDMs from Apoe−/−LysMCre controls, without affecting female BMDMs from Apoe−/−LysMCreCnr1flox/flox donors (see Supplementary material online, Figure S8E and Figure 3F). Combined treatment of male Apoe−/− BMDMs with oestradiol and tamoxifen abolished the anti-proliferative effects of oestradiol (see Supplementary material online, Figure S8F). In vivo treatment of female mice on atherogenic diet for 4 weeks by intraperitoneal tamoxifen injections starting 3 days before harvest resulted in higher peritoneal cavity and plaque macrophage proliferation rates in female Apoe−/−LysMCre controls, but not in females with myeloid Cnr1 deficiency (Figure 3G–J). These findings suggest that in vivo blocking of ERα in females phenocopies the proliferation effects observed in male mice.
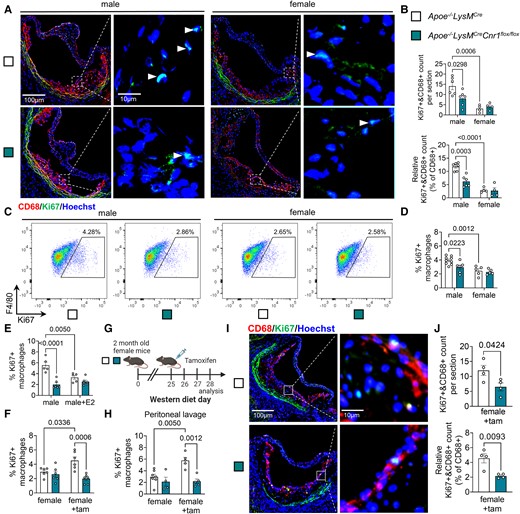
Role of CB1 and oestrogen signalling in macrophage proliferation. (A) Representative images of proliferating (Ki67+, green and marked with white arrowheads) macrophages (CD68+, red) in aortic root plaques after 4 weeks Western diet (WD); nuclei were counterstained with Hoechst 33342 (blue). Scale bar: 100 μm (left) and 10 µm (right). (B) Total and relative counts of proliferating plaque macrophages (n = 4–6). (C, D) Flow cytometric analysis of proliferation rates in untreated male and female BMDMs isolated from Apoe−/−LysMCre and Apoe−/−LysMCreCnr1flox/flox mice (n = 5–9). (E) Proliferation rates in male BMDM treated with vehicle or 10 nM oestradiol (E2) for 24 h (n = 5–6). (F) Proliferation rates in female BMDM treated with vehicle or 1 µM tamoxifen (tam) for 24 h (n = 3–4). (G–J) Apoe−/−LysMCre and Apoe−/−LysMCreCnr1flox/flox female mice were fed with Western diet (WD) for 4 weeks and subjected to daily ip injections of 1 mg tamoxifen or vehicle for the last 3 days prior to analysis of proliferation rates in peritoneal macrophages (H; n = 4–7). (I) Representative immunostainings of proliferating (Ki67+) macrophages (CD68+) in aortic root plaques (nuclei, Hoechst); scale bar: 100 μm (left) and 10 µm (right). (J) Total and relative counts of proliferating plaque macrophages (n = 4). Each dot represents one mouse and all data are expressed as mean ± S.E.M. Two-sided unpaired Student’s t-test (J), two-way ANOVA followed by Tukey test (B, D–F, and H).
3.4 CB1 activation induces macrophage proliferation by suppressing p53 nuclear translocation
To corroborate our findings observed after genetic depletion of Cnr1, we asked whether acute pharmacological CB1 antagonism or agonism would affect macrophage proliferation. Indeed, the treatment of male, but not female Apoe−/− BMDMs with the CB1 antagonist AM281 inhibited the proliferation rate (Figure 4A). Conversely, stimulation with the CB1 agonist ACEA increased the proliferation of male, but not female Apoe−/− BMDMs (Figure 4A). To address the underlying signalling pathways involved in the CB1-dependent regulation of cell proliferation, we performed a chip-based kinase activity profiling in BMDMs. Stimulating male Apoe−/− BMDMs with the CB1 agonist ACEA revealed a significant down-regulation of the activity of several kinases linked to p53 signalling and cyclin-dependent regulation of cell cycle (Figure 4B–D). The inhibition of male Apoe−/− BMDM proliferation by CB1 antagonism was not observed when pre-treating the cells with the p53 inhibitor pifithrin-α (PFTα) (Figure 4E). Moreover, CB1 antagonism with AM281 resulted in higher nuclear translocation of phosphorylated p53, whereas the CB1 agonist ACEA lowered the levels of nuclear p53 compared to vehicle (Figure 4F and G).
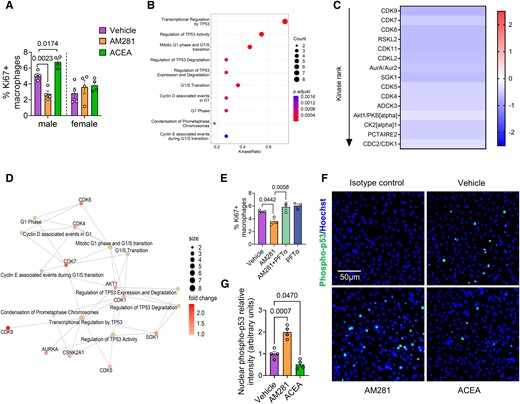
Effect of CB1 stimulation on kinase activity and p53 nuclear translocation. (A) Proliferating male and female Apoe−/− BMDMs treated with vehicle, 10 µM AM281 or 1 µM ACEA for 24 h (n = 4). (B) Top 10 enriched kinase pathways and (C) heatmap of kinase activity in male Apoe−/− BMDM treated with vehicle or 1 µM ACEA for 60 min (n = 4). Values indicate mean kinase statistic; significantly different kinases with median final score > 1.2 are shown. (D) Interaction map showing kinase pathways regulated in ACEA-stimulated male BMDMs. (E) Proliferation rates in male BMDM treated with vehicle, AM281 (10 µM) and p53 inhibitor (PFT-α; 25 µM) for 24 h (n = 3). (F and G) Phospho-p53 immunostaining (green) and quantification of nuclear p53 translocation in male Apoe−/− BMDMs treated with vehicle, 1 µM ACEA or 10 µM AM281 for 60 min. Nuclei were stained with Hoechst33342 (blue); scale bar: 50 μm (n = 4). Each dot represents one mouse and all data are expressed as mean ± S.E.M. One-way ANOVA followed by Tukey test (H and I), two-way ANOVA followed by Tukey test (A, E, and G). Male and female were analysed independently (A).
3.5 Lack of myeloid CB1 promotes a less pro-inflammatory macrophage phenotype
Our plaque immunostaining analysis indicated a less inflammatory macrophage phenotype in aortic roots of Apoe−/−LysMCreCnr1flox/flox mice, which was evident in both males and females (Figure 1G). To follow up on these findings, we performed additional in vitro experiments with male BMDMs, considering that the most potent effects of Cnr1 deficiency were observed in male mice. The transcriptomic profiling of BMDMs by qPCR revealed a down-regulation of pro-inflammatory markers (Irf5, Nos2) in male Apoe−/−LysMCreCnr1flox/flox compared to Apoe−/−LysMCre BMDMs, while anti-inflammatory markers (Cx3cr1, Chil3) were up-regulated (Figure 5A). These data were supported by flow cytometry, revealing lower surface expression of pro-inflammatory macrophage activation markers in response to LPS stimulation, namely the receptor CD38 and costimulatory molecule CD80 on Apoe−/−LysMCreCnr1flox/flox compared to Apoe−/−LysMCre BMDMs (Figure 5B and C). In agreement with the reduced inflammatory phenotype of Cnr1-deficient BMDMs, transcript levels of pro-inflammatory cytokines were less up-regulated in response to LPS stimulation (Figure 5D), which was validated at the protein level in cell culture supernatants for the key pro-atherogenic factor IL1-β (Figure 5E). A similar transcriptomic signature was found in vivo in peritoneal macrophages of male Apoe−/−LysMCreCnr1flox/flox compared to Apoe−/−LysMCre mice collected after 4 weeks WD, whereas only a non-significant difference for reduced Il1β expression was detected in females (see Supplementary material online, Figure S9A). Moreover, male and female Apoe−/−LysMCreCnr1flox/flox BMDMs showed lower oxLDL uptake compared to Apoe−/−LysMCre BMDMs (Figure 5F). The lower oxLDL uptake was in accordance with a lowered lipid content of plaque macrophages in aortic roots of Apoe−/−LysMCre Cnr1flox/flox mice after 4 weeks WD, although this was only observed in male mice (see Supplementary material online, Figure S9B), which supports a role for CB1 in the regulation of macrophage cholesterol uptake or metabolism in atherosclerosis.
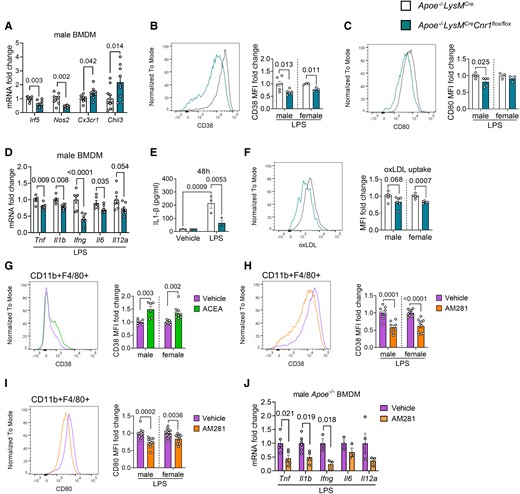
Role of CB1 in inflammatory macrophage polarization and oxLDL uptake. BMDMs were isolated from Apoe−/−LysMCre and Apoe−/−LysMCreCnr1flox/flox (A–F) or Apoe−/− mice (G–J). (A) Expression levels of macrophage polarization markers in unstimulated male BMDMs, determined by qPCR (n = 7–12). Flow cytometric analysis of CD38 (B) and CD80 (C) surface expression of male and female BMDMs after 48 h of LPS (10 ng/mL) stimulation (n = 3–6). (D) Gene expression levels (qPCR) of pro-inflammatory cytokines in male BMDMs after 8 h of LPS stimulation (n = 5–7). (E) IL1β secretion of male BMDMs after 48 h of LPS stimulation (n = 3). (F) Flow cytometric analysis of labelled dil-oxLDL uptake by male and female BMDMs (n = 5–6). (G) CD38 surface expression on 24 h vehicle- or 1 µM ACEA-treated male and female BMDMs (n = 6–10) or (H) 24 h LPS-stimulated male and female BMDMs in presence of 10 µM AM281 or vehicle (n = 8–12). (I) CD80 surface expression on 24 h LPS-stimulated male and female BMDMs in presence of 10 µM AM281 or vehicle (n = 8–12). (J) Gene expression levels of pro-inflammatory cytokines in male Apoe−/− BMDMs after 8 h LPS stimulation in presence of 10 µM AM281 or vehicle (n = 3–5). Each dot represents one biologically independent mouse sample and all data are expressed as mean ± S.E.M. Two-sided unpaired Student’s t-test (A–D and F–J), two-way ANOVA followed by Tukey test (E). Male and female were analysed independently (B, C, and F–I).
In support of a direct effect of CB1 signalling on macrophage inflammatory reprogramming, stimulating male or female Apoe−/− BMDMs with the CB1 agonist ACEA up-regulated the surface expression of CD38 (Figure 5G), while CB1 antagonism with AM281 inhibited the LPS-induced induction of CD38 and CD80 expression (Figure 5H and I). In addition, the induction of pro-inflammatory cytokine mRNA expression by LPS in male BMDMs was suppressed by CB1 antagonism with AM281 (Figure 5J).
3.6 Transcriptomic profiling of BMDMs reveals a profound transcriptional, translational, and metabolic regulation by CB1
To gain detailed insights into the molecular pathways elicited by CB1 activation in macrophages, we subsequently performed RNA sequencing of male Apoe−/− BMDMs stimulated with CB1 agonist ACEA. The top gene ontology (GO) biological processes and molecular functions regulated by CB1 were linked to transcriptional regulation, chromatin, and histone modification (Figure 6A and B and Supplementary material online, Figure S10A–C), suggesting that CB1 might control transcriptional regulation through epigenetic modifications. In addition, the transcriptomic signature of ACEA-stimulated male BMDMs was enriched in pathways linked to myeloid differentiation, leucocyte migration, mRNA processing, actin cytoskeletal organization, and spindle organization, which largely fits to our observations in the myeloid Cnr1 deficiency mouse model. Gene set enrichment analysis (GSEA) further revealed significant associations with inflammatory response, cholesterol transport, and cholesterol efflux (see Supplementary material online, Figure S10D). Of note, RNA sequencing of female Apoe−/− BMDMs stimulated with CB1 agonist ACEA did not reveal any DEGs in comparison to the vehicle group (n = 6, data not shown), supporting our observations that the impact of CB1 signalling in macrophages seems to be more pronounced in males. We therefore focused on male BMDMs for subsequent bioinformatic analyses of the RNA sequencing data.
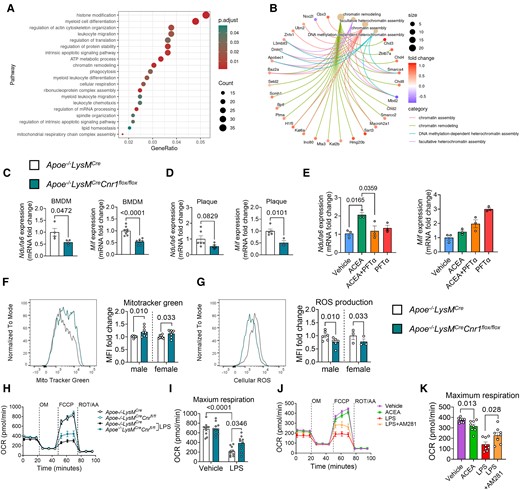
Gene expression profile and mitochondrial effects of CB1 signalling in macrophages. BMDMs were isolated from Apoe−/− (A, B, E, J, K) or Apoe−/−LysMCre and Apoe−/−LysMCreCnr1flox/flox mice (C, D, F–I). (A) Top regulated biological processes based on gene ontology and (B) network analysis of chromatin modification pathways and associated DEGs in male BMDMs treated with 1 µM ACEA for 24 h, compared to vehicle. (C) Gene expression analysis (qPCR) in BMDMs obtained from baseline male mice (n = 4–8) or (D) laser capture microdissected plaques of aortic root sections from male mice (n = 3–6) subjected to 4 weeks Western diet (WD). (E) Gene expression analysis (qPCR) in male BMDMs (n = 3) treated with 1 µM ACEA for 30 min alone or in presence of p53 inhibitor (PFT-α). (F) Flow cytometric analysis of mitochondrial content in male and female BMDMs, determined by MitoTracker™ green staining (n = 8), and (G) reactive oxygen species (ROS) determined by dihydrorhodamine 123 (DHR123) staining (n = 3–6). (H–K) Oxygen consumption rate (OCR) in male BMDMs (n = 8–10 mice) after sequential injection of oligomycin (OM), carbonyl cyanide 4-(trifluoromethoxy)phenylhydrazone (FCCP), and rotenone (ROT) plus antimycin A (AA). Each dot represents one biologically independent mouse sample and all data are expressed as mean ± S.E.M. Two-sided unpaired Student’s t-test (C, D, F, and G), one-way ANOVA followed by Tukey test (E and K), two-way ANOVA followed by Tukey test (I).
Among the genes up-regulated by CB1 stimulation in male BMDMs, we found Mif, which is an atypical chemokine and well known to play a crucial role in atherosclerosis (see Supplementary material online, Figure S10A and C).22 The down-regulated Ndufa6 gene encodes the protein NADH:ubiquinone oxidoreductase subunit A6, which is an accessory subunit of the mitochondrial membrane respiratory chain complex I. Accordingly, the GO biological process analysis also indicated a regulation of ATP metabolic process (Figure 6A).
These two key DEGs were confirmed by qPCR, revealing a down-regulation of Ndufa6 and Mif in Apoe−/−LysMCreCnr1flox/flox BMDMs by qPCR (Figure 6C). To further strengthen the in vivo relevance of CB1 in regulating the identified key targets, we additionally performed laser capture microdissection (LCM) of plaques after 4 weeks WD, which revealed a significantly lower Mif expression in plaques of Apoe−/−LysMCreCnr1flox/flox mice, while the plaque Ndufa6 levels were not significantly regulated (Figure 6D).
In subsequent time course experiments stimulating BMDMs with 1 µM CB1 agonist ACEA, we observed an early up-regulation of Ndufa6 mRNA levels within 30 min, while Mif was highly up-regulated after 8 h of ACEA stimulation (see Supplementary material online, Figure S10E). The top transcription factor binding sites within the Mif promoter includes a binding side for p53,23 which appeared as CB1 target according to the kinase activity profiling (Figure 4B). Pre-treatment with the p53 inhibitor PFTα prevented the early up-regulation of the Ndufa6 mRNA level in response to ACEA after 30 min, while the up-regulation of Mif was not inhibited, but rather enhanced by p53 inhibition (Figure 6E), possibly involving post-transcriptional mechanisms such as mRNA processing and stability.
To follow up on the GO pathway analysis indicating a role for CB1 in mitochondrial oxidative respiration, we addressed a possible regulation of mitochondrial activity by CB1 signalling. Measurement of the mitochondrial content by flow cytometry revealed a significantly higher mitotracker staining intensity in male and female Apoe−/−LysMCre Cnr1flox/flox compared to Apoe−/−LysMCre BMDMs (Figure 6F). In support of an improved mitochondrial function, Cnr1-deficient BMDMs produced lower levels of ROS (Figure 6G). Functional measurement of the oxygen consumption rate (OCR) in BMDMs with the Seahorse extracellular flux analyser showed no difference in maximum respiration between Apoe−/−LysMCre Cnr1flox/flox compared to Apoe−/−LysMCre BMDM under homoeostatic condition; however, Cnr1 deficiency partially preserved OCR in response to LPS stimulation, resulting in significantly higher maximum respiration rates compared to LPS-treated controls (Figure 6H and I). ACEA treatment of Apoe−/− BMDMs was sufficient to significantly reduce maximum respiration rates, whereas AM281 partially prevented the LPS-induced decline of OCR (Figure 6J and K).
3.7 Peripheral CB1 antagonism inhibits plaque progression in atherosclerosis
The atheroprotective phenotype of myeloid Cnr1 deficiency prompted us to address the therapeutic potential of peripheral CB1 antagonism. For this purpose, we decided to use the Ldlr−/− mouse model of atherosclerosis, which more closely reflects the cholesterol profile in humans compared to the Apoe−/− model.24 As expected, chronic injection of the peripheral CB1 antagonist JD5037 for 4 weeks improved some metabolic parameters, including lower plasma cholesterol levels in both males and females, lower plasma triglyceride levels in males, and significantly reduced body weight increase only evident in males (see Supplementary material online, Figure S11A–D).
Moreover, the 4-week treatment was sufficient to inhibit early-stage plaque progression in aortic roots and arches of male mice, whereas female mice treated with either JD5037 or vehicle had comparable plaque sizes (Figure 7A–F). The reduced plaque growth in male aortic roots was related to a lower macrophage accumulation, proliferation, and inflammatory polarization as indicated by a lower number of iNOS+CD68+ plaque macrophages (Figure 7G–I and Supplementary material online, Figure S11E). A lower surface CD80 expression level on peritoneal macrophages was found in both male and female mice receiving JD5037, indicative of a decreased inflammatory phenotype (see Supplementary material online, Figure S11F). The differential effects of peripheral CB1 antagonism on female peritoneal vs. plaque macrophages might be related to higher local concentrations of JD5037 at the peritoneal injection site as well as distinct transcriptomic signatures of macrophages depending on their tissue origin.25
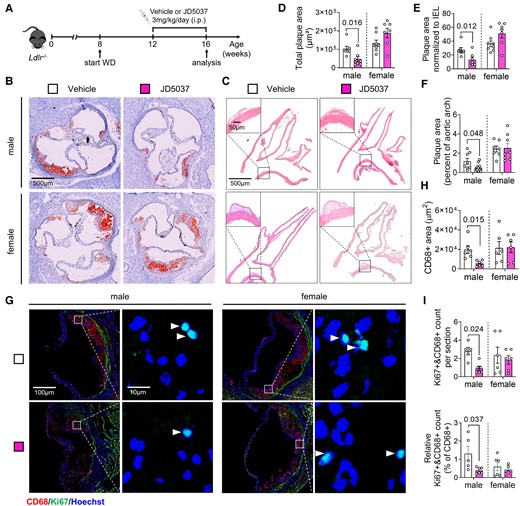
Effect of chronic peripheral CB1 antagonist administration on atherosclerosis and macrophage proliferation. (A) Experimental scheme. Ldlr−/− mice were fed with Western diet (WD) for 8 weeks and subjected to daily iv injections of JD5037 (3 mg/kg) or vehicle for the last 4 weeks. (B) Representative images of aortic root cross-sections stained with ORO. (C) Representative images of HE-stained aortic arch longitudinal sections. (D) Quantification of absolute lesion area within aortic roots (n = 7–8 mice) or (E) normalized to IEL (n = 7–8). (F) Quantification of the plaque area in aortic arch sections (n = 7–8). (G) Representative images of proliferating (Ki67+, green; white arrowheads) macrophages (CD68+, red) in aortic root plaques; nuclei were counterstained with Hoechst (blue). Scale bar: 100 μm (left) and 10 µm (right). (H) Quantification of lesional macrophage area (n = 6) and (I) total as well as relative counts of proliferating plaque macrophages (n = 5–6). Each dot represents one biologically independent mouse sample and all data are expressed as mean ± S.E.M. Two-sided unpaired Student’s t-test (D–F, H, I). Male and female were analysed independently.
3.8 Expression of CNR1 in advanced human atherosclerosis
Finally, to address a possible implication of CB1 signalling in the regulation of proliferation, inflammation, and mitochondrial function in human atherosclerotic plaques, bulk RNA sequencing data from patients undergoing carotid endarterectomy (CEA) were analysed.26 We focused on key markers that were regulated by CB1 in our murine macrophage experiments. CNR1 transcript levels inversely correlated with P53, NDUFA6, CCR5 (see Supplementary material online, Figure S12), and various other markers (Table 1). This may support a direct relationship between CB1 and key cellular pathways in human plaque pathophysiology as well as mechanisms involved in lesion destabilization. Correlations between plaque CNR1 expression levels and key markers identified in the murine model appear to exist both in male and female patients, although the included subgroup analysis of male and female transcriptomic data should be taken with caution. Due to the limited sample size in females and confounding variables such as age and hormonal levels, it is difficult to make firm conclusions how sex may affect these correlations.
Human gene expression correlations between CNR1 and markers for proliferation, inflammation, and oxidative phosphorylation in human plaques
| All patients (n = 202) | Female (n = 57) | Male (n = 145) | |||||
|---|---|---|---|---|---|---|---|
| Function | Marker gene | Correlation coefficient | P-value | Correlation coefficient | P-value | Correlation coefficient | P-value |
| Proliferation | CSF1R | −0.22 | 0.001 | −0.25 | 0.061 | −0.2 | 0.017 |
| CSF2 | −0.23 | 0.001 | −0.12 | 0.394 | −0.26 | 0.002 | |
| MDM2 | 0.18 | 0.01 | 0.01 | 0.944 | 0.27 | ≤0.001 | |
| MKI67 | −0.16 | 0.025 | −0.32 | 0.016 | −0.1 | 0.236 | |
| STAT3 | 0.22 | 0.002 | −0.01 | 0.961 | 0.3 | ≤0.001 | |
| TP53 | −0.21 | 0.002 | −0.17 | 0.206 | −0.21 | 0.013 | |
| Inflammation | CCR5 | −0.21 | 0.003 | −0.23 | 0.084 | −0.2 | 0.019 |
| CD74 | −0.33 | ≤0.001 | −0.24 | 0.076 | −0.36 | ≤0.001 | |
| CEBPB | −0.38 | ≤0.001 | −0.31 | 0.018 | −0.39 | ≤0.001 | |
| IL1B | −0.24 | ≤0.001 | −0.24 | 0.068 | −0.24 | 0.004 | |
| IL6 | −0.26 | ≤0.001 | −0.16 | 0.229 | −0.3 | ≤0.001 | |
| MIF | −0.15 | 0.034 | −0.08 | 0.531 | −0.17 | 0.036 | |
| Oxidative phosphorylation | NDUFA6 | −0.36 | ≤0.001 | −0.1 | 0.448 | −0.47 | ≤0.001 |
| SIRT4 | −0.15 | 0.031 | −0.16 | 0.241 | −0.15 | 0.067 | |
Bulk RNA sequencing data from 202 patients undergoing carotid endarterectomy (CEA) were analysed.
4. Discussion
Using a targeted genetic depletion strategy and a pharmacological blocking approach, we here provide previously unknown insights into the molecular mechanisms of myeloid cell CB1 signalling in the context of atherosclerosis and report sex differences in macrophage proliferation involving oestrogen-ERα signalling. We found pleiotropic effects of CB1 signalling in circulating monocytes, plaque macrophages, peritoneal macrophages, and in vitro cultured BMDMs. Biological processes regulated by CB1 in monocytes and macrophages include recruitment and chemotaxis, proliferation, inflammatory cytokine production, oxLDL uptake, and mitochondrial oxidative respiration. The underlying molecular pathways of CB1 signalling involve p53-dependent transcriptional regulation and possibly chromatin accessibility and post-transcriptional mechanisms. In this context, it is noteworthy that a human genome-wide association study identified a single nucleotide polymorphism (rs75205693) in the CNR1 gene, which is associated with DNA methylation.27 Notably, the atheroprotective effects of myeloid Cnr1 deficiency were seen almost exclusively in male mice. Similarly, reduced macrophage proliferation was seen only in male myeloid Cnr1-deficient mice, whereas other effects, including reduced macrophage oxLDL uptake and reduced expression of some inflammatory surface markers, were sex independent. Interestingly, the proliferation rate per se was lower in female macrophages compared to male macrophages, due to an inhibitory effect of the female sex hormone oestradiol and the receptor ERα on cell proliferation, as previously reported in monocytic leukaemia cells and vascular smooth muscle cells, among others.28,29
The effects of CB1 signalling on cell proliferation may be related to a regulation of cellular cholesterol metabolism, as supported by our GSEA data, since genetic mutations in cholesterol uptake receptors or efflux critically affect myeloid cell proliferation.30,31 Consistent with this, CRISPR/Cas screens in human cell lines, accessible through the bioGRID repository for interaction datasets,32 support a link between CNR1 and cell proliferation (https://orcs.thebiogrid.org/Gene/12801). In a previous in vitro study, synthetic cannabinoids decreased expression of the cholesterol efflux transporter ABCA1 in RAW264.7 cells, while increasing expression of the scavenger receptor CD36, which mediates uptake of modified LDL. The effect was sensitive to pre-treatment with the CB1 antagonist/inverse agonist AM251.14 Human genetic studies have identified a causal variant in the CNR1 promoter that is associated with high-density lipoprotein cholesterol levels,33 supporting a complex role for CB1 signalling in the regulation of cholesterol metabolism.
The regulation of p53 activity and several cyclin-dependent kinases in response to CB1 stimulation, which are well known to be involved in cell cycle regulation,34 is consistent with CB1-dependent regulation of cell proliferation. In human plaques, CNR1 was inversely correlated with P53, which is consistent with our in vitro observations that CB1 stimulation decreased p53 nuclear translocation in murine BMDMs. An association between CB1 and p53 activity has previously been described in an experimental study of diet-induced hepatic steatosis.35 In addition to epigenetic mechanisms, the p53-dependent transcriptional regulation may be a central mechanism in our atherogenic myeloid Cnr1-deficient mouse model. Indeed, p53 has previously been associated with macrophage recruitment, proliferation, and reduced necrotic core size.36–38 Furthermore, recent evidence has shown that TP53-mediated clonal haematopoiesis confers an increased risk of incident atherosclerotic disease.39
In addition to its effects on proliferation, CB1 also plays a central role in inflammatory activation of macrophages, as supported by our GSEA results. The decreased expression levels of chemokines and chemokine receptors, the monocyte kinetics and their inverse correlation with plaque macrophages, together with our functional in vivo tracking experiments strongly support a key role for CB1 in regulating arterial monocyte recruitment. We can only speculate that stage-dependent differences in chemokine receptor levels may contribute to the inverse patterns of monocyte blood counts between Cnr1-deficient and control mice at advanced stages of atherosclerosis. Consistent with this, it has been shown previously that aortic chemokine and chemokine receptor mRNA levels, as well as leucocytes, peak at ∼10 weeks of WD in Apoe−/− mice.40
GO analysis also revealed a regulation of mitochondrial ATP production, which was supported by functional metabolic measurements. It is well documented that pro-inflammatory macrophage polarization leads to suppression of oxidative respiration,41 which was partially blocked by CB1 antagonism. This suggests that LPS induces an acute release of endocannabinoids from macrophages, which activate their own CB1 receptors. The inhibitory effect of the synthetic CB1 agonist ACEA on the macrophage mitochondrial respiration was less pronounced compared to the LPS effect, which may indicate that CB1 signalling alone is not sufficient for metabolic reprograming of macrophages. Another explanation could be that the exogenous agonist is less efficient in changing mitochondrial metabolism compared to endogenously produced ligands in response to LPS stimulation. In this context, it is also noteworthy that mitochondrial CB1 receptors have been identified in the brain and are associated with neuronal energy metabolism.42
Peripheral CB1 antagonism had multiple anti-inflammatory and metabolic effects in our experimental atherosclerosis mouse model, and it is likely that the anti-atherogenic effects are more complex and not solely due to effects on myeloid cells. Nevertheless, we confirmed that key cellular effects including plaque macrophage accumulation, proliferation, and inflammatory polarization observed in myeloid Cnr1-deficient mice can be targeted by chronic treatment with a peripheral CB1 antagonist. Based on these findings and previous reports showing an improvement in metabolic disorders,9,11,13 it is tempting to suggest that peripheral CB1 antagonists hold great promise for the treatment of multimorbid patients with atherosclerosis, obesity and type 2 diabetes.
Regression analysis of transcriptomic plaque data from patients undergoing CEA revealed an inverse correlation between CNR1 expression and markers of proliferation, oxidative phosphorylation, and several inflammatory genes. These associations may support a direct relationship between CB1 and key cellular pathways in human plaque pathophysiology. Based on our findings in the mouse model and in vitro experiments in BMDMs, the inverse correlations are in partially opposite to the expected CB1-dependent stimulation of macrophage proliferation and inflammatory phenotype. However, the CNR1 transcript levels were determined by bulk RNAseq analysis of whole human plaques and therefore may not only reflect the CNR1 expression in macrophages, as other cell types, such as endothelial cells and smooth muscle cells also contribute to the total plaque CNR1 expression levels.43,44 In addition, it is possible that chronic CB1 stimulation in inflammatory plaques limits its expression, possibly due to receptor desensitization, as previously described in mice with chronically elevated endocannabinoid levels due to pharmacological inhibition of the metabolizing enzyme monoacylglycerol lipase.45
A limitation of our study is that we only focused on the molecular effects of CB1 in monocytes and macrophages in our study. However, we cannot exclude that lack of CB1 signalling in neutrophils may partially contribute to the atheroprotective phenotype in our myeloid Cnr1-deficient mouse model. We did not observe changes in CXCR2 surface expression levels on circulating neutrophils from mice lacking myeloid Cnr1. In addition, the immunostaining analysis of neutrophils within the plaques after 4 weeks of WD did not reveal any difference between the genotypes. Another limitation is the quantification of proliferating plaque macrophages based on CD68 and Ki67 co-immunostaining, as we cannot exclude that some CD68-expressing cells in the plaque were of smooth muscle cell origin. Furthermore, the observed sex-specific differences in macrophage phenotypes, both in experimental atherosclerosis in vivo and in BMDMs in vitro, deserve further investigation in follow-up studies. For example, it will be interesting to study the phenotype of macrophages in aged or ovariectomized female mice. We have provided at least pharmacological in vitro and in vivo evidence for a contribution of oestrogen-ERα signalling to the sex-specific effects observed in macrophage proliferation. Elucidation of the underlying mechanisms, which are likely to be more complex than solely attributable to female sex hormones,46,47 should be addressed in appropriate experimental models such as the ‘four core genotypes’ (FCG) mouse model.48 Similarly, the investigation of sexual dimorphism in clinical studies certainly deserves more attention in the future. Sexual dimorphisms have been reported in several inflammatory responses and diseases, some of which show a higher prevalence in women, such as autoimmune diseases, while others are more pronounced in men.47 However, not only the susceptibility to a particular inflammatory disease but also the efficacy of therapeutic strategies may dependent on sex, as demonstrated in this experimental study.
In conclusion, our data suggest that inhibition of CB1 signalling in monocytes and macrophages has multiple atheroprotective effects: CB1 blockade inhibits the recruitment of monocytes to atherosclerotic plaques and attenuates local proliferation of plaque macrophages, and it reduces inflammatory cytokine release, oxLDL uptake, and improves mitochondrial oxidative respiration. The biological function of CB1 signalling in macrophages appears to be partly sex-dependent, with a more pronounced pro-atherosclerotic role of myeloid CB1 in male mice, which appears to be less relevant in female mice. It further highlights the need to consider the biological sex as an important variable in pre-clinical studies. The clinical relevance of a sex-specific effect of CB1 signalling in monocytes and macrophages deserves further investigation.
Supplementary material
Supplementary material is available at Cardiovascular Research online.
Authors’ contributions
Y.W. carried out experiments, analysed data, and drafted figures; G.L. performed bioinformatic RNAseq data analyses; B.C., G.S., M.G., and M.V. contributed to the in vivo experiments and data analysis; E.P.C.v.d.V. and S.L.M. provided the kinase activity data; C.M. and A.B. contributed to the extracellular flux analysis; M.N.J. contributed to the plaque LCM; Z.L., J.W., N.S., and L.M. provided human plaque data and related statistical analyses; M.H. performed flow cytometric cell sorting, M.L. provided support and advice for RNAseq experiments and bioinformatic analyses; B.L. provided floxed Cnr1 mice; C.W. provided critical infrastructure and funding; S.H., R.G.P., and S.S. designed and supervised the study and planned experiments; R.G.P. and S.S. reviewed data, wrote, and revised the manuscript. All authors reviewed, edited, and approved the manuscript.
Acknowledgements
We are grateful to Seray Anak, Yvonne Jansen, and Soloyamaa Bayasgalan for excellent support with histological analyses and genotyping, and to the entire ZVH animal facility team for their continuous support. The graphical summary was created with BioRender.com.
Funding
The authors received funds from the Deutsche Forschungsgemeinschaft (STE1053/6-1, STE1053/8-1 to S.S. and SFB1123 to S.S., C.W., A.B., M.N.J., and L.M.), the Federal Ministry of Education and Research (BMBF) (DZHK FKZ 81Z0600205 to S.S., 81Z0600103 to S.H., and 81X1600203 to A.B.), the LMU Medical Faculty FöFoLe program (1061 to R.G.P. and 44/2016 to M.V.), the Interdisciplinary Center for Clinical Research within the faculty of Medicine at the RWTH Aachen University (to E.P.C.v.d.V.), the Fritz Thyssen Stiftung (grant no. 10.20.2.043MN to E.P.C.v.d.V.). Y.W., B.C., and G.L. were supported by the Chinese Scholar Council (CSC 201908080123 to Y.W.; 201908440429 to B.C. and 202006380058 to G.L.).
Data availability
The RNA sequencing data are accessible under GEO accession number GSE249503.
References
Author notes
Raquel Guillamat Prats and Sabine Steffens Co-last authors.
Conflict of interest: none declared.
