


Abstract
Fibrinogen conversion into insoluble fibrin and the formation of a stable clot is the final step of the coagulation cascade. Fibrin clot porosity and its susceptibility to plasmin-mediated lysis are the key fibrin measures, describing the properties of clots prepared ex vivo from citrated plasma. Cardiovascular disease (CVD), referring to coronary heart disease, heart failure, stroke, and hypertension, has been shown to be associated with the formation of dense fibrin networks that are relatively resistant to lysis. Denser fibrin mesh characterized acute patients at the onset of myocardial infarction or ischaemic stroke, while hypofibrinolysis has been identified as a persistent fibrin feature in patients following thrombotic events or in those with stable coronary artery disease. Traditional cardiovascular risk factors, such as smoking, diabetes mellitus, hyperlipidaemia, obesity, and hypertension, have also been linked with unfavourably altered fibrin clot properties, while some lifestyle modifications and pharmacological treatment, in particular statins and anticoagulants, may improve fibrin structure and function. Prospective studies have suggested that prothrombotic fibrin clot phenotype can predict cardiovascular events in short- and long-term follow-ups. Mutations and splice variants of the fibrinogen molecule that have been proved to be associated with thrombophilia or increased cardiovascular risk, along with fibrinogen post-translational modifications, prothrombotic state, inflammation, platelet activation, and neutrophil extracellular traps formation, contribute also to prothrombotic fibrin clot phenotype. Moreover, about 500 clot-bound proteins have been identified within plasma fibrin clots, including fibronectin, α2-antiplasmin, factor XIII, complement component C3, and histidine-rich glycoprotein. This review summarizes the current knowledge on the mechanisms underlying unfavourable fibrin clot properties and their implications in CVD and its thrombo-embolic manifestations.
This manuscript was handled by Reviews Deputy Editor Ali J. Marian
1. Introduction
Cardiovascular disease (CVD), comprising coronary heart disease (CHD), heart failure (HF), stroke, and hypertension, remains the leading cause of mortality and hospitalization worldwide. Based on the NHANES data, the prevalence of CVD in the USA in individuals older than 20 years is 49.2% and 9.3% excluding hypertension.1 CVD prevalence increases with age from about 1% of the population aged 20–39 years up to 42.9% of males and 31.3% of females aged ≥80 years, excluding hypertension. The leading cause of CVD death in 2019 was CHD, accounting for 41.3% of deaths, followed by stroke in 17.2%, high blood pressure in 11.7%, HF in 9.9%, and arterial diseases in 2.8% of deaths.
Atherosclerosis underlies the vast majority of CVD.2 A chronic, low-grade systemic inflammation is considered as a critical factor associated with CVD with a major involvement of cellular senescence, cellular debris deposition, microbiome composition, and clonal haematopoiesis of indeterminate potential, genetic, and epigenetic components. Several studies linked increased fibrinogen levels, reflecting the effect of chronic inflammation, with increased risk of CHD and stroke [hazard ratio (HR) = 1.78, 95% confidence interval (CI) 1.19–2.66 per 1 g/L increase in plasma fibrinogen concentrations];3,4 however, a Mendelian randomization study revealed no causal effect of fibrinogen on CVD.5
Conversion of circulating fibrinogen into insoluble fibrin and formation of a stable clot is the final step of the coagulation cascade, reflecting the natural ability of the organism to stop bleeding after injury. Fibrinogen, synthesized in the liver, circulates in blood at concentrations of 2–4 g/L. Human fibrinogen is a 340 kDa glycoprotein composed of three paired polypeptide chains Aα, Bβ, and γ (Figure 1). The six subunits are held together by 29 disulphide bonds in the central nodule of the fibrinogen molecule. Fibrinogen is composed of three main regions connected by α-helical coils, including a central E region containing the N-termini of all polypeptide chains and two outer D regions that comprise the C-termini of Bβ and γ chains (D-E-D; Figure 1). The C-terminal region of the Aα chain forms a globular structure located near the central E region. Thrombin specifically cleaves two fibrinopeptides A (FpA) from the N-termini of fibrinogen Aα chains, resulting in the formation of desA-fibrin monomer with exposed binding sites.6 The release of fibrinopeptides B (FpB) from the N-termini of the Bβ chains is not required for fibrin polymerization and takes place at a slower rate.6 Fibrin monomers polymerize via non-covalent interactions between the D and E regions with subsequent lateral aggregation promoted mainly by interactions of α–α chains and α–γ chains (Figure 1).6 A half-staggered fibrin forms a twisted protofibril. Lateral aggregation of double-stranded fibrin oligomers (20–25 mer protofibrils) and formation of thicker fibrin fibres is probably associated with FpB release; however, this mechanism has not been fully understood and merits further investigation. Branching is strictly required for the formation of a three-dimensional fibrin structure and a higher number of branch points is usually associated with shorter fibre segments between them.6 It should be noted that fibrin has a unique extensibility and single fibres can be elongated by 300–400% before rupture.7
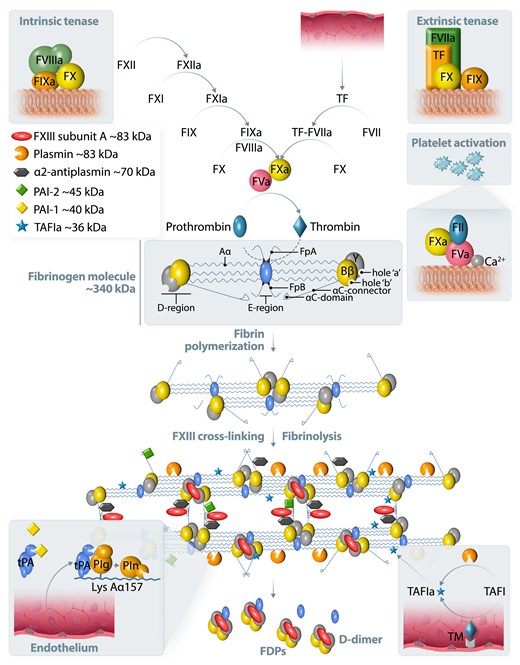
A simplified scheme of blood coagulation, fibrin formation, and fibrinolysis. Tissue factor (TF) is a trans-membrane glycoprotein present in the sub-endothelial tissue and fibroblasts. TF is not exposed to blood until the disruption of the vessel wall. TF binds to factor (F)VIIa and this complex promotes the conversion of FX to FXa (extrinsic tenase). The intrinsic pathway is induced by the activation of FXII on negatively charged surfaces followed by FXI, FIX, and finally FX activation. FIXa with its cofactor FVIIIa forms a tenase complex (intrinsic tenase), activating FX. The prothrombinase complex on activated platelets converts prothrombin (FII) to thrombin, which is a critical step in blood coagulation, preceding fibrinogen conversion to fibrin. The cleavage of fibrinopeptide A (FpA) from the fibrinogen Aα-chain exposes an N-terminal four peptide sequence, Gly-Pro-Arg-Pro (knob ‘A’). Similarly, the cleavage of FpB from the fibrinogen Bβ-chain exposes the Gly-His-Arg-Pro peptide sequence (knob ‘B’). These knobs are complementary to sequences known as hole ‘a’ and hole ‘b’ in the γ- and β-nodules of other fibrin molecules. Fibrin resistance to enzymatic degradation is limited by cross-linking by activated FXIII subunit A (Figure 1). Tissue- and urokinase-type plasminogen activators (tPA and uPA) convert plasminogen to plasmin. Plasminogen activator inhibitor type 1 (PAI-1) inhibits plasminogen conversion. tPA released from endothelium binds to fibrin and facilitates plasminogen binding, preferentially to lysine residues on the partially cleaved Aα chain. α2-antiplasmin, PAI-2, thrombin-activatable fibrinolysis inhibitor (TAFI) activated by a complex of thrombomodulin (TM) and thrombin inhibit fibrinolysis by inactivation of plasmin, tPA, or cleavage of lysine resides, respectively. Fibrin degradation products (FDPs) contain D-dimer as a known marker of ongoing fibrinolysis. Fibrin turnover occurs physiologically.
Fibrin resistance to degradation by plasmin is determined mainly by covalent cross-linking, mediated by activated factor (F)XIII, which catalyses the formation of covalent bonds between γ–γ, γ–α, and α–α chains (Figure 1).6 Tissue- and urokinase-type plasminogen activators (tPA and uPA) convert plasminogen to plasmin and this process is controlled by plasminogen activator inhibitor type 1 (PAI-1). Enhanced PAI-1 release from platelets, endothelium, hepatocytes, and adipocytes directly inhibits plasminogen conversion into plasmin in circulating blood. Increased PAI-1 levels occur in CVD.8 In meta-analysis of the available studies, PAI-1 antigen levels, but not activity, were higher by 6.11 ng/mL (95% CI, 3.27–8.96 ng/mL) in patients with major adverse cardiac events than in controls.9
The catalytic efficiency of plasminogen activation by tPA, but not uPA, is greater in the presence of fibrin as a ternary complex than in the presence of fibrinogen. tPA binds to fibrin by a finger domain followed by a conformational change facilitating plasminogen binding (Figure 1).10
Increased incorporation of antifibrinolytic proteins into the fibrin mesh, such as α2-antiplasmin, PAI-2, TAFI, or complement component C3 lead to hypofibrinolysis via different mechanisms (Figure 1).11 α2-Antiplasmin and PAI-2 are cross-linked to fibrin and directly inhibit plasmin or tPA, respectively. TAFI, activated by thrombomodulin, cleaves off C-terminal lysine residues of fibrin, which are required for the binding of tPA and plasminogen.11
Data indicating associations between higher fibrinogen levels and increased CVD risk are inconsistent; however, fibrinogen definitely remains a valuable biomarker used in routine clinical practice.12 Thirty years ago it was postulated that not fibrinogen itself, but fibrin clot structure and function are involved in the development, progression, and thrombotic manifestations of CVD. This review summarizes the current knowledge on fibrin clot properties in the context of CVD and its therapy.
2. Assessment of fibrin clot properties
Impaired fibrin clot properties, such as fibrin network architecture, susceptibility to fibrinolysis, and biomechanical properties have been shown to be associated with a history of thrombo-embolism or recurrent events in case-control studies as well as with poor outcomes in a few large prospective trials.13–16 There are several laboratory assays to evaluate fibrin clot structure and function; however, most of them are not standardized and unavailable for routine laboratory assessment (Table 1).17 Plasma clotting is usually initiated using different concentrations of exogenous thrombin or tissue factor (TF), whereas in purified models thrombin is used to convert fibrinogen into fibrin.
A summary of laboratory issues of standardized protocols for fibrin clot permeability (Ks) and CLT assessment
| Assay | Fibrin clot permeability | Common modifications | CLT | Common modifications |
|---|---|---|---|---|
| Sample | Citrated plasma | Plasma supplemented with RBCs or other cells | Citrated plasma | |
| Sample dilution | 10:1 | 1:1, 1:4 | 3.33× | 2–6× |
| Coagulation trigger | Human thrombin (1 NIH U/mL), CaCl2 (20 mM) | TF instead of thrombin, thrombin at a concentration of 0.1 NIH U/mL | Human thrombin (0.5 NIH U/mL), CaCl2 (15 mM), tPA (dose adjusted: 20–40 ng/mL to achieve CLT about 100 min), phospholipids (10 µM) | TF (0.6–6 pM) instead of thrombin; thrombin at a concentration of 0.03 NIH U/mL; tPA (for lysis assays) at a concentration of 56–83 ng/mL; lack of phospholipids |
| Technical aspects | Requires quick but accurate manual pipetting and much hands-on experience (2–3 s pipette mixing before putting clotting sample into the clot tube); avoiding air bubbles within the clot | Requires manual pipetting | ||
| Temperature | Room temperature | 37°C | ||
| Equipment | Self-designed equipment | Commercially available slides for perfusion assays | 96-well plate reader with a 405 nm filter | 340 nm filter |
| Variability | 3-day mean: 3.1–22% (min–max values), median, 8% | <12% | 3.4–13.6% (min–max values), median, 7.7% | 7–14% for lysis time |
| Main factors affecting results | Age, triglycerides, fibrinogen, C-reactive protein | Genetic polymorphisms, H3cit, GDF-15, antithrombin activity/antigen, HDL-C, glucose, Hcy, platelet-derived factors, use of aspirin, statin, or anticoagulants | PAI-1, TAFI, HRG | Genetic polymorphisms, sex, triglycerides, apolipoproteins, lipoprotein(a), α2-antiplasmin, fibrinogen, γ′-fibrinogen, use of aspirin, statin, or anticoagulants |
| Main application | Prothrombotic or bleeding tendency | VTE, CVD, metabolic syndrome/diabetes, inflammatory states, infectious diseases | Hypofibrinolysis or hyperfibrinolysis (VTE, cancer, bleeding) | CVD, metabolic syndrome/diabetes, inflammatory states, infectious diseases |
| Limitations | Research use Permeability range depending on the home-made equipment Hands-on experience required to obtain reproducible results Time-consuming (requires clot washing before Ks measurement) | Semi-automatization can shorten measurement time | Research use Methodological, equipment, and reagent differences contribute significantly to the outcome Data normalization necessary to compare results between laboratories |
CLT, clot lysis time; CVD, cardiovascular disease; GDF-15, growth-differentiation factor 15; H3cit, citrullinated histone H3; HDL-C, high-density lipoprotein cholesterol; HRG, histidine-rich glycoprotein; NIH, National Institutes of Health; PAI-1, plasminogen activator inhibitor type-1; TAFI, thrombin-activatable fibrinolysis inhibitor; TF, tissue factor; tPA, tissue plasminogen activator; VTE, venous thrombo-embolism.
The liquid permeability of a fibrin clot (Ks or Darcy’s constant), which reflects an average pore size within the fibrin network based on the volume of a buffer flowing through a fibrin gel in time, represents a key measure of fibrin network structure (Figure 2A).18 A lower Ks indicates a more compact and less permeable fibrin meshwork. This measure usually correlates well with a pore size assessed by confocal or scanning electron microscopy (SEM; Figure2B and C).18 SEM is the most commonly used method to study fibrin clot nanostructure.19 Investigation of the fibrin clot structure with different imaging techniques showed that the structure of hydrated clots observed using confocal microscopy is highly analogous to clot structure visualized by SEM.20 However, the diameter of fibrin fibres visualized using confocal microscope is sometimes 2–4 times larger than that on SEM,21 depending on the aggregation of fibrin monomers during protofibril formation.22 Frequently, there is a positive association between the mean fibrin fibre diameter on imaging and clot permeability. Denser fibrin clots are typically more resistant to lytic agents; therefore, analysis of clot permeability is supplemented by a number of lysis assays induced most commonly by varying concentrations of recombinant tPA with the use of different protocols based on turbidimetric measurements (Figure 2D) or real-time monitoring of changes in fibrin clot structure and movement of the lysis front on confocal microscopy (Figure 2E). Despite positive correlations between results of various lysis assays, they cannot be interchangeable.23 Functions of fibrin clot also reflect its biomechanical properties that can provide additional information on the propensity to fibrin clot to rupture and fragmentation leading to distal embolization.15
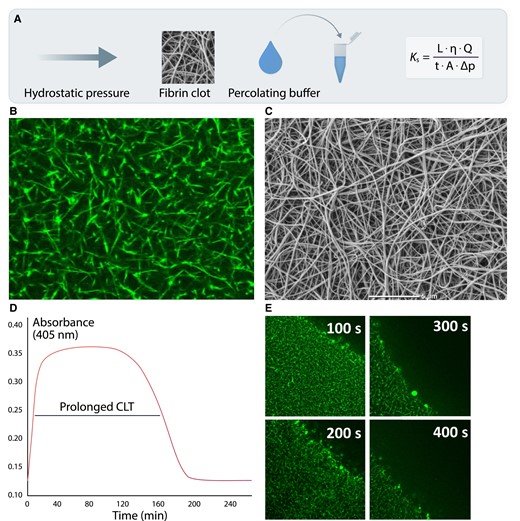
Common measures describing fibrin clot structure and function. A key measure reflecting an average pore size within a fibrin network, based on hydraulic conductivity is clot permeability or permeation (Ks; panel A). Q denotes the flow rate; L, the length of a fibrin gel; µ, the viscosity of liquid (in poise); A, the cross-sectional area (in cm2), Δp, a differential pressure (in dyne/cm2), and t the percolating time. Reduced Ks as a typical feature of the prothrombotic fibrin clot phenotype is usually associated with lower fibrin fibre diameter, lower pore size, and increased number of fibrin branch points visualized using confocal (panel B) and scanning electron microscopy (panel C). Faster fibrinogen polymerization results in the formation of a denser fibrin network (higher clot turbidity), which is relatively resistant to fibrinolysis as reflected by prolonged clot lysis time (CLT; panel D), or real-time clot lysis assessed using confocal microscopy (panel E).
The subcommittee on Factor XIII and Fibrinogen of the International Society on Thrombosis and Haemostasis (ISTH) performed two international studies on the feasibility of standardized assays for assessment of Ks, clot turbidity, and lysis, and concluded that both methods have a potential as future diagnostic tools.24,25 For example, in the clot lysis tests, several factors, such as fibrinolysis inhibitors, fibrinogen, or C-reactive protein, can affect the results, depending on the method used (type of coagulation activator, proportion of plasma, concentration of tPA, etc.).26 Similar observations were made for Ks measurement, where the choice of a clotting trigger can affect the results.16 Therefore, use of specific assays to evaluate fibrin clot properties significantly influences the presence and magnitude of differences observed in various disease states, including CVD.
It is still unknown whether plasma fibrin clot properties change over time. In apparently healthy black South Africans, clot lysis time (CLT) was prolonged by 7.3% (assay variability 3.6–4.5%) over a 10-year period and this change was determined by female gender, increasing age, obesity, increased low-density lipoprotein cholesterol (LDL-C) levels, and hyperglycaemia.27
Thromboelastography (TEG®; Haemonetics, Braintree, MA) and rotational thromboelastography (ROTEM®; TEM International, Munich, Germany) served as the point of care (POC) tests to assess viscoelastic properties of the whole blood clot, including clot formation and fibrinolysis in a real time and triggered by various reagents.28 Other POC tests, such as the Global Thrombosis Test (GTT®; Thromboquest Limited, Kent, UK) and the Total Thrombus-Formation Analysis System (T-TAS®, Fujimori Kogyo Co., Tokyo, Japan) allow for assessment of whole blood clot occlusion time under shear stress.29 The latter approach was also designed to evaluate thrombus formation in the presence of collagen, required for platelet activation and TF for coagulation activation.
3. Mechanisms of fibrin clot properties modulation
3.1 Proteins binding to fibrinogen/fibrin
Fibrinogen is a highly interactive (‘sticky’) protein that can bind many different binding partners. Twenty years ago, only a few proteins that bind to fibrinogen and modulate fibrin clot structure and function had been described, including decorin, platelet factor 4 (PF4), apolipoprotein(a), and fibroblast growth factor 2.30 More recent data strongly support the concept that the interaction of other proteins with fibrin is not a passive process and may involve the interplay of more than one binding partner. For example, FXIII catalyses the interactions of PAI-1, α2-antiplasmin, fibronectin, vitronectin, thrombospondin, collagen, and other proteins with fibrin, each of which may influence clot susceptibility for degradation and/or clot mechanical properties.31 About 500 clot-bound proteins have been identified within washed clots prepared from plasma obtained from healthy subjects, with the highest relative amounts for fibrinogen (about 64% of the clot mass), fibronectin (13%), α2-antiplasmin (2.7%), FXIII (1.2%), complement component C3 (1.2%), and histidine-rich glycoprotein (HRG) (0.61%).32 Proteins present at relative concentrations of <0.5% in the fibrin clot included (pro)thrombin, plasminogen, apolipoproteins, and PF4. A detailed analysis of fibrin clot proteome performed in patients with acute pulmonary embolism compared with healthy controls revealed higher clot-bound amounts of fibrinogen chains, apolipoprotein B-100, or histones H3 and H4 and reduced amounts of α2-antiplasmin, α2-macroglobulin, antithrombin, or plasminogen.33 Moreover, low Ks was associated with increased clot-bound amounts of C-reactive protein, kininogen-1, protein S, β-2-microglobulin, and thromboxane-A synthase.
Available data indicate that multiple clinical factors and laboratory parameters affect fibrin clot properties, including proteins unrelated to the coagulation system. These observations underline how complex the process of thrombosis is and how many mechanisms are engaged in its regulation. Further studies, however, are needed to evaluate to what extent particular proteins can modify fibrin clot properties and modulate the thrombotic risk.
3.1.1 Thrombin
Thrombin is a key enzyme that converts fibrinogen into fibrin and the rate of thrombin generation during coagulation activation can determine fibrin ultrastructure (Figure 3).34 Elevated concentrations of prothrombin, which is activated by FXa in the prothrombinase complex, were associated with the formation of thinner and densely packed fibrin fibres.35 Therefore, medications attenuating thrombin generation (vitamin K antagonists (VKAs), heparins) or directly inhibiting thrombin (dabigatran) favourably modified fibrin clot structure and function (Table 2).
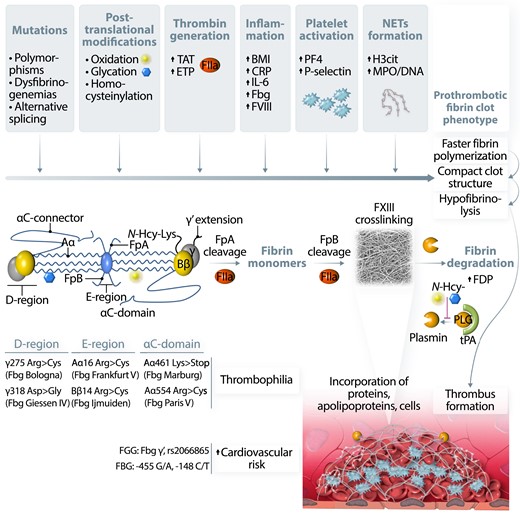
Factors and potential mechanisms involved in fibrinogen and fibrin modulation leading to prothrombotic fibrin clot phenotype. Fibrinogen (Fbg) molecule alterations, including common polymorphisms and mutations, were identified in all structural regions of this protein. Fbg is prone to post-translational modifications such as oxidation, glycation, or homocysteinylation. All these factors can influence Fbg conformation and lead to altered polymerization, resulting in the formation of dense, poorly permeable, and resistant to lysis fibrin networks, known as a prothrombotic fibrin clot phenotype. Increased prothrombin conversion to thrombin (FIIa), reflected in vivo by higher levels of thrombin–antithrombin (TAT) complex or ex vivo by increased endogenous thrombin potential (ETP) were also associated with unfavourably modified fibrin properties, probably by influencing the rate of fibrinopeptide A and B cleavage, resulting in the formation of denser fibrin clots composed of thinner fibres. Moreover, FIIa activates platelets and protein C anticoagulant systems, and inhibits fibrinolysis. Incorporation of cellular components into the fibrin network as well as binding of different proteins to fibrin by covalent and non-covalent interactions can additionally modify fibrin clot properties, especially when related to acute or chronic proinflammatory conditions. Cross-linking by factor XIII (FXIII) stabilizes fibrin structure and catalyses binding of several proteins into fibrin network. Increased body mass index (BMI) and higher levels of C-reactive protein, interleukin-6 (IL-6), or factor VIII (FVIII) were reported to be associated with prothrombotic fibrin clot phenotype in obese subjects, patients with atherosclerotic vascular disease, or individuals following venous thrombo-embolism. Release of platelet factors, such as platelet factor 4 (PF4) or P-selectin during acute thrombotic events, was also associated with the formation of dense fibrin structure resistant to enzymatic degradation. Recent data underlined an important role of neutrophil extracellular traps (NETs) formation, reflected by higher plasma levels of citrullinated histones H3 (H3cit) or myeloperoxidase (MPO)-DNA complexes in modulation of fibrin clot phenotype into more prothrombotic in acute states, such as myocardial infarction or pulmonary embolism as well as in patients with diabetes or atrial fibrillation. Faster fibrin polymerization is associated with the formation of dense and compact fibrin networks, which limits the accessibility of fibrinolytic factors. However, fibrinolysis can be limited by increased levels of plasminogen (PLG) inhibitors such as PLG activator inhibitor type 1 (PAI-1) or decreased levels of fibrinolysis activators, including tissue PLG activator (tPA). PLG conversion to plasmin is additionally inhibited by post-translational modifications of this protein, leading to a disturbed balance between coagulation and fibrinolysis during a proinflammatory state. Increased fibrin formation leads to subsequent fibrinolysis and generation of different fibrinogen degradation products (FDP), which may be incorporated into clots/thrombi altering their properties.
Reported effects of therapeutic interventions on fibrin clot properties
| Treatment | Study design | Effect | Reference |
|---|---|---|---|
| Aspirin | Healthy volunteers (n = 15) receiving aspirin (low dose, medium dose, and a single high dose) | ↑↑ Ks (low dose) ↑ Ks (medium and high dose) | 36 |
| Chinese hamster ovary cell lines transfected with fibrinogen grown in the absence and presence of aspirin/volunteers taking 150 mg aspirin daily for 1 week | ↑ clot turbidity, ↑ Ks, ↑ fibrin thickness, ↓ clot rigidity, and ↓ clot lysis | 37 | |
| Statin | Randomized double-blind study, advanced CAD males treated with simvastatin 40 mg per day (n = 13) and atorvastatin 40 mg per day (n = 12) | ↑ Ks, ↑ clot maximum absorbancy, ↓ lysis time | 38 |
| Prospective cohort study, 30 patients with no history of cardiovascular events assessed prior and after 3-month treatment with simvastatin (40 mg/d) | ↑ Ks, ↓CLT in subjects with LDL-C < 3.4 mmol/L associated with a reduction of C-reactive protein levels | 39 | |
| First-ever VTE patients (n = 28) and well-matched controls without history of VTE (n = 25) | ↑ Ks, ↑ lag phase, ↓ maximum absorbance, ↓ time to 50% lysis, ↓ CLT | 40 | |
| Prospective cohort study, advanced CAD patients (n = 130) on standard statin treatment and after 6–12 months of high-dose statin treatment (atorvastatin 80 mg/d or rosuvastatin 40 mg/d) | ↑ Ks, ↓ CLT in patients on the high-dose statin therapy | 41 | |
| Blood pressure lowering therapy | Prospective cohort study, 61 patients with essential hypertension stage 1 or 2 | ↑ Ks, ↓ lysis time, and ↓ maximal D-dimer levels released from clots | 42 |
| Antidiabetic therapy | The in vitro effect of metformin on fibrin clot properties | ↓ lysis time | 43 |
| The effect of insulin infusion before and after 4–6 months’ treatment of type 1 diabetes patients (n = 28) | ↑ Ks, ↑ fibre mass–length ratio | 44 | |
| Administration of folic acid | Healthy men (n = 76), advanced CAD males on aspirin (n = 33), DM patients (n = 16), and patients with hypercholesterolaemia (n = 15) | ↑ Ks, ↓ lysis time in 20 asymptomatic men with hyperhomocysteinaemia | 45 |
| Polyunsaturated omega-3 fatty acids | Prospective, double-blind, placebo-controlled, randomized study on stable CAD patients (n = 54) | ↑ Ks, ↓ lysis time | 46 |
| Anticoagulants (VKAs, heparins, fondaparinux, DOACs) | In vitro effect of dabigatran on fibrin clot properties | ↓ lysis time, ↓ clot rigidity, ↑ fibrin fibres thickness | 47 |
| In vitro effects of apixaban, fondaparinux, and warfarin on fibrin clot porosity | ↑ Ks | 48 | |
| AF patients (n = 40) at the beginning of anticoagulant therapy with VKA | ↑ Ks, ↓ CLT after 3 days of VKA administration | 49 | |
| Patients following VTE before and during treatment with rivaroxaban (34 prothrombin mutation carriers and 34 non-carriers) | ↑ Ks, ↓ CLT after rivaroxaban intake | 50 | |
| Effects of rivaroxaban and apixaban on fibrinolysis using patients’ plasma, normal pooled plasma, and purified proteins | ↓ lysis time | 51 | |
| Plasma clots of 46 acute PE patients treated with 1 mg/kg bid enoxaparin | ↑ Ks, ↓ CLT | 52 | |
| Plasma spiked with rivaroxaban, apixaban, or enoxaparin, plasma from patients on warfarin | ↑ lag time, ↑ Ks depending on clotting activator | 53 |
AF, atrial fibrillation; CAD, coronary artery disease; CLT, clot lysis time; DM, diabetes mellitus; DOACs, direct oral anticoagulants; Ks, fibrin clot permeability; LDL-C, low-density lipoprotein cholesterol; PE, pulmonary embolism; VKA, vitamin K antagonist; VTE, venous thrombo-embolism.
3.1.2 Platelet activation
Increased platelet activation has been shown to unfavourably modify fibrin clot structure and function (Figure 3) at least in part by releasing proteins stored in alpha-granules, such as beta-thromboglobulin or PF4 in patients with advanced atherosclerosis.54 P-selectin and PF4 exerted a similar effect on fibrin clot properties in diabetic patients with high cardiovascular risk.55 Platelet activation per se also resulted in the formation of stable clots, which are resistant to fibrinolysis.56 Platelet activation increases thrombin generation, through the assembly of tenase and prothrombinase complexes on the activated platelet membrane, which subsequently increases local fibrin clot density and stability as discussed above. Treatment with aspirin improved fibrin clot properties in stable coronary artery disease (CAD) patients,57 whereas aspirin withdrawal for two weeks was associated with reduced Ks by about 40% compared with values observed on treatment.58
Polyphosphates, linear polymers of 60–100 phosphate residues, from platelet dense granules act as FXII-driven contact pathway activators. Moreover, polyphosphates accelerate FV activation, enhance FXI activation, inhibit tissue factor pathway inhibitor, and render fibres thicker leading to poorly permeable clots.59,60 Polyphosphates attenuate also the binding of tPA and plasminogen to fibrin, which contributes to hypofibrinolysis.60
Platelets upon activation also release a2-antiplasmin, TAFI, and HRG, which negatively affect fibrin clot properties.
Importantly, platelet aggregation requires fibrinogen binding to its receptor glycoprotein IIb/IIIa (GPIIb/IIIa). Fibrin-platelet connections provide force transmission during clot contraction61 and, therefore, are considered as potential therapeutic targets, especially during acute thrombosis.62,63
3.1.3 Inflammation
Chronic inflammation especially driven by elevated IL-6, as evidenced in patients with autoimmune diseases, e.g. rheumatoid arthritis or in those with chronic obstructive pulmonary disease, all considered CVD-related conditions, largely contributes to the formation of denser fibrin networks, composed of matted fibrin fibres that are more resistant to lysis compared with controls (Figure 3).64–69 C-reactive protein and IL-6 levels showed inverse associations with Ks, while C-reactive protein was positively associated with time to half lysis in patients following myocardial infarction (MI).38,70
In septic shock patients, a complete lysis resistance of plasma clots has been noted, which was associated with reduced plasminogen activity, increased PAI-1, and lactate levels.71
A compact fibrin clot structure and hypofibrinolysis have been observed in patients with COVID-19.72 COVID-19 patients compared with patients with severe acute respiratory distress syndrome related to the influenza virus had elevated fibrinogen levels and accelerated FXII activation, which in mechanistic experiments led to the formation of compact fibrin clots composed of thin fibres with pronounced resistance to fibrinolysis, supported by higher levels of TAFI and PAI-1.73 Of note, acute systemic inflammation has been shown to enhance PAI-1 synthesis in adipose tissue, directly linking inflammation and hypofibrinolysis.74 Anti-inflammatory effects of aspirin or statins are associated with the formation of less compact fibrin clots (Table 2).
Neutrophil extracellular traps (NETs) are extracellular networks released from neutrophils and composed of histones, cell-free DNA, and granular enzymes (Figure 3). Increased concentrations of histones markedly impaired fibrinolysis in vitro.75 Clot permeability of plasma clots was reduced by about 50% in the presence of DNA or histones.76 The antifibrinolytic effect of DNA alone might be associated with impaired plasmin binding to fibrin due to increased affinity of plasminogen to DNA with no influence on plasmin inhibitors. Moreover, NETs retard the tPA-dependent digestion of plasma clots.76
NETs components have been identified within thrombi retrieved during interventional treatment from patients with acute MI (AMI), stroke, and peripheral arterial disease (PAD).77–80
In atrial fibrillation (AF) patients followed for a median time of 53 months, ischaemic cerebrovascular events occurred in subjects who had higher citrullinated histone H3 (H3cit) and myeloperoxidase (MPO) levels at baseline, and both Ks and CLT were weakly associated with H3cit, which explained about 5% of their variance.81 Increased levels of NETs markers, which were associated with enhanced inflammation, prothrombotic state, and hypofibrinolysis, were found in type 2 diabetes mellitus (DM) patients following MI compared with those without previous MI.82 The available data suggest that a combination of DNases with thrombolytic agents may offer a promising tool for more efficient thrombolysis at least in a subset of patients with acute thrombosis.
3.2 Fibrinogen alterations
3.2.1 Mutations, splice variation, and polymorphisms
Congenital fibrinogen disorders include quantitative (afibrinogenaemia and hypofibrinogenaemia) and qualitative (dysfibrinogenaemia and hypodysfibrinogenaemia) abnormalities. There are several point mutations in fibrinogen Aα, Bβ, and γ chains, most commonly in the N-terminal region of the Aα chain or C-terminal region of the γ chain causing dysfibrinogenemia. In 25% of cases, dysfibrinogenemia manifests as thrombosis (Figure 3).83 It has been reported that some dysfibrinogenaemic patients with a thrombotic history have markedly abnormal fibrin clot structure and defective lysis, for example, in fibrinogen Caracas V, Dusart, and Naples.84–86 Dysfibrinogenaemia can lead to arterial thrombosis at a young age.87
Fibrinogen splice variations and polymorphisms such as FGG γ′ or rs2066865 and FGB −455 G/A or −148 C/T have been linked with an increased risk of thrombosis or CVD risk (Figure 3).12 About 12% (range 3–40%) of total plasma fibrinogen contains γ′ chain, a common fibrinogen splice variant with an additional high-affinity binding site for thrombin, circulating as γA/γ′ heterodimer or γ′/γ′ homodimer (<1% of total fibrinogen). An increase in fibrinogen γ′ may contribute to the development of CVD.88 It has been shown that fibrinogen γ′ directly and independently of thrombin modulates fibrin polymerization, leading to the formation of mechanically weaker clots composed of fibres with reduced protofibril packing.89,90 Increased γ′ fibrinogen levels have been associated with an increased risk for arterial thrombosis and stroke.91 Fibrinogen γ′ concentrations poorly correlated with total plasma fibrinogen in patients following MI and in population-based controls; however, increased level of γ′ fibrinogen was an independent predictor of MI [odds ratio (OR) = 1.24, 95% CI 1.01–1.52].92 In acute stroke patients, the ratio of fibrinogen γ′ over total fibrinogen was higher in the acute phase than 3 months after the stroke, suggesting altered fibrinogen γ mRNA processing during the acute phase.93,94 A genome-wide association study revealed that fibrinogen γ′ levels corresponded to CVD prevalence.95 In a large cohort of apparently healthy black South Africans, fibrinogen γ′ correlated stronger than total fibrinogen with CLT and was associated with CVD risk factors, such as body mass index (BMI), high-density lipoprotein cholesterol (HDL-C), metabolic syndrome, and C-reactive protein levels, explaining nearly 20% of fibrinogen γ′ variance.96
3.2.2 Post-translational modifications
Post-translational modifications of the fibrinogen molecule such as oxidation, glycation, or homocysteinylation have been shown to affect fibrin clot structure as well as clot formation and lysis (Figure 3); therefore, they can contribute to thrombotic diseases.97
Increased production of reactive oxygen species (ROS) results in protein oxidation and the formation of carbonyl groups or amino acid modification. Fibrinogen is about 20 times more susceptible to such modifications than albumin.97 A variety of fibrinogen oxidative modifications performed in vitro (irradiation, photooxidation, ascorbate/FeCl3, peroxynitrite, HOCl, etc.) as well as higher levels of oxidative stress markers assessed in a few studies in patients with inflammatory and thrombotic disorders or trauma have been associated with decreased clot stiffness, reduced Ks, increased clot density, and mostly with fibrin resistance to fibrinolysis.97–101 Among oxidative stress markers assessed in plasma, such as protein carbonyl or thiobarbituric acid reactive substances and common sources of ROS, including NADPH oxidase activity, especially fibrinogen carbonyl content correlated with altered fibrinogen polymerization and lysis in patients with systemic inflammation and in those following AMI.100 In subjects with acute coronary syndrome, levels of C-reactive protein and a product of lipid cell membrane peroxidation, 8-iso-prostaglandin F2α, were independent predictors of fibrin clot properties.99 Elevated 8-iso-prostaglandin F2α levels measured before and after coronary artery bypass graft were associated with cardiovascular and all-cause mortality.102 In AF patients, increased 8-isoprostane concentrations were associated with reduced Ks and thrombo-embolic events during follow-up (HR = 2.87, 95% CI 1.17–7.03), despite anticoagulant therapy.103
Oxidative modifications of fibrinolytic proteins, particularly of plasminogen, have also been shown to be associated with less effective fibrinolysis in patients following venous thrombosis.104 Data on this modification in CVD are sparse.
Glucose can non-enzymatically bind to proteins altering their function. Glycation occurs at normal blood glucose levels as a consequence of oxidative stress or at higher glucose levels in diabetic patients. Fibrinogen is prone to glycation at lysine residues97 and about two-fold higher fibrinogen glycation has been reported in type 2 DM patients compared with non-diabetic controls.105 Clots formed from fibrinogen purified from type 2 DM patients compared with controls were denser and less porous, and common clot measures, including Ks, fibrin absorbance, number of branch points, and fibrin network density, correlated with HbA1c.106 A similar purified model showed an altered kinetics of fibrin formation resulting in reduced clot susceptibility to fibrinolysis.107
N-homocysteinylation sites on fibrinogen, associated with the formation of denser fibrin structure with reduced susceptibility to fibrinolysis, along with impaired plasminogen activation have been found on lysine residues in the fibrinogen α, β, and γ chains (α-Lys562, β-Lys344, and γ-Lys385).108 Elevated homocysteine levels have been reported to be associated with prothrombotic clot phenotype among CAD patients,45 though the relative impact of this variable in the presence of other potent modulators appears negligible in CVD.
3.2.3 Fibrinogen subregions
To investigate the influence of fibrinogen subregions on fibrin formation, clot structure, and mechanics, different fibrinogen variants have been studied in the past few years. Critical functions of the αC-subregions have been shown using recombinant human fibrinogen α390 (truncated before the αC-domain) and α220 (truncated at the start of the αC-connector).109 Clots prepared with the α390 variant were dense and composed of thinner fibres, whereas the α220 variant was associated with the formation of porous and weak fibrin networks, which might have potential implications as therapeutic targets to reduce the risk of thrombosis. Thrombin-mediated exposure of knobs and holes on fibrin monomers during polymerization of fibrinogens with mutations in ion-pairing residues adjacent to the knob-hole site and involved in the catch-slip behaviour of fibrin bonds has shown how these residues are important for proper fibrin fibre growth and protofibril packing.110
A murine model with eliminated fibrin γ-chain cross-linking by FXIII formed thrombi with reduced strength, which was prone to fragmentation and increased embolization without any effect on clot size or its susceptibility to lysis.111
4. CVD risk factors
Observational studies have provided data indicating that most well-established cardiovascular risk factors are associated with prothrombotic fibrin clot properties (Table 3).
Cardiovascular risk factors in association with fibrin clot properties
| Cardiovascular risk factor | Study design | No. of subjects | Measure | Reference |
|---|---|---|---|---|
| Age | Case-control study | 76 healthy men, 36 advanced CAD patients, 16 DM patients, 15 hypercholesterolaemic subjects | Ks correlated negatively and t50% positively with age in controls (r = −0.3 and r = 0.4), CAD (r = −0.65 and r = 0.49), and DM patients (r = −0.7 and r = 0.59, respectively; all P < 0.05) | 45 |
| Case-control study | 642 controls (and 421 MI patients) | No clear effect on CLT in controls | 112 | |
| Cross-sectional study | 2000 healthy controls | No clear effect on CLT | 113 | |
| Cohort study | 80 healthy controls | ↑ CLT and ↑ Lys50 with increasing age | 23 | |
| Cohort study | 2010 healthy controls | ↑ clot turbidity and ↑ CLT with increasing age | 27 | |
| Obesity | Case-control study | 38 men following MI and 88 age- and sex-matched population-based controls | Ks correlated with BMI in controls (r = −0.27, P < 0.05) | 114 |
| Cohort study | 537 healthy subjects (plasma available for 502 individuals) | Clot maximum absorbance, AUC, and lysis time increased, whereas lysis rate decreased with an increasing number of metabolic syndrome components (all P < 0.0001) | 115 | |
| Cohort study | 1288 healthy subjects, including 292 obese individuals | CLT positively associated with BMI in men (r = 0.42) and women (r = 0.37, both P < 0.0001) | 116 | |
| Family history of CAD | Case-control study | 100 healthy male relatives of patients with premature CAD and 100 healthy controls | ↓ Ks and ↑ clot turbidity in relatives of patients | 117 |
| Diabetes | Case control | 150 patients with type 2 diabetes and 50 controls | ↓ Ks (r = −0.57, P < 0.0001), ↑ clot turbidity (r = 0.33, P < 0.0001), ↑ branch points (r = 0.78, P < 0.0001), ↑ fibrin density (r = 0.63, P < 0.0001) associated with glycated haemoglobin levels | 106 |
| Interventional study | 20 type 2 DM subjects | ↑ Ks after achievement of glycaemic control; Ks associated with glycated haemoglobin levels at baseline (r = −0.63, P =0.038) | 107 | |
| Case-control | 642 controls (and 421 MI patients) | No clear effect on CLT in controls | 112 | |
| Cohort study | 211 type 2 DM patients | ↓ Ks, ↑ CLT, ↑ t50% in patients with DM duration >5 years compared with ≤5 years | 118 | |
| Case-control study | 200 type 2 DM patients and 100 age- and sex-matched controls | ↑ clot maximum absorbance and ↑ lysis time in DM ↓ Ks and ↑ clot maximum absorbance in DM patients with documented CVD compared with those without CVD | 119 | |
| Cross-sectional study | 113 type 2 DM patients | Ks and CLT associated with serum levels of citrullinated H3 histone (r = −0.43 and r = 0.59, respectively) and cell-free DNA (r = −0.31 and r = 0.46, respectively; all P < 0.001) | 82 | |
| Current smoking | Case-control study | 642 controls (and 421 MI patients) | No clear effect on CLT | 112 |
| Case control | 44 male cigarette smokers and 44 non-smokers | ↓ Ks and ↑ CLT | 120 | |
| Cross-sectional study | 2000 healthy controls | No clear effect on CLT | 113 | |
| Case-control study | 34 healthy male smokers and 34 non-smokers | ↑ clot strength, ↑ clot turbidity, ↓ fibrin fibre diameter in smokers | 121 | |
| Cohort study | 30 healthy subjects | No clear effect on CLT | 122 | |
| Ethanol consumption | Placebo-controlled, randomized, cross-over study | 18 males | ↑ CLT noted after 5 h following alcohol consumption | 123 |
| Arterial hypertension | Cohort study | 61 patients with essential arterial hypertension | ↑ Ks, ↓ CLT, ↓ clot resistance to lysis at 6 months of antihypertensive treatment | 42 |
| Hyperlipidaemia | Population-based cohort study | 2010 apparently healthy subjects | ↑ Fibrin maximum absorbance and ↑ CLT associated with higher LDL-C and lower HDL-C levels | 27 |
| Case-control study | 138 severe AS patients and 102 controls with atherosclerotic vascular disease | ↑ CLT associated with total cholesterol, LDL-C, triglycerides, oxLDL, lipoprotein(a) and apolipoprotein B, C-II, C-III, and E. ↑ Lys 50 associated with apolipoprotein A-I, C-II, and C-III | 124 | |
| Cohort study | 30 healthy subjects | LDL-C levels positively associated with CLT | 122 | |
| Case-control study | 24 men with hyperlipidaemia following MI and 52 apparently healthy men | ↓ Ks, ↓ clot maximum absorbance, ↑ CLT associated with elevated plasma lipoprotein(a) | 70 |
AS, aortic stenosis; AUC, area under the curve; BMI, body mass index; CAD, coronary artery disease; CLT, clot lysis time; CVD, cardiovascular disease; DM, diabetes mellitus; HDL-C, high-density lipoprotein cholesterol; Ks, fibrin clot permeability; LDL-C, low-density lipoprotein cholesterol; Lys50, time to 50% lysis; MI, myocardial infarction; oxLDL, oxidized LDL.
4.1 Age
Ks was negatively associated with age in healthy subjects,45 suggesting that typical factors related to increasing age, such as low-grade proinflammatory state and impaired antioxidant ability, can alter fibrin clot structure (Figure 3). Interestingly, in patients with CHD or diabetes, this association was stronger than in controls.45 A similar effect of increasing age on prolonged lysis time has been observed in healthy controls.23 Other reports showed no clear association between age and fibrin clot properties;112,113,125 however, adjustment for demographic factors and fibrinogen levels is routinely used in most studies evaluating fibrin clot structure and function.
4.2 Obesity
A weak negative association of Ks with BMI was reported in healthy subjects but not in patients following MI at young age.114 The EuroCLOT Study has revealed that common measures of fibrin structure and function, particularly clot density and lysis time assessed by clot turbidity measurement, increased substantially with an increasing number of metabolic syndrome components, reflecting higher cardiovascular risk.115 In a large cohort study of 1288 healthy individuals, including 292 obese subjects, BMI and total body fat were positively associated with CLT in both men and women.116 Hypofibrinolysis in obese individuals is driven at least in part by increased PAI-1 levels, since adipose tissue is an additional source of PAI-1.126
4.3 Family history of CVD
Family history of CAD may also affect clot properties, suggesting an effect of still poorly defined genetic factors. Mills et al.117 have shown that male relatives of CAD patients are characterized by faster fibrin polymerization and reduced Ks compared with age-matched control subjects.
4.4 Diabetes
DM is a well-established cardiovascular risk factor, which in observational studies has been shown to be associated with prothrombotic fibrin clot phenotype.106,119 Markedly reduced Ks, suggesting lower average pore size within the fibrin network, has been reported in type 2 DM patients compared with controls in a purified fibrinogen model.106 In plasma models, lower Ks values were mostly related to longer DM duration, poorly controlled glycaemia, and a presence of concomitant CVD.118,119 Patients with DM duration >5 years compared with those with the disease duration ≤5 years as well as those with HbA1c > 6.5% compared with ≤6.5% had markedly reduced Ks, prolonged CLT, and time to 50% lysis.118 In an interventional study performed in 20 patients with type 2 DM, reduced Ks values were associated with high glycated haemoglobin (HbA1c) levels and clot porosity increased after achievement of glycaemic control.107
Mechanisms associated with hypofibrinolysis in type 2 DM patients have been extensively described and include enhanced thrombin generation, post-translational modifications of fibrinogen, proinflammatory state, endothelial dysfunction, and increased platelet activation.127,128 Enhanced incorporation of complement C3 component has also been identified as a factor linked with hypofibrinolysis in DM129 and a potential therapeutic target reducing the risk of thrombosis related to diabetes.130 Formation of NETs has been implicated in prothrombotic fibrin clot phenotype in type 2 DM patients.82 In CAD patients, hypofibrinolysis may help to estimate the cardiovascular risk, since the prevalence of DM increased along with increasing quartiles of lysis time.16 Prolonged lysis time predicted 1-year cardiovascular death (HR = 1.38, 95% CI 1.08–1.76) in diabetic patients following MI. Cardiovascular mortality in type 2 DM patients during a median follow-up of 72 months was also predicted by a higher maximum D-dimer concentration and a lower rate of D-dimer release from fibrin clots at high tPA concentration, especially in patients with a history of CVD (HR = 6.18, 95% CI 2.02–18.96 and HR = 8.98, 95% CI 2.99–26.96, respectively).131 Interestingly, hypoglycaemia in type 2 DM patients has also been associated with temporary and persistent prothrombotic effects, including increased density of fibrin network and hypofibrinolysis, which may influence the risk of cardiovascular mortality in diabetics.132
4.5 Cigarette smoking and alcohol intake
A few small case-control studies have shown a negative impact of cigarette smoking on Ks and clot susceptibility to lysis;120,121 however, in larger case-control and cross-sectional studies, the effect of smoking on CLT was not as important as other cardiovascular risk factors.112,113 Increased levels of oxidative stress marker 8-isoprostane were associated with impaired fibrin clot properties in smokers, suggesting that oxidation of fibrinogen and proteins involved in fibrinolysis may contribute to prothrombotic fibrin clot phenotype.
A placebo-controlled, randomized study revealed that moderate ethanol consumption, considered as a factor lowering the risk of CAD, was associated with a temporary inhibition of fibrinolysis.123 Ethanol intake increased PAI-1 activity; however, the exact mechanism of its increase is still unknown.
4.6 Arterial hypertension
Systolic blood pressure, but not diastolic pressure, has been reported to be associated with lower clot permeability and impaired clot lysability in middle-aged patients with arterial hypertension with no evidence of CVD, whereas systolic pressure reduction increased Ks and shortened lysis time at 6 months of antihypertensive treatment regardless of the class of the drugs.42
4.7 Hyperlipidaemia
Elevated LDL-C level positively correlated with clot maximum absorbance and CLT in apparently healthy individuals.122 In a large population-based cohort, female gender, obesity, poor glycaemic control, increased LDL-C, and decreased HDL-C were associated with clot properties progression to more prothrombotic phenotype with increasing age.27
Premature CAD has been associated with hyperlipidaemia along with increased fibrin fibre porosity, density, and prolonged lysis time.133 Intensive lowering of LDL-C levels with high-dose statins improved fibrin clot properties in subjects with no history of cardiovascular events and LDL-C below 3.4 mmol/L as well as in advanced CAD patients (Table 3).38,39
High-dose statin treatment for 6–12 months was associated with 29.2% higher Ks and CLT shortened by 16.3% in patients with a decrease in LDL-C by ≤ 1.8 mmol/L or a reduction of at least 50% if the baseline LDL-C ranged from 1.8 to 3.5 mmol/L.41
In severe aortic stenosis (AS), serum levels of apolipoproteins, including apolipoprotein C-III, B, A-I, and E, predicted hypofibrinolysis better than total cholesterol, LDL-C, or triglyceride levels.124 Of note, the association of decreased LDL-C with improvement in clot permeability and lysability supports the concept that LDL, likely via apolipoproteins, can affect the fibrin clot phenotype.
4.8 Increased lipoprotein(a)
Elevated levels of plasma lipoprotein(a), as a risk factor for premature CVD, have been found to be associated with reduced Ks, lower clot maximum absorbance, and prolonged time to 50% lysis in healthy individuals and patients following MI, with a major contribution of small apolipoprotein(a) isoforms.70 Prolonged CLT in patients with severe AS was also associated with higher lipoprotein(a) levels.124 Lipoprotein(a) is an important carrier of oxidized phospholipids in human plasma, which contribute to atherothrombotic CVD.134 Moreover, lipoprotein(a) interferes with plasminogen binding sites on fibrin and, therefore, can inhibit plasminogen activation.135
4.9 Lifestyle modifications
The cardioprotective effect of physical activity is well documented and associated with reduced premature CVD morbidity.136 On the other hand, increased fractal dimension (df), as a marker of fibrin clot architecture and mechanical stability, has been shown in healthy individuals after extensive exercise and its values returned to baseline after 60 min resting.137 Higher df correlated with denser fibrin clot structure composed of smaller fibrin fibres following exercise, suggesting short-term unfavourable effects of physical activity on fibrin. However, to our knowledge, long-term effects of intense physical training on fibrin clot phenotype, especially in patients with CVD, have not been reported.
5. Coronary artery disease
The major cause of CVD is atherosclerosis, in which pathogenesis is closely related to chronic inflammation and lipid deposition within arterial walls, resulting in the formation of fibroatheroma and an atherosclerotic plaque. TF produced by macrophages, smooth muscle cells, and foam cells initiates the coagulation cascade in a complex with activated FVII, leading to fibrin accumulation within the atherosclerotic plaque and disease progression.138
Impaired fibrin clot properties are widely recognized as factors associated with poor prognosis in CAD patients and potential thrombo-embolic risk markers in this disease.17 However, different effects on fibrin clot structure and/or function were observed in patients with acute thrombosis or following thrombotic events. Moreover, various determinants of fibrin clot properties were identified to be associated with these conditions. The available studies on fibrin clot features performed in patients with acute and chronic CAD have been summarized in the excellent review by Kietsiriroje et al.139
5.1 Acute MI
The strongest evidence supporting the role of impaired fibrin clot properties in CAD is based on the report by Sumaya et al.16 The authors showed in acute coronary syndrome patients, followed for 12 months, that for each 50% increase in lysis time assessed at hospital discharge the HR for cardiovascular death adjusted for common risk factors was 1.36 (95% CI, 1.17–1.59), despite dual-antiplatelet treatment. Similar increase in maximum turbidity, a measure of fibrin clot density, was associated with cardiovascular death (HR = 1.24, 95% CI 1.03–1.50), but this association was not significant after adjustment for biomarkers such as C-reactive protein, troponin T, and N-terminal pro B-type natriuretic peptide (NT-proBNP). Lysis time added to a clinical predictive model, including randomization to clopidogrel or ticagrelor, age, gender, BMI, smoking history, hypertension, dyslipidaemia, DM, chronic kidney disease, ST-elevation MI and previous MI, congestive heart failure, revascularization, ischaemic stroke, or PAD, displayed an incremental prognostic value for cardiovascular death (C-index 0.7 [0.649–0.75] vs. 0.69 [0.642–0.741], P < 0.001).16 Impaired clot lysability predicted also 1-year cardiovascular death (HR = 1.38; 95% CI 1.08–1.76 for each 50% increase in lysis time) and cardiovascular death combined with MI (HR = 1.21; 95% CI 1.02–1.44 for each 50% increase in lysis time) in DM patients following acute coronary syndrome.140
Reduced Ks, faster fibrin polymerization, and prolonged lysis time, associated with oxidative stress and the extent of inflammation, were reported in AMI patients compared with well-matched controls with stable angina.99 Prolonged lysis time (>90th percentile value in the control group) has been reported as a risk factor for MI (crude OR = 3.08, 95% CI 2.27–4.19).141 Prothrombotic fibrin clot features in AMI were shown to be associated with increased thrombin generation and platelet activation markers.54 Moreover, high fibrin content within the intracoronary thrombi obtained during thrombectomy correlated with low Ks142 and higher plasma levels of platelet markers.54 Formation of a thin fibrin film on the surface of some intracoronary thrombi, retrieved during thrombectomy from AMI patients, suggested that additional mechanisms may limit thrombus degradation and fragmentation in vivo (Figure 4A).143 The role of fibrin biofilm in thrombosis is not known so far; however, a murine model showed its protective function against microorganisms during the wound healing process.144
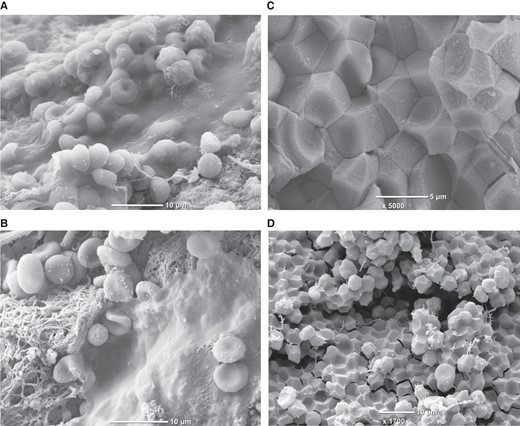
Fibrin biofilm covering intracoronary thrombi retrieved from acute myocardial infarction patients during thrombectomy (panel A and B) and polyhedrocytes formed in vivo within intracoronary thrombus (panel C) or ex vivo within whole blood clot (panel D). Images from ref.143 (panel A and B) are reproduced with permission from the Editorial Office of Cardiovascular Research.
Another possible mechanism that limits thrombus dissolution is its retraction. Contractile forces are generated by activated platelets interacting with fibrin, which change the shape of internally packed red blood cells (RBCs), forming polyhedral structures called polyhedrocytes (Figure 4B). Polyhedrocytes have been identified within arterial (Figure 4C) and venous thrombi,145,146 and it has been suggested that reduced clot contraction can contribute to thrombo-embolic complications.147,148 Of note, RBCs incorporation into plasma fibrin clots resulted in heterogeneous clot structure, increased fibre diameter, and increased viscoelastic moduli with no influence on clot permeability.149 The presence of RBCs also increased the stiffness of clots prepared from the γ′ fibrinogen.150
In a recent study, less porous clots with densely packed fibres and decreased number of protofibrils were observed in AMI patients compared with healthy controls.151 Available data show that patients with acute coronary syndrome are characterized by formation of dense fibrin clots, prolonged CLT or time to 50% lysis, and formation of stiffer fibrin clots. Such prothrombotic clot features were shown to be associated with the inflammatory state and oxidative stress, which are known to be implicated in atherosclerosis development and progression as well as with increased thrombin generation and platelet activation observed in thrombotic complications. In contrast to stable CAD, which is mostly associated with hypofibrinolysis, increased fibrinogen levels observed in acute coronary syndromes may additionally alter fibrin clot structure, resulting in the formation of dense fibrin clots. Fibrinogen level explains about 18% of variations in Ks152 and 0.5% of the variance in CLT.113 Dense fibrin network may reduce accessibility of fibrinolytic factors within fibrin mesh, but clot susceptibility to lysis is mostly limited by the level and activity of profibrinolytic factors and fibrinolysis inhibitors.
5.2 Stable CAD or a history of MI
Reduced Ks characterizes advanced CAD patients compared with healthy controls.45,114Ks values reported in stable CAD were higher than those observed in patients with acute coronary syndrome.99
Hypofibrinolysis defined as CLT in the fourth quartile compared with the first quartile has been identified as a risk factor for MI in men aged <50 years (OR 3.2, 95% CI 1.5–6.7).112 Stable CAD patients were characterized by enhanced fibrin formation and impaired fibrinolysis associated with PAI-1 levels.153 A cross-sectional study has shown that among individuals without documented CVD, women with coronary plaques had impaired clot susceptibility to lysis compared with subjects without coronary plaques.154 Moreover, increased area under the curve of clot formation and lysis predicted cardiovascular events (HR = 2.4, 95% CI 1.2–4.6) in stable CAD patients.155 A population-based case-control study confirmed that prolonged CLT was associated with an increased risk of MI (OR = 2.8, 95% CI 1.7–4.7).156 Cardiovascular and all-cause deaths were associated with prolonged CLT (HR per 10 min 1.206, 95% CI 1.037–1.402; and HR 1.164, 96% CI 1.032–1.309, respectively).157
Concomitant type 2 DM in CAD patients has been identified as a factor associated with impaired fibrin clot structure and hypofibrinolysis,158,159 suggesting that type 2 DM is potent enough to affect fibrin clot properties in CAD. The AB0 risk allele rs495828 was also associated with the formation of a more compact fibrin network in stable CAD.38,160 On the other hand, statins, fibrates, and angiotensin-converting enzyme inhibitors have been shown to improve fibrin density and its susceptibility to lysis in CAD patients.38,41,161 However, it remains to be established whether any specific modulators of fibrinolytic efficiency might be useful in the prevention of clinical outcomes in atherosclerotic vascular disease.
6. Heart failure
Prothrombotic fibrin clot phenotype, including faster fibrin polymerization, reduced Ks, lower clot compaction, and a trend to prolonged lysis time have been reported in patients with chronic HF with sinus rhythm compared with well-matched controls.162 C-reactive protein, fibrinogen, and thrombin–antithrombin complex levels had a major contribution to fibrin clot properties in chronic HF.162 Interestingly, left atrium diameter was positively correlated with lysis time.162 It has also been shown that patients with acute HF compared with both chronic HF and CAD patients (all taking aspirin) were characterized by higher rate of clot formation, higher clot density, slower rate of clot dissolution, and prolonged time to 50% clot lysis.163 Since the common causes of HF are conditions known to be associated with prothrombotic fibrin clot phenotype, such as CAD, hypertension, or AF, the mechanism of fibrin properties alteration in HF is complex and mostly related to enhanced inflammation and thrombin generation.
7. Stroke
In contrast to CAD patients, data on fibrin clot features in patients with acute stroke are limited due to the heterogeneity of stroke pathophysiology, subtypes, and various treatment strategies. Patients with acute ischaemic stroke assessed within 72 h of symptoms onset were characterized by reduced Ks and prolonged lysis time compared with healthy controls.164 Formation of denser fibrin networks resistant to lysis was observed in patients with acute ischaemic stroke before thrombolytic therapy, and prolonged CLT assessed at baseline predicted adverse neurological outcomes at 3 months.165
The composition of thrombi retrieved from stroke patients is highly heterogeneous, and similarly to intracoronary thrombi, these thrombi contained mostly fibrin, platelets, and RBCs.166 Fibrin-rich clots compared with RBC-rich clots were associated with an increased number of recanalization manoeuvres, longer time of thrombectomy, and worse clinical outcomes.166 Since the fibrin amount within intracoronary thrombi correlated with plasma-derived Ks in AMI patients,142 a similar association can be expected in ischaemic stroke patients. However, further studies are needed to confirm this hypothesis. Prothrombotic fibrin clot features in acute ischaemic stroke patients were associated with increased thrombin generation and higher levels of fibrinogen or lipoprotein(a),164,165 suggesting that multiple factors are involved in altering clot properties in this acute state.
On the other hand, young patients following acute cerebral ischaemia were characterized by enhanced thrombin generation, platelet activation, and hypofibrinolysis, despite the use of antithrombotic treatment in 75% of the studied subjects.167 Ischaemic stroke patients assessed 3–19 months after the event compared with healthy controls had reduced clot permeability, faster fibrin polymerization, and prolonged CLT, despite similar fibrinogen levels.168 SEM analysis revealed increased fibrin diameter and density in cryptogenic stroke patients.168 Siegerink et al.156 reported that hyperfibrinolysis, defined as the first tertile of CLT in the control group, was associated with about four-fold increased risk of ischaemic stroke among patients assessed at least 23 months after the event. The available data suggest a tendency to hypofibrinolysis, at least in a subset of patients following ischaemic stroke.
8. Peripheral arterial disease
Impaired fibrin clot properties, largely driven by hypofibrinolysis, were observed in patients with intermittent claudication, a manifestation of PAD associated with about six-fold higher risk of cardiovascular mortality.169 First-degree relatives of intermittent claudication patients were characterized by thicker fibrin fibres measured by turbidity, increased factor FXIII cross-linking activity, and resistance to fibrinolysis.170
Hypofibrinolysis, along with a significant reduction in Ks, was reported in 106 PAD patients compared with controls.171 Both fibrin measures predicted PAD progression during long-term follow-up.171 A history of acute limb ischaemia (ALI), the most serious PAD presentation, was associated with reduced Ks and decreased rate of D-dimer release from clots.172 Premature PAD has also been associated with reduced Ks and prolonged lysis time compared with the control group without PAD.173 Restenosis in ALI patients, detected during one-year follow-up was associated with prothrombotic fibrin features at baseline, along with increased thrombin generation and higher von Willebrand factor antigen levels.174 Despite similar risk factors for CAD and PAD, impaired fibrin clot structure, especially clot porosity reflected by low Ks, seems to be characteristic of the latter disease. Impaired fibrin clot structure can be driven by elevated fibrinogen levels.152 However, taking the intricate interactions between atherosclerosis, inflammation, and coagulation activation in PAD patients into account, it is hard to determine specific factors associated with impaired fibrin clot properties in this disease.
9. Arrhythmia
AF is the most common cardiac arrhythmia, affecting up to one-quarter of the adult population. AF is associated with an increased risk of stroke or systemic embolism. Currently, there is a need for biomarkers to assess both thrombotic and bleeding risk in AF,175 especially in subjects with additional risk factors, such as chronic kidney disease.176,177 Major bleeding is the most feared adverse event in anticoagulated AF patients.178 The prevalence of major bleeding in AF is even higher than the incidence of stroke or systemic embolism on non-VKA oral anticoagulants (NOACs; 2–4% vs. 1.5–2.5%). In AF patients at the onset of oral anticoagulation, plasma fibrin clot properties were improved after 3 days of VKA administration,49 whereas treatment with rivaroxaban was associated with markedly increased Ks and shortened CLT 2–6 h after its intake.50
Formation of compact plasma fibrin clots that are more resistant to lysis has been observed in AF patients, regardless of the AF type and CHA2DS2-VASc or HAS-BLED scores.179,180 Reduced Ks was associated with increased risk of both ischaemic stroke/transient ischaemic attack (HR 6.55; 95% CI 2.17–19.82) and major bleeds (HR 10.65; 95% CI 3.52–32.22) in AF patients treated with VKA.181 Lower Ks also predicted ischaemic cerebrovascular events (HR 6.64; 95% CI 2.2–20.1) and major bleeding events (HR 7.38; 95% CI 2.58–21.10) in AF patients taking rivaroxaban.182 Long-term follow-up studies on large populations are, however, needed to confirm the clinical utility of the fibrin clot phenotype assessment in AF.
10. Aortic aneurysm
Unfavourably altered fibrin clot properties were identified in patients with aortic aneurysm, which aetiology is under investigation, but includes trauma, infection, and inflammation.
It has been shown that patients with abdominal aortic aneurysms form dense fibrin clots with smaller pores, which are resistant to fibrinolysis.183 Both clot porosity, reflected by Ks, and time to 50% lysis of the clot were associated with the size of aneurysm. Elevated plasma thrombin–antithrombin complex levels along with increased D-dimer concentrations independently predicted the growth of abdominal aortic aneurysms.184 These observations suggest an important involvement of coagulation activation and fibrin formation in the disease progression and a potential link between abdominal aortic aneurysm and coronary atherosclerosis, which share common risk factors. Therefore, it has been hypothesized that patients with abdominal aortic aneurysm may benefit from an early evaluation of coronary arteries.185
Assessment of fibrin clot properties in patients with isolated abdominal aortic aneurysms might help to clarify to what extent fibrin measures can predict unfavourable clinical outcomes in such subjects.
11. Heart valve disease
There is evidence for the prothrombotic clot phenotype in patients with severe AS free of CAD and PAD. Systemic hypofibrinolysis, reflected by prolonged CLT, was associated with the severity of AS as well as larger amounts of valvular fibrin and higher PAI-1 valvular expression.186 Even more pronounced prolongation of lysis time was observed in patients with degenerative mitral valve stenosis compared with AS.187 Increased oxidative stress and elevated levels of apolipoprotein C-III, B, A-I, and E have been implicated in prothrombotic fibrin clot phenotype in severe AS patients.124,188 Interestingly, high-risk AS patients scheduled for transcatheter aortic valve implantation (TAVI) compared with those undergoing surgical aortic valve replacement formed denser and more resistant to lysis fibrin clots.189 After adjustment for age and clinical risk factors, prolonged lysis time was an independent predictor for TAVI indication. Clinical risk factors known to alter fibrin clot properties such as concomitant DM can additionally impair fibrin clot phenotype in AS patients.190 Therapeutic interventions that inhibit valvular inflammation and coagulation activation may slow the rate of AS progression, whereas plasma clot susceptibility to fibrinolysis might be a useful marker reflecting the risk of thrombotic complications in AS.
12. Concluding remarks
Impaired plasma fibrin clot properties, largely determined by environmental factors, characterize patients with acute and chronic manifestations of CVD and less favourable features may identify subjects at high risk of recurrent thrombo-embolic events as well as faster progression of CVD. Given challenges of measurement standardization in practice, clinical implications of clot permeability or other clot fibrin measures remain to be established. Clarification of multiple mechanisms underlying the formation of more compact fibrin networks might help develop novel therapies aimed at favourable modification of clot structure.
Authors’ contribution
M.Z. reviewed the literature and drafted the manuscript, and R.A. and A.U. revised and edited the manuscript.
Funding
This study was supported by the Jagiellonian University Medical College (grant number N41/DBS/000682 to A.U. and N41/DBS/00906 to M.Z.).
Data availability
No new data were generated or analysed in support of this research.
References
Author notes
Conflict of interest: None declared.
