


Abstract
Remote ischaemic conditioning (RIC) has been shown to reduce myocardial infarct size in animal models of myocardial infarction. Platelet thrombus formation is a critical determinant of outcome in ST-segment elevation myocardial infarction (STEMI). Whether the beneficial effects of RIC are related to thrombotic parameters is unclear.
In a substudy of the Effect of Remote Ischaemic Conditioning on clinical outcomes in STEMI patients undergoing Primary Percutaneous Coronary Intervention (ERIC-PPCI) trial, we assessed the effect of RIC on thrombotic status. Patients presenting with STEMI were randomized to immediate RIC consisting of an automated autoRIC™ cuff on the upper arm inflated to 200 mmHg for 5 min and deflated for 5 min for four cycles (n = 53) or sham (n = 47). Venous blood was tested at presentation, discharge (48 h) and 6–8 weeks, to assess platelet reactivity, coagulation, and endogenous fibrinolysis using the Global Thrombosis Test and thromboelastography. Baseline thrombotic status was similar in the two groups. At discharge, there was some evidence that the time to in vitro thrombotic occlusion under high shear stress was longer with RIC compared to sham (454 ± 105 s vs. 403 ± 105 s; mean difference 50.1 s; 95% confidence interval 93.7–6.4, P = 0.025), but this was no longer apparent at 6–8 weeks. There was no difference in clot formation or endogenous fibrinolysis between the study arms at any time point.
RIC may reduce platelet reactivity in the first 48 h post-STEMI. Further research is needed to delineate mechanisms through which RIC may reduce platelet reactivity, and whether it may improve outcomes in patients with persistent high on-treatment platelet reactivity.

1. Introduction
The cause of ST-segment elevation myocardial infarction (STEMI) is most commonly the disruption of a coronary atheromatous plaque, leading to local thrombosis, and culminating in arterial occlusion. The outcome of such a prothrombotic stimulus is determined by the magnitude of the thrombotic response, balanced against the effectiveness of the endogenous fibrinolytic enzymes in overcoming lasting vessel occlusion.1 Treatment of STEMI patients with primary percutaneous coronary intervention (PPCI) aims to rapidly restore coronary flow, improve myocardial salvage, and reduce infarct size. However, reperfusion has also been associated with consequent downstream myocardial reperfusion injury, which may further compound the deleterious effects of the antecedent period of ischaemia.2–4 Measures to ameliorate the thrombotic response and reduce ischaemic–reperfusion injury (IRI) have been proposed to reduce infarct size.1,3–5
Ischaemic preconditioning (IPC) refers to the ability of brief, cyclic periods of ischaemia and reperfusion (IR) to render the myocardium more resistant to a subsequent ischaemic insult. In animal models, IPC has been shown to reduce infarct size and to enhance recovery of contractile function of the myocardial region at risk.6 Remote ischaemic conditioning (RIC) involves the application of one or more brief cycles of IR to a ‘remote’ organ (such as the arm or leg) and in animal models, has been shown to reduce infarct size and IRI.7–9
Application of RIC in humans by repeated inflation and deflation of a blood pressure cuff on the upper arm has been shown to reduce the extent of perioperative myocardial injury in patients undergoing cardiac surgery in smaller studies,10 although it did not improve clinical outcomes in large studies.11,12 Compared to standard care, the use of RIC in patients undergoing PPCI has been associated with reduction in myocardial injury and increased myocardial salvage, without definitive reduction in infarct size or improvement in survival.13,14
The exact mechanism through which RIC potentially confers cardioprotection in STEMI is still not fully understood.15,16 Proposed mechanisms include generation of an endogenous substance such as adenosine, bradykinin, or other factor, which activates a neural pathway; mediation by an endogenous substance generated in the remote organ which enters the blood stream to affect cardioprotection; or through a systemic protective response, suppressing inflammation, and apoptosis.15,16 In addition, IPC has been linked to favourable effects on thrombotic markers. In a canine model, IPC was accompanied by down-regulation of platelet–fibrinogen binding and formation of neutrophil–platelet aggregates.17 In stable coronary artery disease, remote ischaemia was shown to induce protection against an exercise-related increase in platelet reactivity18 and reduced adenosine diphosphate (ADP)-stimulated platelet aggregation. In patients undergoing radiofrequency ablation for atrial fibrillation, RIC reduced platelet activation and platelet reactivity.19 Since platelet reactivity, activation of coagulation and endogenous fibrinolytic pathways are important drivers and determinants of the outcome of myocardial infarction,20 and may play a role in IRI,21 we hypothesized that the benefit of RIC in STEMI may be mediated through anti-thrombotic effects. The aim of this study was to determine whether RIC improves thrombotic status in patients with STEMI undergoing PPCI.
2. Methods
2.1 Study design and population
We undertook a substudy of the Effect of Remote Ischaemic Conditioning on clinical outcomes in STEMI patients undergoing Primary Percutaneous Coronary Intervention (ERIC-PPCI) multicentre, randomized, single-blind, placebo-controlled clinical trial (ClinicalTrials.gov NCT02342522).22 Patients with chest pain and suspected ST-segment elevation on the electrocardiogram (ECG) were screened for possible inclusion. Patients were included if they were older than 18 years of age, had ST-segment elevation on ECG, were eligible for PPCI and gave consent. Exclusion criteria were previous coronary artery bypass graft surgery, myocardial infarct within the previous 30 days, left bundle branch block on ECG, treatment with therapeutic hypothermia, conditions precluding use of remote ischaemic conditioning (paresis of upper limb or presence of an arteriovenous shunt), and life expectancy of <1 year due to a non-cardiac pathology. All patients recruited to ERIC-PPCI in a single centre at the Lister Hospital, East and North Hertfordshire NHS Trust, were included in the substudy. The study was approved by the National Research Ethics Service and was conducted in accordance with the principles of Good Clinical Practice and the trial conformed to the principles outlined in the Declaration of Helsinki. All patients provided initial verbal assent before randomization, which was followed by written informed consent.
2.2 Trial treatment protocol
The trial protocol and main clinical results have been previously published.22,23 In brief, patients were randomized in a 1:1 ratio to active treatment with RIC or control treatment with sham RIC (Figure 1). Randomization was performed via a secure website using random permuted blocks. Patients randomized to the interventional arm received RIC protocol using the automated AutoRIC cuff device (CellAegis Devices, Toronto, ON, Canada), comprising of four alternating cycles of cuff inflation to 200 mmHg for 5 min and deflation for 5 min. The control group received a sham simulated RIC. The PPCI procedure was performed according to standard clinical care and PPCI operators and patients were blinded to treatment allocation. Study team members collecting the data and assessing outcomes were masked to treatment allocation.
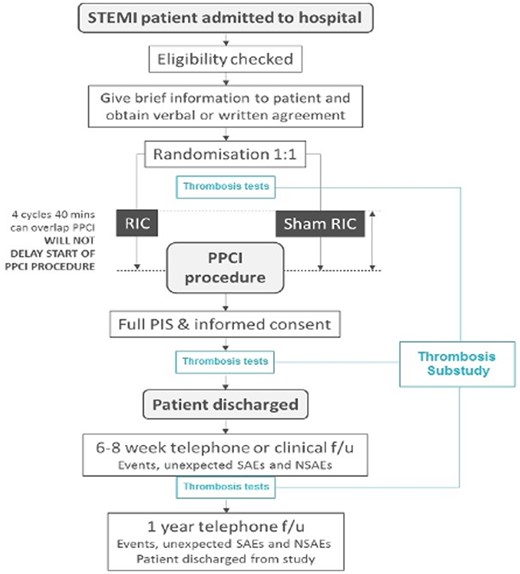
ERIC-PPCI study flowchart. Flowchart in black represents the ERIC-PPCI main study, whereas in blue represents the thrombosis substudy. Blood samples were taken at three time points: (i) baseline upon arrival to the catheterization laboratory and at randomization, (ii) at clinical stabilization, just prior to hospital discharge, and (iii) at 6–8 weeks of follow-up. NSAEs, non-serious adverse events; PIS, patient information sheet; SAEs, serious adverse events.
All patients received 300 mg aspirin orally and 600 mg clopidogrel or 180 mg ticagrelor orally, and standard weight-adjusted heparin intravenously prior to PPCI. Dual antiplatelet therapy (DAPT) was continued in all patients throughout the substudy.
2.3 Blood sampling technique
Blood samples were taken at three time points: (i) baseline upon arrival to the cardiac catheterization laboratory (Day 0), prior to heparin, or glycoprotein IIb/IIIa inhibitor administration and before PPCI, (ii) at clinical stabilization, just prior to hospital discharge, and (iii) at 6–8 weeks follow-up. The first blood samples were taken from a 6-Fr radial or femoral sheath, after the administration of DAPT but before treatment with unfractionated heparin. Prior to insertion, the sheaths were flushed with normal saline, avoiding the use of heparinized saline prior to the first blood draw. The second and subsequent blood samples were taken from an antecubital vein using an 18-G butterfly cannula, taking care to avoid prolonged tourniquet time. All samples were taken using a 2-syringe technique, which involved using the first 5 mL blood for routine blood tests, and the subsequent sample for assessment of thrombotic status.
2.4 Assessment of global thrombotic status
2.4.1 Global Thrombosis Test
The Global Thrombosis Test (GTT) (Thromboquest Ltd., London, UK) assesses both platelet reactivity (occlusion time, OT) and endogenous fibrinolysis (lysis time, LT) from a 4 mL native, non-anticoagulated blood sample. The instrument was positioned in the cardiac catheterization laboratory. After the blood sample was obtained, it was introduced into the GTT cartridge within 15 s of withdrawal and the automated measurement begun. The principle of the GTT has been previously described in detail.24,25 The instrument assesses firstly the time taken to form an occlusive thrombus under high shear [OT (s)], a marker of platelet reactivity. Shorter OT represents enhanced platelet reactivity. The arrest of flow due to the formation of an occlusive platelet thrombus, is followed by a short stabilization period, after which the instrument records the time required for spontaneous restart flow due to endogenous thrombolysis of the thrombus formed in the first phase [LT (s)]. Longer LT represent less effective endogenous fibrinolysis.
2.4.2 Thromboelastography
Blood was also tested using the thromboelastography (TEG) thromboelastograph (TEG 5000 Hemostasis Analyser system, Haemonetics, UK). Two tests were carried out per patient in parallel; whole blood (without the addition of any modifiers) and whole blood plus kaolin (Haemonetics, Watford, UK). Whole blood testing was performed immediately after sampling, whereas whole blood plus kaolin was performed within 4 min of sampling. The TEG generates a characteristic curve of thrombus formation and lysis with several indices, and definition of these is shown in Table 1.26
TEG indices and definitions
| Reaction time (R) (min) | Measures the time from the start of a sample run until the first significant level of detectable clot formation. R is shortened by hypercoagulable conditions. |
| Kinetics (K) (min) | Measures the time from R until a fixed level of clot strength is reached. K is shortened by hypercoagulable conditions. When MA <20 mm, K is undefined. |
| Angle (°) | Represents the rate of clot formation and reflects fibrinogen activity. Angle relates to K, since both are a function of the rate of clot formation. Angle is larger by hypercoagulable conditions. |
| Maximum amplitude (MA) (mm) | Represents whole clot strength and reflects many aspects of clot formation including platelet number and function as well as the fibrin contribution to clot strength. MA is larger by hypercoagulable conditions. |
| LY30 (%) | Represents the percentage of clot which has lysed after 30 min of MA. |
| LY60 (%) | Represents the percentage of clot which has lysed after 60 min of MA. |
| Time to maximum amplitude (TMA) (min) | Measures the time to form maximum clot strength. |
2.5 Study endpoints
The endpoint of the substudy was thrombotic status as measured by GTT and TEG parameters, in the RIC compared to the sham arms, at discharge and at 6–8 weeks. The primary combined endpoint of the main study was cardiac death or hospitalization for heart failure at 12 months and these results have been published.22
2.6 Data collection and follow-up
Patient case-notes were checked throughout the course of the index admission, to allow contemporaneous data collection. Patients were followed up at 6–8 weeks in person including final blood draw for thrombotic status assessment.
2.7 Statistical analysis
In this pilot, hypothesis-generating substudy, we aimed to compare thrombotic status within groups (between patients on admission and at discharge and follow-up) and between groups (between RIC and sham). For a main trial designed with 90% power and two-sided 5% significance, it is recommended that a pilot trial sample size of at least 20 per treatment arm is needed for estimated small (0.2) standardized effect size,27 which was speculated from earlier studies.25 Therefore, a study of 100 patients (50 per treatment arm) was felt to be of sufficient size to produce meaningful results. Data are presented as mean and standard deviation (when normally distributed) or median and interquartile range (non-normally distributed). Normality was tested using the Shapiro–Wilk test. Differences in thrombotic variables at differing time points in the group as a whole were assessed using paired t-tests and Mann–Whitney U test. Difference between RIC and sham groups at any individual time point were assessed using ANCOVA. Analyses were performed with Stata version 11.2 (StataCorp, College Station, TX, USA).
3. Results
Between February 2016 and March 2018, 100 patients with STEMI were enrolled into the substudy, and randomized to RIC (n = 53) or sham RIC (n = 47) (Supplementary material online, Figure S1 and Table S1). The main ERIC-PPCI study results have already been published.22 Baseline clinical characteristics are shown in Table 2 and baseline haematological and biochemical profiles in Table 3. There were no patients with atrial fibrillation or patients taking oral anticoagulation included in this substudy. Angiographic, interventional, and echocardiographic patient characteristics are shown in Table 4. The RIC and sham groups were well-matched for all aforementioned characteristics. In particular, there was no significant difference in either periprocedural or post-PPCI antithrombotic treatment allocation between the treatment arms.
Baseline patient characteristics
| Whole group (n = 100) | Sham RIC (n = 47) | RIC (n = 53) | P-value | |
|---|---|---|---|---|
| Age (years) | 65.2 ± 13.6 | 65.1 ± 13.1 | 65.4 ± 14.1 | 0.903 |
| Male | 79 (79.0) | 37 (78.7) | 42 (79.2) | 1.000 |
| Caucasian | 93 (93.0) | 46 (97.9) | 47 (88.7) | 0.117 |
| BMI | 26.7 ± 4.2 | 26.9 ± 4.8 | 26.6 ± 3.6 | 0.673 |
| TIMI score | 3.1 ± 2.4 | 2.9 ± 2.3 | 3.3 ± 2.5 | 0.467 |
| Diabetes mellitus | 20 (20.0) | 7 (14.9) | 13 (24.5) | 0.317 |
| Active smoker | 27 (27.0) | 15 (31.9) | 12 (22.6) | 0.369 |
| Hypertension | 44 (44.0) | 20 (42.6) | 24 (45.3) | 0.842 |
| Family history of premature IHD | 26 (26.0) | 13 (27.7) | 13 (24.5) | 0.820 |
| Prior MI | 9 (9.0) | 3 (6.4) | 6 (11.3) | 0.495 |
| Prior PCI | 8 (8.0) | 3 (6.4) | 5 (9.4) | 0.719 |
| Renal insufficiency | 4 (4.0) | 2 (4.3) | 2 (3.8) | 1.000 |
| PVD | 3 (3.0) | 3 (6.4) | 0 | 0.100 |
| Prior CVA | 4 (4.0) | 1 (2.1) | 3 (5.7) | 0.620 |
| Prior statin use | 26 (26.0) | 14 (29.8) | 12 (22.6) | 0.496 |
| Prior aspirin use | 16 (16.0) | 5 (10.6) | 11 (20.8) | 0.186 |
| Prior P2Y12 inhibitor use | 1 (1.0) | 0 | 1 (1.9) | 1.000 |
| Initial P2Y12 inhibitor loading agent | ||||
| Clopidogrel | 76 (76.0) | 37 (78.7) | 39 (73.6) | 0.642 |
| Ticagrelor | 20 (20.0) | 8 (17.0) | 12 (22.6) | 0.618 |
| Cangrelor | 4 (4.0) | 2 (4.3) | 2 (3.8) | 1.000 |
| Morphine prior to blood sample | 59 (59.0) | 26 (55.3) | 33 (62.3) | 0.544 |
| Time from P2Y12 inhibitor loading to first blood sample (min) | 46.9 ± 21.9 | 46.9 ± 19.1 | 46.9 ± 24.2 | 0.979 |
| Medications prior to hospital discharge | ||||
| Aspirin | 94 (94.0) | 45 (95.7) | 49 (92.5) | 1.000 |
| Clopidogrel | 12 (12.0) | 7 (14.9) | 5 (9.4) | 0.540 |
| Ticagrelor | 82 (82.0) | 38 (80.9) | 44 (83.0) | 0.800 |
| Beta-blocker | 91 (91.0) | 44 (93.6) | 47 (88.7) | 1.000 |
| ACE inhibitor | 93 (93.0) | 45 (95.7) | 48 (90.6) | 1.000 |
| Calcium antagonist | 6 (6.0) | 1 (2.1) | 5 (9.4) | 0.206 |
| Statin | 92 (92.0) | 45 (95.7) | 47 (88.7) | 0.496 |
| Nitrate | 2 (2.0) | 0 | 2 (3.8) | 0.497 |
| Insulin | 3 (3.0) | 2 (4.3) | 1 (1.9) | 0.599 |
Values are represented as mean ± standard deviation or n (%). Renal insufficiency was defined as creatinine levels >177 μmol/L. Prior statin, aspirin, or P2Y12 inhibitor use defined as regular statin, aspirin, or P2Y12 inhibitor use before hospitalization. Family history of premature IHD was defined as a diagnosis of IHD in a first-degree relative under the age of 60.
ACE, angiotensin-converting enzyme; BMI, body mass index; CVA, cerebrovascular accident; IHD, ischaemic heart disease; MI, myocardial infarction; PCI, percutaneous coronary intervention; PVD, peripheral vascular disease; TIMI, thrombolysis in myocardial infarction.
Haematological and biochemical profiles
| Whole group (n = 100) | Sham RIC (n = 47) | RIC (n = 53) | P-value | |
|---|---|---|---|---|
| Haemoglobin (g/L) | 138 ± 19 | 136 ± 19 | 139 ± 19 | 0.400 |
| Haematocrit (%) | 41 ± 6 | 40 ± 6 | 41 ± 5 | 0.516 |
| Neutrophil count (×109/L) | 8.6 ± 2.9 | 8.6 ± 2.8 | 8.6 ± 3.1 | 0.938 |
| Platelet count (×109/L) | 259 ± 77 | 258 ± 78 | 260 ± 77 | 0.923 |
| Serum albumin (g/L)a | 43 ± 3.7 | 42 ± 3.8 | 43 ± 3.7 | 0.243 |
| Sodium (mmol/L) | 138 ± 3 | 138 ± 2 | 138 ± 3 | 0.789 |
| Creatinine (µmol/L) | 91 ± 37 | 94 ± 49 | 89 ± 23 | 0.513 |
| Peak troponin T (ng/L)a | 2223 (1072–3796) | 2014 (993–3606) | 2301 (1074–3945) | 0.474 |
| Fibrinogen (g/L) | 4.6 ± 1.3 | 4.6 ± 1.1 | 4.7 ± 1.5 | 0.605 |
| PT (s) | 11.8 ± 1.1 | 11.8 ± 1.0 | 11.9 ± 1.2 | 0.728 |
| aPTT (s) | 28.1 ± 3.6 | 27.5 ± 3.4 | 28.6 ± 3.7 | 0.175 |
| Total cholesterol (mmol/L) | 5.1 ± 1.2 | 4.9 ± 1.2 | 5.3 ± 1.1 | 0.121 |
| LDL cholesterol (mmol/L) | 2.9 ± 0.8 | 2.9 ± 0.9 | 2.9 ± 0.7 | 0.867 |
| Hs C-reactive protein (mg/L)a | 3 (1–8) | 3 (2–8) | 2 (1–8) | 0.273 |
Values are represented as mean ± standard deviation, except awhere values are represented as median (interquartile range).
All values measured at presentation, except peak troponin T.
Normal values: haemoglobin 130–180 g/L (males) and 115–165 g/L (females); haematocrit 40–52% (males) and 36–47% (females); neutrophil count 2–7.5 ×10⁹/L; platelet count 150–400 ×109/L; serum albumin 34–54 g/L; serum sodium 135–145 mmol/L, creatinine 60–110 μmol/L (males), and 45-90 μmol/L (females); troponin T < 14 ng/L (Elecsys high-sensitivity assay, Roche Diagnostics); fibrinogen 2–4 g/L; PT 11–13.5 s; aPTT 25–35 s; total cholesterol ≤4.0 mmol/L; LDL cholesterol ≤2.0 mmol/L; high-sensitivity C-reactive protein 0–3 mg/L.
aPTT, activated partial thromboplastin time; LDL, low-density lipoprotein; PT, prothrombin time.
Angiographic, interventional, and echocardiographic patient characteristics
| Whole group (n = 100) | Sham RIC (n = 47) | RIC (n = 53) | P-value | |
|---|---|---|---|---|
| Complete (>70%) ST-segment resolution on ECG pre-PPCI | 9 (9.0) | 5 (10.6) | 4 (7.5) | 0.731 |
| Systolic blood pressure (mmHg) on arrivala | 130 ± 24 | 133 ± 26 | 128 ± 23 | 0.338 |
| Diastolic blood pressure (mmHg) on arrivala | 78 ± 16 | 80 ± 16 | 76 ± 15 | 0.275 |
| Heart rate (b.p.m.) on arrivala | 79 ± 18 | 78 ± 18 | 80 ± 19 | 0.752 |
| Killip classification score >2 | 4 (4.0) | 2 (4.3) | 2 (3.8) | 1.000 |
| Radial access | 93 (93.0) | 42 (89.4) | 51 (96.2) | 0.249 |
| One-vessel disease | 54 (54.0) | 23 (48.9) | 31 (58.5) | 0.422 |
| Two-vessel disease | 31 (31.0) | 17 (36.2) | 14 (26.4) | 0.387 |
| Three-vessel disease | 15 (15.0) | 7 (14.9) | 8 (15.1) | 1.000 |
| Culprit vessel LAD | 44 (44.0) | 16 (34.0) | 27 (50.9) | 0.107 |
| GPI (Tirofiban) use | 32 (32.0) | 16 (34.0) | 16 (30.2) | 0.830 |
| Thrombus aspiration | 7 (7.0) | 3 (6.4) | 4 (7.5) | 1.000 |
| DES implantation | 95 (95.0) | 43 (91.5) | 52 (98.1) | 0.184 |
| Stent diameter <3 mm | 31 (31.0) | 16 (34.0) | 15 (28.3) | 0.388 |
| TIMI 2/3 angiographic flow pre-PPCI | 23 (23.0) | 10 (21.3) | 13 (24.5) | 0.813 |
| TIMI 2/3 angiographic flow post-PPCI | 99 (99.0) | 47 (100) | 52 (98.1) | 1.000 |
| Myocardial blush grade 2/3 post-PPCI | 95 (95.0) | 46 (97.9) | 49 (92.5) | 1.000 |
| Door to first device time (min) | 29 (23–36) | 29 (21–33) | 30 (24–53) | 0.179 |
| Call to first device time (min) | 101 (76–134) | 98 (76–131) | 103 (75–136) | 0.882 |
| Pain to first device time (min) | 162 (118–263) | 170 (119–276) | 155 (117–235) | 0.519 |
| Left ventricular function | ||||
| Normal (EF ≥55%) | 34 (34.0) | 16 (34.0) | 18 (33.9) | 1.000 |
| Mildly impaired (EF 45–54%) | 36 (36.0) | 16 (34.0) | 20 (37.8) | 0.835 |
| Moderately impaired (EF 36–44%) | 23 (23.0) | 13 (27.7) | 10 (18.9) | 0.346 |
| Severely impaired (EF ≤35%) | 7 (7.0) | 2 (4.3) | 5 (9.4) | 0.442 |
Values are represented as median (interquartile range) or n (%), except
where values are mean ± standard deviation. Left ventricular function was assessed by echocardiography prior to hospital discharge.
Door to first device time was the time interval between the arrival of a patient at the hospital and the time of first intracoronary device use (defined as time of first balloon or stent inflation; or use of thrombectomy or angioplasty wire if these re-established flow). Call to device time was the time interval between the first call for help and first device time. Pain to device time was the time interval between the onset of symptoms and the first intracoronary device use.
DES, drug eluting stent; EF, ejection fraction; GPI, glycoprotein IIb/IIIa inhibitor; LAD, left anterior descending coronary artery; MI, myocardial infarction; PPCI, primary percutaneous coronary intervention; TIMI, thrombolysis in myocardial infarction.
3.1 Global Thrombosis Test results
In the whole cohort (n = 100), OT increased from baseline to hospital discharge (338 ± 129 s vs. 430 ± 107 s, P < 0.001) and further increased at 6–8 weeks (baseline vs. 6–8 weeks 338 ± 129 s vs. 493 ± 132 s, P < 0.001) (Figure 2A).
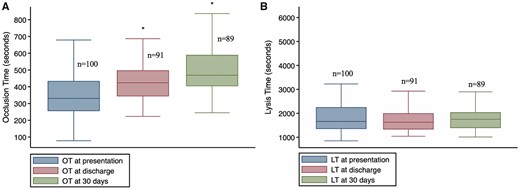
Distribution of OT and LT at the pre-specified time points. LT, lysis time; OT, occlusion time. *P < 0.01 compared to baseline. OT at baseline vs. discharge (paired t-test: mean difference 92 s, 95% CI 66.61–117.57; P < 0.001). OT at baseline vs. 30 days (Mann–Whitney U test: mean difference 193 s, 95% CI 158.29–229.61; P < 0.001).
Baseline OT was similar in the RIC and sham groups, with mean difference 19.65 s [95% confidence interval (CI) 69.41–70.36] (Table 5, Figure 3). However, there was some evidence that OT at hospital discharge was prolonged in RIC group compared to sham (454 ± 105 s vs. 403 ± 105 s; mean difference 50.1 s; 95% CI 6.4–93.7, P = 0.025), but this was less apparent at 6–8 weeks follow-up (538 ± 142 s vs. 511 ± 142 s, mean difference 27.5 s; 95% CI 102.5–47.5, P = 0.818) (Table 5, Figure 3).
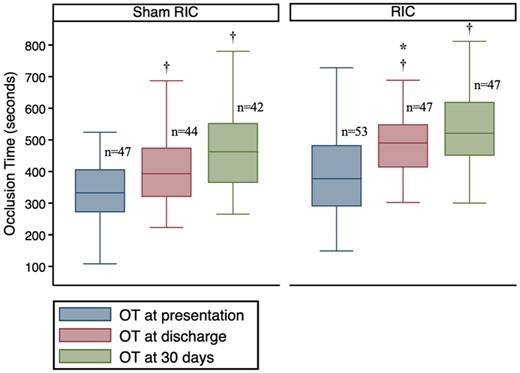
Distribution of OT at the pre-specified time points between the study arms. OT was significantly prolonged at hospital discharge in RIC group compared to sham RIC group. *Comparison between RIC and sham, P <0.05. †Difference within group compared to baseline P < 0.001. Comparison made using ANCOVA.
Tests of thrombotic status
| Whole group (n = 100) | Sham RIC (n = 47) | RIC (n = 53) | P-value | |
|---|---|---|---|---|
| Global Thrombosis Test (GTT) | ||||
| Baseline | ||||
| OT (s)a | 337 ± 129 | 329 ± 98 | 349 ± 151 | 0.444 |
| LT (s) | 1660 (1348–2255) | 1574 (1323–2284) | 1670 (1426–2146) | 0.777 |
| At discharge | ||||
| OT (s)a | 430 ± 107 | 403 ± 105 | 454 ± 105 | 0.025 |
| LT (s) | 1626 (1328–2002) | 1646 (1406–2123) | 1571 (1284–1924) | 0.241 |
| At 6–8 weeks | ||||
| OT (s)a | 493 ± 132 | 471 ± 132 | 512 ± 130 | 0.144 |
| LT (s) | 1752 (1387–2042) | 1799 (1451–2199) | 1675 (1296–2026) | 0.227 |
| Thromboelastography (TEG) | ||||
| Baseline (native blood sample) | ||||
| Reaction time (R) (min) | 8.2 (5.9–9.5) | 8.2 (5.9–9.6) | 8.2 (6.1–9.3) | 0.841 |
| Kinetics (K) (min) | 2.5 (1.9–3.8) | 2.2 (1.8–3.4) | 2.7 (2.1–3.9) | 0.124 |
| Angle (°) | 56 (45–64) | 59 (47–66) | 53 (39–62) | 0.204 |
| Maximum amplitude (MA) (mm) | 73 (67–78) | 72 (69–78) | 73 (66–78) | 0.889 |
| LY30 (%) | 0.2 (0–1.6) | 0.7 (0–3.5) | 0.1 (0–1.1) | 0.099 |
| LY60 (%) | 2.8 (0.9–5.1) | 3.5 (1.2–7.2) | 2.5 (0.6–4.5) | 0.279 |
| Time to maximum amplitude (TMA) (min) | 28.2 (24.2–34.8) | 26.2 (23.4–32.9) | 30.5 (24.8–36.9) | 0.242 |
| At discharge (native blood sample) | ||||
| Reaction time (R) (min) | 9.1 (6.3–11.8) | 10.6 (6.3–11.8) | 8.9 (6.5–11.4) | 0.865 |
| Kinetics (K) (min) | 3.2 (1.9–4.0) | 3.5 (1.9–3.9) | 2.7 (1.9–4.4) | 0.864 |
| Angle (°) | 53 (46–65) | 52 (49–65) | 58 (41–64) | 0.884 |
| Maximum amplitude (MA) (mm) | 73 (68–77) | 73 (69–77) | 72 (66–79) | 0.990 |
| LY30 (%) | 0.8 (0–4.7) | 0.6 (0.1–8.0) | 1.1 (0–3.9) | 0.741 |
| LY60 (%) | 3.5 (1.2–9.7) | 3.5 (1.9–13.4) | 3.7 (1.2–9.5) | 0.576 |
| Time to maximum amplitude (TMA) (min) | 30.6 (22.2–33.6) | 31.6 (22.2–34.3) | 27.0 (22.2–32.1) | 0.444 |
| At 6–8 weeks (native blood sample) | ||||
| Reaction time (R) (min) | 9.8 (7.6–12.3) | 9.7 (8.0–12.3) | 10.0 (7.2–12.3) | 0.882 |
| Kinetics (K) (min) | 2.6 (1.9–3.6) | 2.8 (1.9–3.5) | 2.6 (1.9–3.8) | 0.974 |
| Angle (°) | 58 (49–65) | 58 (49–65) | 61 (49–64) | 0.691 |
| Maximum amplitude (MA) (mm) | 75 (71–79) | 76 (69–79) | 74 (72–79) | 0.817 |
| LY30 (%) | 1.0 (0.1–2.2) | 1.2 (0.1–2.1) | 0.6 (0.1–2.9) | 0.855 |
| LY60 (%) | 4.0 (1.6–6.1) | 4.0 (1.8–6.1) | 3.3 (1.6–6.3) | 0.585 |
| Time to maximum amplitude (TMA) (min) | 29.1 (22.1–34.8) | 27.0 (20.6–33.7) | 29.7 (24.9–35.8) | 0.260 |
| Baseline (Kaolin added) | ||||
| Reaction time (R) (min) | 5.1 (3.2–5.9) | 5.2 (3.2–6.1) | 5.0 (3.5–5.9) | 0.750 |
| Kinetics (K) (min) | 1.2 (1.1–1.4) | 1.2 (1.0–1.6) | 1.2 (1.1–1.4) | 0.873 |
| Angle (°) | 72 (67–74) | 71 (67–75) | 72 (69–74) | 0.811 |
| Maximum amplitude (MA) (mm) | 76 (72–81) | 76 (71–81) | 76 (74–79) | 0.812 |
| LY30 (%) | 1.1 (0.2–4.3) | 1.2 (0–3.7) | 1.0 (0.3–5.4) | 0.404 |
| LY60 (%) | 4.5 (2.0–8.1) | 3.6 (1.5–7.7) | 5.4 (2.3–8.2) | 0.439 |
| Time to maximum amplitude (TMA) (min) | 20.8 (17.7–23.8) | 21.5 (18.4–24.4) | 19.6 (16.9–23.8) | 0.300 |
| At discharge (Kaolin added) | ||||
| Reaction time (R) (min) | 5.3 (3.6–7.2) | 5.9 (3.8–7.2) | 5.2 (3.6–7.3) | 0.919 |
| Kinetics (K) (min) | 1.3 (1.1–1.5) | 1.3 (1.1–1.5) | 1.2 (1.2–1.5) | 0.859 |
| Angle (°) | 72 (67–75) | 71 (68–75) | 72 (67–74) | 0.841 |
| Maximum amplitude (MA) (mm) | 78 (74–81) | 76 (75–80) | 78 (74–82) | 0.606 |
| LY30 (%) | 2.1 (0.7–4.9) | 1.8 (0.6–4.8) | 3.1 (0.9–5.2) | 0.624 |
| LY60 (%) | 5.9 (3.3–10.5) | 5.1 (3.2–9.5) | 7.3 (4.2–12.0) | 0.473 |
| Time to maximum amplitude (TMA) (min) | 20.7 (17.9–23.4) | 21.1 (17.8–23.4) | 20.2 (18.4–23.2) | 0.753 |
| At 6–8 weeks (Kaolin added) | ||||
| Reaction time (R) (min) | 5.7 (3.9–7.3) | 5.0 (3.3–7.3) | 6.6 (4.3–7.3) | 0.706 |
| Kinetics (K) (min) | 1.4 (1.1–1.7) | 1.4 (1.0–1.6) | 1.4 (1.2–1.8) | 0.490 |
| Angle (°) | 71 (66–74) | 71 (69–75) | 71 (66–74) | 0.544 |
| Maximum amplitude (MA) (mm) | 78 (75–82) | 78 (77–82) | 77 (74–82) | 0.530 |
| LY30 (%) | 2.0 (0.5–3.8) | 2.1 (0.1–3.1) | 2.0 (0.5–4.4) | 0.367 |
| LY60 (%) | 5.0 (2.4–7.5) | 5.3 (2.1–7.4) | 3.7 (2.5–7.5) | 0.786 |
| Time to maximum amplitude (TMA) (min) | 21.0 (17.4–25.8) | 21.0 (17.9–23.7) | 20.7 (17.4–25.9) | 0.858 |
Values are represented as median (interquartile range) except where are mean ± standard deviation.
LT, lysis time; OT, occlusion time. For explanation of abbreviation of TEG indices, see Table 1.
Distribution of LT at the prespecified time points is shown in Figure 2B. There was no evidence for a difference in LT between the two study arms at any of the time points (Figure 4 and Table 5).
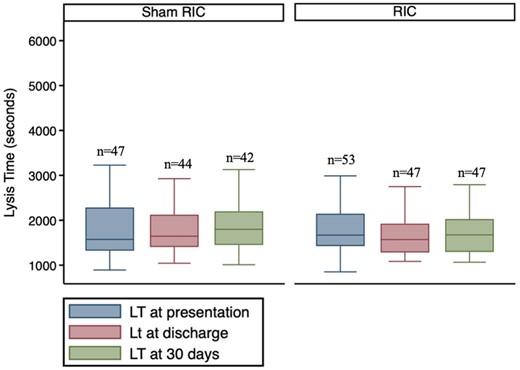
Distribution of LT at the pre-specified time points between the study arms. There was no significant difference in LT between the two study arms at any time point. Comparison made using ANCOVA.
3.2 Thromboelastography results
There was no evidence for a difference in any of the TEG indices using whole blood with or without kaolin between the two study arms at any of the time points, either with respect to coagulation parameters or indices of clot lysis (Table 5).
4. Discussion
In this small, hypothesis-generating substudy, in the group as a whole, OT was higher at discharge compared to admission, presumably reflecting reduction in platelet reactivity, due to onset of action of DAPT. However, although baseline thrombotic status at presentation was similar in patients in both RIC and sham RIC groups, patients receiving RIC exhibited significantly longer OT, representative of reduced platelet reactivity, at the time of hospital discharge compared to patients treated with sham RIC. This is, to our knowledge, the first time that RIC has been linked to reduced occlusive thrombus formation under high shear stress, in the setting of STEMI in humans.
The encouraging results of this substudy contrast with the neutral results of the main CONDI-2/ERIC-PPCI trial, in which no difference was seen between the RIC and the control groups with respect to the combined primary endpoint of cardiac death or hospitalization for heart failure at 12 months (hazard ratio 1.10; 95% CI 0.91–1.32; P = 0.32), demonstrating that RIC, applied as an adjunct to PPCI, did not improve clinical outcomes in STEMI patients. The discrepancy between the findings of our small substudy and the main trial may simply be due to the play of chance in a small sample. However, if these results are real, and RIC results in reduced platelet reactivity at 48 h post-PPCI, it would not be surprising if this in fact had no effect on outcomes. The reduction in platelet reactivity at 48 h may be too late to influence reperfusion and infarct size or to favourably impact on any reperfusion injury following PPCI. This might indicate that earlier application of such RIC may have improved outcomes, although in the main CONDI-2/ERIC-PPCI trial, there were no differences in clinical outcomes whether RIC was performed in the ambulance or in hospital. Another consideration is that platelet reactivity is a strong determinant of ischaemic outcomes, in particular in the highest risk patients. Although acute stent thrombosis is likely multifactorial in aetiology, it has been related in part to enhanced platelet reactivity, and so it is possible that a beneficial effect in reducing platelet reactivity could reduce the occurrence of acute stent thrombosis, although there was no signal for this in the main CONDI-2/ERIC-PPCI trial, where the occurrence of myocardial infarction at 30 days was similar in the RIC and sham arms. The CONDI-2/ERIC-PPCI trial excluded many patients with anterior STEMI, since these often exhibit left bundle branch block, and patients with cardiogenic shock who were unable to give consent. Patients with cardiogenic shock are not only at very high cardiovascular risk with 30–50% risk of death or recurrent ischaemic events over the subsequent 30 days, but shock can also limit the effectiveness of orally administered antithrombotic medications due to delayed drug administration, reduced gastrointestinal blood flow and motility, delayed gastric emptying, and gastrointestinal absorption28—so these patients may have the most to gain from approaches that reduce platelet reactivity. Since the effect on platelet reactivity was no longer apparent at 6–8 weeks, this may explain the lack of effect on long-term ischaemic outcomes. Whilst current guidelines advocate use of the more potent P2Y12 inhibitors ticagrelor and prasugrel in patients with STEMI,29 this also comes at a greater price of bleeding. Clopidogrel continues to be used in a significant number of acute coronary syndrome (ACS) patients in high-income countries,30 and also for financial reasons in low-income countries.31 Up to a third of ACS patients demonstrate inadequate platelet inhibition in response to clopidogrel.32 This is explained in part by polymorphisms in the gene encoding the hepatic enzyme CYP2C19, which transforms clopidogrel to its active metabolite that can result in 5–12% variation in platelet inhibition.33 There is ethnic variation in the prevalence of the loss-of-function CYP2C19 618G>A*2 allele, affecting some 30% of Caucasians and 50% of East Asians.32 Homozygotes for the CYP2C19*2 and less common CYP2C19*3 LoF alleles are poor metabolizers, and heterozygotes are intermediate metabolizers of clopidogrel, with high-on clopidogrel platelet reactivity and increased risk of adverse cardiovascular events, including acute myocardial infarction and stent thrombosis.34–36 The association of CYP2C19 genotype with increased cardiovascular risk appears greatest in those undergoing percutaneous coronary intervention, and the risk is greater in Asians than in Whites.37 Enhancing platelet inhibition with RIC in patients who are receiving clopidogrel may be particularly advantageous in such patients.
4.1 Possible mechanisms
A possible mechanism underlying the beneficial effects of RIC is a direct effect on arterial thrombus formation. In humans, marked platelet activation has been demonstrated in patients presenting with ACS38,39 and platelets have an important role not only in epicardial coronary thrombosis but also in the pathophysiology of IRI and IPC.40–42
The relationship between RIC and platelet activation is less well-explored in patients, with most knowledge derived from animal studies and healthy volunteers. In rats, RIC reduced arterial thrombus formation and embolization under direct visualization by microscopy following femoral arterial injury43 and in rodent hearts ex vivo, the extent of myocardial injury following IRI is was directly related to the activation status of platelets, with reduced infarct size in mice treated with platelet-poor plasma.41 Platelet-derived microparticles may mediate RIC, since platelet microparticles isolated from rats receiving RIC reduced the extent of cerebral infarction when transfused into recipient rats.44 In dogs subjected to coronary IRI, IPC attenuated platelet activation and aggregation17,45 and was abolished by pre-treatment with an adenosine antagonist, linking preconditioning with platelet thrombus formation.45
Studies in healthy individuals support the concept that RIC inhibits platelet activation. In healthy volunteers, the increase in the circulating concentration of platelet–monocyte aggregates associated with acute IRI was abolished by RIC.46 In normal volunteers, RIC of forearm reduced expression of neutrophil CD11b and platelet–neutrophil complexes.47 Studies in patients with cardiovascular disease are limited. In patients with stable coronary disease, RIC attenuated platelet activation in response to ADP and exercise18 and in patients with claudication, warm-up (a phenomenon akin to IPC) prior to exercise attenuated the exercise-induced increase in platelet–neutrophil and platelet–leucocyte activation.48 In patients undergoing ablation for atrial fibrillation, RIC reduced platelet activation in response to ADP, including the formation of monocyte–platelet aggregates.19 Other studies found that intermittent upper arm IR reduced platelet activation and aggregation in response to ADP in patients with stable angina undergoing angiography or elective angioplasty.49
If the effect of RIC is marked in animals, in healthy volunteers and patients with stable cardiovascular disease, why not in patients with myocardial infarction? A key difference between these cohorts is that patients with myocardial infarction receive DAPT comprising of aspirin and a P2Y12 inhibitor as part of standard of care.29 In healthy male volunteers, pre-treatment with aspirin did not influence the effect of RIC on platelet aggregation and turnover.50 However, preclinical studies indicate that P2Y12 inhibitors may have direct cardioprotective effects independent of inhibition of platelet-mediated thrombosis. In animal studies, P2Y12 inhibitors were shown to reduce infarct size in rabbits, rats and non-human primates.51–54 Furthermore, although P2Y12 inhibitors proposed to act on cardiomyocytes and up-regulate cardioprotective signalling in a manner analogous to IPC,55 these drugs failed to reduce infarct size in buffer-perfused hearts, indicating that blood, and specifically platelets, are required to confer cardioprotection.53–56 There are however some data supporting the concept that clopidogrel may reduce infarct size through the attenuation of reperfusion injury and the protective effect appeared to add to the benefit afforded by ischaemic post-conditioning.54,57 It is therefore possible that the benefits of RIC in STEMI may be attenuated by P2Y12 inhibitor treatment58,59 and one can postulate that RIC may confer greater cardioprotection in patients with persistent high on-treatment platelet reactivity.
The lack of effect of RIC on markers of coagulation in TEG are not altogether surprising. Although RIC in patients with subarachnoid haemorrhage appeared to prolong the prothrombin time and international normalized ratio after at least four sessions, values remained within normal range.55
We did not observe an effect of RIC on in vitro endogenous fibrinolysis. In patients with STEMI, pre-infarction angina (thought to provide IPC) was associated with a significant reduction in the time to achieve thrombolysis-induced reperfusion.60 This was confirmed in animal studies where recombinant tissue-type plasminogen activator-induced thrombolysis was significantly shortened in animals that received brief antecedent IPC.61 Our findings of a lack of effect of RIC on fibrinolysis is supported by a study in healthy subjects, where IRI was shown to induce fibrinolytic dysfunction evidenced by reduced tissue plasminogen activator release that could not be prevented by local IPC or RIC.62 However, global tests of fibrinolysis, such as performed here, and which give better assessment of global fibrinolytic status than factorial measures such as tissue plasminogen activator and plasminogen activator inhibitor-1 levels,20 have not been studies in either animal or human studies.
4.2 Limitations
An important limitation of our study is the small sample size. Any observed differences over time or between groups could be due to the play of chance. Furthermore, the exact timeline of effect of RIC on thrombotic status is difficult to conclude, due to the paucity of sampling times. Although a weakness of our study is that mechanistically, we cannot elucidate the cause of the reduced platelet reactivity in patients with RIC, a strength of our work is that we used tests of global thrombotic status, assessing whole blood and in particular, non-anticoagulated blood at high shear, akin to that in a stenosed coronary vessel, making the findings in vitro much more physiologically relevant, than tests on anticoagulated blood at low shear. With respect to the timing of RIC, a recent meta-analysis showed that RIC protocols that are conducted predominantly before the initiation of reperfusion as opposed to protocols with frequent RIC cycles conducted after reperfusion, conferred more cardioprotection.63 Although in the ERIC-PPCI study, the start of RIC was before reperfusion, the whole protocol was not always complete before the reperfusion occurred. Upstream start of RIC earlier in the pathway may have improved the outcomes.
5. Conclusions
Compared to sham treatment, there is a suggestion that RIC may exert a favourable effect on global thrombotic status in patients with STEMI undergoing PPCI, likely through a favourable effect on platelet reactivity. Further research is needed to delineate mechanisms through which RIC may attenuate thrombus formation at high shear stress, and to identify patients who may benefit most from this approach.
Supplementary material
Supplementary material is available at Cardiovascular Research online.
Acknowledgements
The views expressed are those of the author(s) and not necessarily those of the NHS, the NIHR, or the Department of Health. This article is based upon the work of COST Action EU-CARDIOPROTECTION (CA16225) and supported by COST (European Cooperation in Science and Technology).
Conflict of interest: D.A.G. reports institutional grants from Bristol-Myers Squibb/Pfizer and Bayer; and speaker’s bureau fees from Astra-Zeneca. D.A.G. is related through family to a company director in Thromboquest Ltd., which manufactures the Global Thrombosis Test, but neither she, nor her spouse, nor children have financial involvement or equity interest in and have received no financial assistance, support, or grants from Thromboquest Ltd. Thromboquest Ltd. had no involvement in design, conduct, or finance of this study and the instrument and disposables were obtained through a normal commercial transaction. R.K.K. and H.E.B. are shareholders in CellAegis. All other authors have declared no conflict of interest.
Funding
The ERIC-PPCI trial was funded by a British Heart Foundation Clinical Study (CS/14/3/31002) and a University College London Hospital/University College London Biomedical Research Clinical Research grant. The CONDI-2 trial was funded by Danish Innovation Foundation (11-108354 and 11-115818), Novo Nordisk Foundation (NNF13OC0007447), and TrygFonden (109624). D.J.H. was supported by the British Heart Foundation (FS/10/039/28270), National Institute for Health Research University College London Hospitals Biomedical Research Centre, Duke-National University Singapore Medical School, Singapore Ministry of Health’s National Medical Research Council under its Clinician Scientist-Senior Investigator scheme (NMRC/CSA-SI/0011/2017) and its Collaborative Centre Grant scheme (NMRC/CGAug16C006), and the Singapore Ministry of Education Academic Research Fund Tier 2 (MOE2016-T2-2-021). H.E.B. was supported by the Novo Nordisk Foundation (NNF14OC0013337, NNF15OC0016674). R.K.K. is supported by the Oxford NIHR Biomedical Centre. The research was also supported by the National Institute for Health Research (NIHR) infrastructure at Leeds.
References
ST-segment elevation myocardial infarction (STEMI) results from coronary thrombosis. Remote ischaemic conditioning (RIC) can reduce infarct size in animals, but its effects on thrombus formation are unclear. We show that in patients with STEMI, the time to in vitro thrombotic occlusion was longer in patients receiving RIC than sham at 48 h, but this was no longer apparent at 6–8 weeks. There was no difference in coagulation or endogenous fibrinolysis between RIC and sham groups. The short-term reduction in platelet reactivity by RIC may be useful in individuals with enhanced platelet reactivity to reduce the propensity for further thrombosis.
