


Abstract
Salt-sensitive (SS) hypertension is accompanied by impaired vasodilation in the systemic and renal circulation. However, the causal relationship between vascular dysfunction and salt-induced hypertension remains controversial. We sought to determine whether primary vascular dysfunction, characterized by a failure to vasodilate during salt loading, plays a causal role in the pathogenesis of SS hypertension.
Mice selectively expressing a peroxisome proliferator-activated receptor γ dominant-negative mutation in vascular smooth muscle (S-P467L) exhibited progressive SS hypertension during a 4 week high salt diet (HSD). This was associated with severely impaired vasodilation in systemic and renal vessels. Salt-induced impairment of vasodilation occurred as early as 3 days after HSD, which preceded the onset of SS hypertension. Notably, the overt salt-induced hypertension in S-P467L mice was not driven by higher cardiac output, implying elevations in peripheral vascular resistance. In keeping with this, HSD-fed S-P467L mice exhibited decreased smooth muscle responsiveness to nitric oxide (NO) in systemic vessels. HSD-fed S-P467L mice also exhibited elevated albuminuria and a blunted increase in urinary NO metabolites which was associated with blunted renal blood flow and increased sodium retention mediated by a lack of HSD-induced suppression of NKCC2. Blocking NKCC2 function prevented the salt-induced increase in blood pressure in S-P467L mice.
We conclude that failure to vasodilate in response to salt loading causes SS hypertension by restricting renal perfusion and reducing renal NO through a mechanism involving NKCC2 in a mouse model of vascular peroxisome proliferator-activated receptor γ impairment.

1. Introduction
Human subjects carrying dominant-negative mutations in the gene encoding peroxisome proliferator-activated receptor γ (PPARγ), which interfere with ligand-mediated activation of PPARγ, develop early-onset severe hypertension.1 Mice selectively expressing a human hypertension-causing mutation in PPARγ (P467L) in vascular smooth muscle (termed S-P467L) recapitulate human hypertension, suggesting that PPARγ regulates blood pressure via vascular mechanisms.2 Consistent with this, the PROspective pioglitAzone Clinical Trial In macroVascular Events (PROactive) provided evidence of a reduction in mortality and other cardiovascular events in high-risk patients treated with the PPARγ agonist pioglitazone.3 We previously provided compelling evidence that PPARγ regulates blood pressure via its vascular actions that modulate (i) endothelial nitric oxide (NO) bioavailability,4,5 (ii) vasodilatory response to NO in vascular smooth muscle,6 and (iii) intracellular signals controlling vasoconstriction of vascular smooth muscle.2,7,8 Thus, loss of vascular PPARγ activity may promote vascular dysfunction and hypertension. However, whether vascular PPARγ activity can regulate renovascular function and salt sensitivity of blood pressure is largely unknown.
A hallmark of salt-sensitive (SS) hypertension is impaired vasodilation in the periphery during excessive salt intake.9 The phenomena that salt-resistant (SR) and SS humans exhibit distinct vascular responses in the forearm during dietary salt challenge was initially observed by Mark et al.10 >40 years ago. In normotensive SR subjects, high salt intake induces forearm vasodilation and little change in arterial pressure; while in SS subjects excess salt increases vasoconstriction resulting in decreases in forearm blood flow and significant elevations in arterial pressure.10 Importantly, both groups exhibit similar decreases in renin and aldosterone in response to high sodium intake, suggesting the different vascular responses are independent of the renin–angiotensin–aldosterone system.10 Moreover, the salt-induced elevations in arterial pressure in SS humans or animal models are not mediated by larger cardiac output (CO) compared to SR cohorts in the acute phase of salt loading (3–7 days).11–13 Therefore, vasodilation in response to salt loading may be an important compensatory mechanism that is lost in SS hypertension. However, this vasodilation hypothesis remains controversial.9,14
Approximately 25% of the arterial blood flow enters the renal circulation. Renal vascular dysfunction plays a pivotal role in salt sensitivity and in the pathogenesis of salt-induced hypertension.15 For example, during high salt intake, renal blood flow (RBF) increases in SR humans but decreases in SS hypertensive subjects.16 Likewise, Dahl SR rats exhibit renovascular dilation and decreased renal vascular resistance in response to excess salt intake, whereas Dahl SS rats fail to vasodilate in the renal vasculature resulting in significantly higher renal vascular resistance than the SR controls.17 Consistent with this, Dahl SS rats with high salt intake exhibit reductions of medullary blood flow and develop SS hypertension, while renal intramedullary infusion of l-arginine preserves medullary blood flow and prevents the development of SS hypertension.18 Similarly, preservation of RBF also prevents sodium retention and diminishes angiotensin II-induced hypertension in mice lacking type 1 A angiotensin receptor in smooth muscle cells.19 Thus, an abnormal renal haemodynamic adaptation may be causal in the pathogenesis of SS hypertension.
Using S-P467L mice as a model of PPARγ impairment in vascular smooth muscle, we provide evidence supporting the premise that failure to vasodilate in systemic blood vessels precedes salt-induced arterial pressure elevation. We further show that the failure to vasodilate in the renal vasculature impairs RBF, which was associated with blunted urinary NO metabolites, decreased diuretic/natriuretic capacity, and increased sodium retention and renal injury during chronic high salt diet (HSD). Our study shows for the first time that PPARγ activity in vascular smooth muscle cells may be a determinant in the pathogenesis of SS hypertension.
2. Methods
2.1 Experimental animals
All protocols were approved by the University of Iowa and Medical College of Wisconsin Animal Care and Use Committees. Care of the mice used in this study met the standards set forth by the National Institutes of Health (NIH) guidelines. Transgenic mice selectively expressing a human hypertension-causing mutation in PPARγ (P467L) in vascular smooth muscle (S-P467L) were previously described.2 S-P467L mice were maintained by successive generations of backcross breeding to C57BL/6J mice. Non-transgenic (NT) littermates were used as negative controls. Most of the experiments were performed at the University of Iowa, where at baseline, all mice were maintained on a laboratory rodent chow diet containing 0.3% sodium or 0.8% salt (the NIH-31 Modified Open Formula Mouse/Rat Sterilizable Diet, Teklad Catalog No. 7013). In an initial trial, both male and female S-P467L mice received a HSD containing 4% sodium chloride or 1.57% sodium (Teklad Catalog No. TD. 03095) for 8 weeks. While the male S-P467L mice exhibited augmented vasocontraction and severely impaired vasodilation, the female transgenic mice seemed to be protected from HSD-induced vascular dysfunction (see Supplementary material online, Figure S1). Therefore, we focused on male mice in the present article. The mechanism of gender differences will be examined in a future study. NT and S-P467L mice had similar body weight, food intake, faeces weight, water intake, and urine excretion at baseline (see Supplementary material online, Table S1). HSD decreased 24 h food intake and faeces weight in NT mice, but this was not significant in S-P467L mice. Both strains exhibited comparable increases in daily water intake and urine volume on HSD.
We recorded blood pressure and heart rate using radiotelemetry for 2–6 days at baseline and for 24–48 h at the end of each week (Figure 1A). Because salt-induced hypertension in S-P467L mice reached a plateau in Week 3 (SBP: 133.0 ± 2.9 mmHg in Week 3 vs. 134.5 ± 2.2 mmHg Week 4), Week 3 and Week 4 were considered comparable time points and some survival procedures including echocardiogram, vascular ultrasound, and metabolic cages were performed in Week 3. All 24 h BP data are plotted starting at 12 pm and ending at 12 pm with the first and last points being the same. However, the duplicated 12 pm values were not employed in the statistical analysis. In a separate cohort of mice without implanted radiotelemetry transmitters, CO and RBF were monitored with ultrasound at baseline and/or on Day 21. An acute natriuretic challenge experiment was performed to assess the diuretic/natriuretic function in Week 4. Vascular function and plasma renin concentrations were measured in terminal procedures.
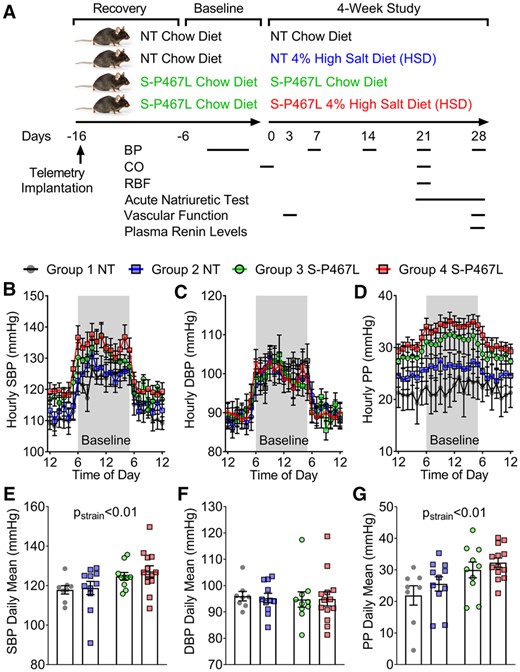
Experimental design and baseline blood pressure. (A) Schematic flow chart illustrating experimental design. (B–G) Blood pressure was measured by radiotelemetry. The different colours indicate the corresponding groups in panel (A). The average of baseline blood pressure was consolidated to hourly means and daily means (n = 8–13). (B and E) Systolic blood pressure; (C and F) diastolic blood pressure; and (D and G) pulse pressure. Data are presented as mean ± SEM. Two-way ANOVA with repeated measurements was employed to analyse hourly data and two-way ANOVA was performed for daily means. Tukey’s multiple comparison tests were conducted for between-group comparisons. Pstrain<0.01 indicates the effect of strain in two-way ANOVA and reflects the combinations of groups 1 + 2 and 3 + 4.
To isolate vessel segments for ex vivo vascular function studies, mice were euthanized with an overdose of pentobarbital-based veterinary euthanasia solution (150 mg/kg, i.p injection in 0.1 mL volume). In experiments not involving ex vivo vascular studies, mice were euthanized with CO2 inhalation.
2.2 Statistics
All results were expressed as mean ± SEM. Statistical analysis of the data was performed using GraphPad Prism 8.3. Weekly and hourly time course data of blood pressure, heart rate, and urinary nitrate/nitrite levels, as well as vascular function data were analysed by two-way ANOVA with repeated measurements. To analyse repeated measures data with missing values, the mixed effects model was used, which is included in the GraphPad Prism 8.3 package. Mean data of plasma renin, blood pressure, urine albumin, heart rate, pulse wave velocity, power spectral analysis, metabolic cage study, echocardiogram, renal sympathetic nerve activity, vascular ultrasound, and gene expression were analysed by two-way ANOVA. Tukey’s multiple comparison procedures were performed for pairwise comparisons. A P-value <0.05 was considered significant.
Measurement of blood pressure and heart rate, power spectral analysis, renal sympathetic nerve activity, pulse wave velocity, CO, RBF and resistance index, sodium and urinary nitrate/nitrite, acute diuretic/natriuretic challenge, western blot, flow cytometry albuminuria, plasma renin, and vascular function are described in the Supplementary material online.
3. Results
3.1 HSD elevated blood pressure in S-P467L mice
All mice exhibited a normal circadian blood pressure rhythm at baseline (Figure 1B) and at the end of the 4 week study (Figure 2). At baseline (before HSD), S-P467L mice exhibited a mild elevation of SBP and pulse pressure, but not mean blood pressure (MBP) or diastolic blood pressure (DBP) replicating our previous findings (Figure 1B–G and see Supplementary material online, Figure S2A and B).2 Blood pressure in chow-fed NT and chow-fed S-P467L mice was stable throughout the study (Figure 2A and B and see Supplementary material online, Figure S2). Although there was a trend, there was no statistically significant difference in SBP or DBP in NT mice-fed either chow or HSD (Figure 2A and B).

Blood pressure, urine albumin, and plasma renin. (A–C) Blood pressure was measured by radiotelemetry at baseline and weekly during the 4 week study (n = 8–13). Weekly mean values of systolic blood pressure (SBP, A) and diastolic blood pressure (DBP, B) were displayed throughout the study (left). Blood pressure at the end of Week 4 is shown as hourly means (middle) and daily means (right). (C) Daily means of pulse pressure (PP) in Week 4. (D) Urine albumin (n = 8–12) as indicated as individual data points, and (E) plasma renin levels (n = 5–6, as individual data points) were determined using ELISA at the end of the study as described in methods. Data are plotted as mean ± SEM. Weekly means were analysed by two-way ANOVA with repeated measurements (RM), while daily blood pressure means, albuminuria and plasma renin by two-way ANOVA. Tukey’s multiple comparison procedures were performed for pairwise comparisons. *P < 0.05, HSD vs. chow diet; #P < 0.05, S-P467L HSD vs. NT HSD; †P < 0.05, S-P467L chow diet vs. NT chow diet.
HSD increased SBP (Figure 2A), MBP (see Supplementary material online, Figure S2A), and pulse pressure (Figure 2C) as time progressed in S-P467L mice. There was no change in DBP in response to HSD in S-P467L mice (Figure 2B). The increase in blood pressure in response to HSD in S-P467L was progressive. Two-way ANOVA of the Week 4 blood pressure data revealed that SBP and MBP were not statistically different in NT mice-fed chow or HSD (Figure 2A, right panel, see Supplementary material online, Figure S2C). However, HSD-fed S-P467L mice exhibited significantly elevated SBP (S-P467L HSD 134.6 ± 2.2 vs. S-P467L chow 121.4 ± 3.5 mmHg) and MBP (116 ± 2.1 vs. 108 ± 2.6 mmHg) compared to chow-fed S-P467L mice in Week 4. The increase in SBP and PP, but not DBP in Week 4 suggests the S-P467L mice exhibited isolated systolic hypertension. Consistent with this, S-P467L mice-fed HSD exhibited increased pulse wave velocity compared to HSD-fed NT controls, suggesting increased arterial stiffness (see Supplementary material online, Figure S2D).
HSD-fed S-P467L mice also exhibited increased left ventricular mass on Day 21 as determined by echocardiogram and elevated heart weight/body weight ratio measured post-mortem after Week 4, suggestive of cardiac hypertrophy (see Supplementary material online, Table S2). Moreover, HSD induced a marked albuminuria in S-P467L mice but not NT controls, indicative of hypertension-related renal injury (Figure 2D). Interestingly, HSD suppressed circulating renin similarly in both control and S-P467L mice at the end of 4 weeks (Figure 2E). Thus, any differential effects of salt cannot be accounted for by changes in the circulating renin–angiotensin system.
3.2 Increased SBP in S-P467L mice is not mediated by increased CO
Blood pressure is determined by CO and total peripheral vascular resistance (PVR). To assess CO, we performed echocardiogram in lightly sedated animals at baseline and at the end of Week 3.20 All four groups of mice together exhibited significantly larger end-diastolic volume, but not end-systolic volume, at Week 3 compared to baseline. Because of this, stroke volume and CO also appeared to be elevated in Week 3 when all mice were analysed as one group (effect of time in two-way ANOVA repeated measurements). However, when data were analysed cross-sectionally, there was no difference among the four groups in end-diastolic volume, end-systolic volume, stroke volume, CO, or ejection fraction regardless of strain or diet at either time point (see Supplementary material online, Table S2). The equivalent CO in Week 3 supports the conclusion that salt-induced hypertension in S-P467L mice was not driven by differences in CO, but by increased vascular resistance.
3.3 S-P467L mice exhibited impaired vasodilation in response to HSD
To assess vascular function, we first performed wire myograph studies in the carotid artery. We previously showed that vasodilation in the carotid artery of S-P467L mice is sensitive to smooth muscle-specific PPARγ impairment.6 Chronic HSD did not alter vasoconstriction to KCl, 5-HT, and endothelin-1 in the carotid arteries of NT mice (see Supplementary material online, Figure S3). Chow-fed S-P467L mice exhibited enhanced vasoconstriction to these agonists as previously reported.2,6,7 However, salt did not further enhance vasoconstriction to these agonists, perhaps suggesting the contractile machinery was already functioning at its maximal capacity.
At the end of the study, carotid artery isolated from HSD-fed NT mice exhibited normal vasodilation responses to the endothelium-dependent agonist acetylcholine (ACh) and a NO donor sodium nitroprusside (SNP) compared to those of chow-fed NT mice (Figure 3A and B). This suggested that NT mice preserved their endothelial-dependent and endothelial-independent vasodilation capacity after chronic salt exposure. In contrast, chow-fed S-P467L mice exhibited moderate impairment in ACh-induced and SNP-induced vasodilation, which was markedly exacerbated in response to chronic HSD. The HSD-induced worsening of the ACh response was particularly pronounced in basilar artery, a cerebral resistance vessel that controls blood flow to the brain, in response to chronic HSD (see Supplementary material online, Figure S4). We performed flow cytometry to assess evidence of vascular inflammation. Chronic HSD induced a significant increase in aortic macrophages (F4/80+) in all mice-fed HSD, and a trend towards increased total leucocytes (CD45+) and T lymphocytes (CD3+) in the aortas of S-P467L mice (see Supplementary material online, Figure S5). Although we cannot rule out the contribution of augmented vasoconstriction or vascular inflammation, these data suggest that salt-induced increase in blood pressure in the S-P467L mice was more likely to be caused by a decline of vasodilation capacity as a result of decreased smooth muscle responsiveness to NO.

Vasodilation in response to high salt diet. (A and B) Isometric tension was initially measured with wire myography in carotid artery (n = 4–8) at the end of the study. (C and D) In separate mice, we performed wire myography in renal segmental artery at the end of 4 weeks (n = 6–9). (E and F) Vasodilation was also tested in carotid artery after HSD for 3 days (n = 4–5). The top row shows cumulative concentration-response curves for acetylcholine (ACh) and the lower row shows responses to sodium nitroprusside (SNP). Data are plotted as mean ± SEM. Two-way ANOVA RM was performed for statistical analysis. *P < 0.05, S-P467L HSD vs. NT HSD. #P < 0.05, S-P467L HSD vs. S-P467L chow diet. †P < 0.05, S-P467L chow diet vs. NT chow diet.
In accord with findings in the carotid artery, HSD-induced worsening of ACh response was also observed in renal segmental arteries, first-order renal artery branches (Figure 3C). Interestingly, the impairment in SNP responses in the renal vessels was of lesser magnitude than the other vessels studied (Figure 3D). Thus, chronic salt induced systemic vascular dysfunction that was characterized by impaired vasodilation. It is notable that this salt-induced decline in vasodilatory function was evident after just 3 days of HSD (Figure 3E and F), before the onset of salt-induced increases in blood pressure. This suggests the early impairment in vasodilation may initiate salt-induced hypertension.
3.4 Heart rate and sympathetic nerve activity
Salt has been shown to evoke central sympathoexcitation and sympathetic outflow by activating osmolality-sensing neurons in the brain.21,22 To determine whether the blood pressure and vascular phenotypes were driven by increased sympathetic nerve activity elicited by HSD, we first analysed heart rate data from radiotelemetry recordings. S-P467L mice exhibited higher heart rate than NT controls at baseline as evidenced by the higher weekly means, hourly means, and daily means of heart rate (see Supplementary material online, Figure S6A and B). This is due to an impaired afferent limb of the baroreflex arc in the S-P467L mice as we previously described.23 There was a decreasing trend in heart rate over the 4 week study period regardless of strain or diet. At the end of Week 4, the heart rate of S-P467L mice remained elevated compared to NT controls regardless of diet (see Supplementary material online, Figure S6C and D). Despite the HSD-induced increase in SBP in HSD-fed S-P467L mice, heart rate was not significantly different from chow-fed S-P467L mice.
We next performed power spectral analysis of heart rate variability and arterial pressure variability in Week 4. The low frequency (LF) to high frequency (HF) ratio in heart rate variability (LF/HF) is often used as an indicator of the sympathetic nerve activity to the heart.23–25 Interestingly, chow-fed and HSD-fed S-P467L mice together exhibited a trend towards increased LF/HF compared with all NT mice analysed as one group (effect of strain in two-way ANOVA), while there was no effect of diet (see Supplementary material online, Figure S6E). Of note, LF/HF did not further increase in HSD-fed S-P467L mice, suggesting that the HSD-induced increase in blood pressure in S-P467L mice was not likely to be caused by an increase in cardiac sympathetic nerve activity. In contrast, HSD induced a trend towards increases in the LF component of arterial pressure variability in both NT and S-P467L mice-fed HSD, suggesting that HSD may increase sympathetic activity in vascular tone regulation.24 In keeping with this, all mice-fed HSD exhibited increased renal sympathetic nerve activity, but there was no difference comparing S-P467L to NT (see Supplementary material online, Figure S6F). Therefore, salt-induced increases in sympathetic nerve activity were not sufficient on their own to alter blood pressure or vascular function.
3.5 Renal mechanisms
To determine whether salt-induced impairment in vasodilation affected renal perfusion, we measured renal artery resistance index and RBF to the right kidney using vascular ultrasound. The right renal artery was selected because it is technically more accessible to study. In mice anesthetized with isoflurane, the abdominal aorta, right renal artery, and the right kidney were identified under ultrasound allowing the measurement of luminal diameter (µm) and blood flow velocity (mm/s) which was used to calculate renal artery resistance index and RBF (Figure 4A). In NT mice, HSD trended to increase renal artery luminal diameter, decrease right renal artery resistance index, and significantly increased RBF (Figure 4B–D). The increase in RBF observed in NT mice in response to HSD was absent in S-P467L mice (Figure 4D). These data suggest that a failure of the renal artery to vasodilate in HSD-fed S-P467L mice may have blunted RBF and restricted renal perfusion.

Renal artery resistance index and renal blood flow. (A) Representative images captured by vascular ultrasound showing the abdominal aorta, the right renal artery, and the right kidney. Renal blood flow (RBF) was calculated using luminal diameter and blood flow velocity of the renal artery as indicated by the formula as indicated. (B–D) Luminal diameter (μm), resistance index, and normalized mean renal blood flow (μL/min/g) of the right renal artery. Resistance index was calculated as (Vsystole−Vdiastole)/Vsystole. Data are plotted as mean ± SEM (n = 7–14) as individual data points. Data were analysed with two-way ANOVA with Tukey’s multiple comparison procedures. *P < 0.05 NT HSD vs. NT chow diet. The effect of strain on resistance index is indicated by Pstrain.
To determine whether the blunted RBF was related to renal sodium retention, we placed mice in metabolic cages during the baseline period and during Week 3 and quantified dietary sodium ingestion () and urinary sodium excretion () to compute the apparent sodium retention (Δ). At baseline, the four groups had similar sodium ingestion, urinary sodium excretion, and Δ (Figure 5A). Sodium ingestion increased similarly in NT and S-P467L mice compared to those consuming chow diet during Week 3 of HSD, but S-P467L mice tended to excrete less sodium than NT controls. As a result, S-P467L mice on HSD exhibited a larger increase in Δ than NT mice on HSD, while the mice on chow diet exhibited values comparable to baseline. This suggested HSD-fed S-P467L mice may exhibit increased sodium retention.
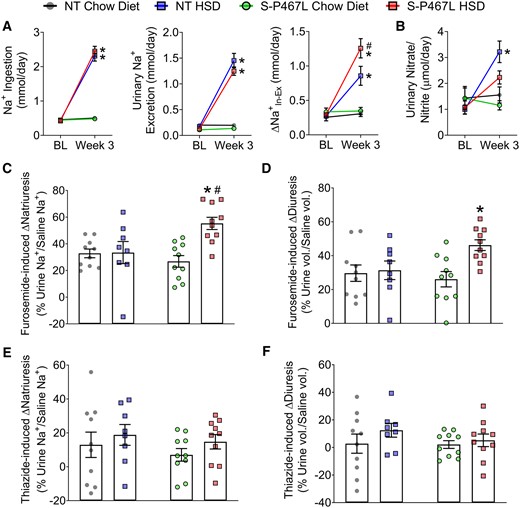
Renal function. (A) Sodium ingestion and urinary sodium excretion were measured in metabolic cages to determine Δ at baseline and by Week 3 (n = 6–8). (B) Urinary nitrate and nitrite levels (n = 6–8). (C–F) In separate cohort of animals, a single i.p. injection of normal saline equal to 10% of body weight was administered on Day 21 without diuretics, repeated on Day 24 with furosemide (20 mg/kg), and repeated again on Day 27 with hydrochlorothiazide (40 mg/kg), respectively. Sodium excretion and urine volume in the subsequent 4 h following each injection was monitored and plotted as percentages of saline sodium and volume injected in Supplementary material online, Figure S7 (n = 8–10). Furosemide (C and D) and thiazide (E and F) induced increases in natriuresis and diuresis were calculated from Supplementary material online, Figure S7. Data are plotted as mean ± SEM. *P < 0.05 HSD vs. chow diet. #P < 0.05, S-P467L HSD vs. NT HSD.
In SR normal humans and wild type animals, dietary salt induces NO production in the kidney which increases RBF via its vasodilatory effects and promotes diuresis/natriuresis via direct actions in the renal tubules.26–30 A hallmark of SS hypertension is a decrease in renal NO bioavailability.28,29 To determine whether the salt sensitivity in S-P467L mice was associated with decreased renal NO bioavailability, we measured NO metabolites in 24 h urine samples collected in Week 3. In NT and S-P467L mice receiving chow diet, the urinary nitrate/nitrite levels were comparable at baseline and in Week 3. Salt induced more than a three-fold increase in urinary nitrate/nitrite levels in NT mice, but this response was blunted in S-P467L animals (Figure 5B).
It is established that intrarenal NO inhibits tubular sodium transport and promotes natriuresis and diuresis.26,27 To directly assess natriuresis and diuresis function, we performed an acute sodium/volume challenge test during Week 4.27,31 Mice were injected a bolus of saline equal to 10% of body weight and urine was collected over the next 4 h. Chow-fed NT mice and S-P467L mice excreted ∼60% of the sodium and volume injected (see Supplementary material online, Figure S7A and B). This acute natriuretic/diuretic capacity was not altered in NT mice on HSD but was impaired in S-P467L mice on HSD. The impaired natriuretic and diuretic capacity in HSD-fed S-P467L mice was corrected by furosemide (20 mg/kg, i.p. injection, see Supplementary material online, Figure S7A and B). Consistently, furosemide-induced increases in natriuresis and diuresis were markedly larger in HSD-fed S-P467L mice (Figure 5C and D). In comparison, hydrochlorothiazide (40 mg/kg) modestly improved natriuresis in HSD-fed S-P467L mice (see Supplementary material online, Figure S7A, red bars, thiazide vs. no diuretics), although it remained significantly lower than HSD-fed NT mice treated with thiazide (see Supplementary material online, Figure S7A, red bar vs. blue bar). However, thiazide-induced increases in natriuresis were not different among groups (Figure 5E). Moreover, thiazide induced minimal changes in diuresis (Figure 5F) and did not improve diuresis in HSD-fed S-P467L mice (see Supplementary material online, Figure S7A, red bars, thiazide vs. no diuretics). Interestingly, HSD markedly suppressed the levels of both cortical Na+-Cl− cotransporter (NCC) and medullary Na+-K+-2Cl− cotransporter (NKCC2) protein in kidneys of NT controls. However, this HSD-induced suppression of NCC and NKCC2 was not observed in S-P467L mice (Figure 6 and see Supplementary material online, Figure S8).
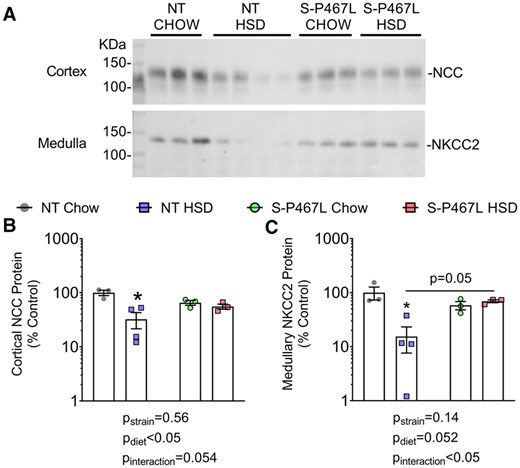
Western-blot analysis of NCC and NKCC2. Kidneys were harvested at the end of 4 weeks, cortex and medulla were manually separated and homogenized. Protein concentration was determined using the BioRad DC assay and adjusted for loading by densitometric quantitation of total protein after running on a 4–12% bis–tris acetate gel and Coomassie staining (shown in Supplementary material online, Figure S8). (A) Western blotting for NCC and NKCC2 was performed by loading 20 μg adjusted protein on additional gels following the protocol described in Methods. Cortex was blotted with anti-total NCC antibody (1:6000), while medulla was blotted with anti-total NKCC2 antibody (1:1000) on different gels. (B and C) Densitometry data were plotted on a Log scale and Log transformed data were analysed with two-way ANOVA (bottom panels, n = 3–4). The effects of strain, diet, and interaction were indicated in graphs. *P < 0.05 NT HSD vs. NT chow.
To determine the contribution of these sodium transporters in the hypertension phenotypes, we next tested the blood pressure-lowering effects of furosemide (20 mg/kg, a single i.p. injection) and hydrochlorothiazide (300 mg/L drinking water) during Weeks 5–6 in mice implanted with radiotelemetry transmitters. We recorded SBP at two time points, 24 h prior to (solid symbols) and 24 h following (open symbols) furosemide injection (Figure 7A and B). A single dose of furosemide induced a marked decrease in SBP in S-P467L mice-fed HSD, but not in NT controls or chow-fed S-P467L mice. Furosemide-induced decreases in SBP (ΔSBP) were calculated as differences between corresponding time points before and after furosemide injection (Figure 7C). The hourly ΔSBP induced by furosemide in HSD-fed S-P467L mice was significantly larger than those in chow-fed S-P467L mice or HSD-fed NT controls (Figure 7C). The hourly ΔSBP was further consolidated into daily means (Figure 7D). The blood pressure-lowering effect of furosemide was much more pronounced in HSD-fed S-P467L mice in comparison to chow-fed S-P467L mice (−12 ± 2.6 mmHg vs. −0.2 ± 1.5 mmHg). In contrast, there was no change in SBP in response to HCTZ (Figure 7E). To rule out possible interference between the two drugs, we administered HCTZ to an additional cohort of mice not previously exposed to furosemide. Again, HCTZ did not induce significant changes in SBP regardless of diet or genotype (see Supplementary material online, Figure S9). Together, these data suggest that a lack of HSD-induced suppression of NKCC2 may be mediating the sodium retention and salt-induced hypertension in HSD-fed S-P467L mice.
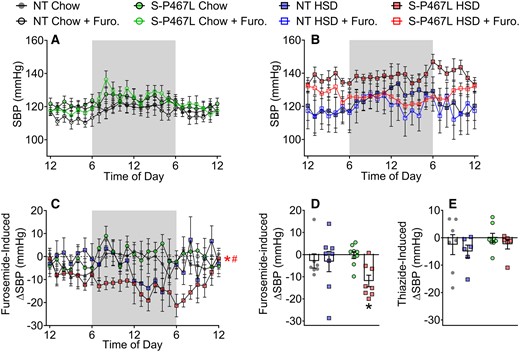
Blood pressure responses to diuretics. A subset of mice in Figure 1 were treated with a single dose of furosemide at 20 mg/kg via i.p. injection in Week 5. (A and B) The average of SBP 24 h prior to (solid symbols) and 24 h following (open symbols) the injection were recorded. (C and D) Furosemide-induced decreases in blood pressure were calculated as differences between the solid curves and open curves and were presented as hourly means (C) and daily means (D). (E) After a 7 day washout period, the same animals received hydrochlorothiazide (300 mg/L) in drinking water for 5 days in Week 6. The differences of SBP before and after the thiazide treatment were calculated and presented as daily means. Data in panels (A–D) are N = 7–9 per group. Data in Panel (E) are N = 6–8 per group as indicated by individual data points. Data are plotted as mean ± SEM. Hourly ΔSBP was analysed by two-way ANOVA RM. Daily means of ΔSBP were analysed with two-way ANOVA with Tukey’s multiple comparison procedures. *P < 0.05, S-P467L HSD vs. S-P467L chow diet; #P < 0.05, S-P467L HSD vs. NT HSD.
4. Discussion
Hypertension affects an estimated 103 million US adults, exposing nearly half of the adult population to increased risk for myocardial infarction, stroke, and renal failure.32 Contributing to the soaring prevalence of hypertension is the growing population of patients with type 2 diabetes and metabolic syndrome, who often display decreased PPARγ activity and increased salt sensitivity.33,34 Conversely, PPARγ activation in response to thiazolidinediones consistently lowers blood pressure in type 2 diabetes and obesity, suggesting that loss of PPARγ activity may be causal.3,35 A hallmark of SS hypertension in humans is the failure to vasodilate in response to excessive salt intake.9–11 In the present study, we have shown that vascular smooth muscle PPARγ is required for appropriate vasodilatory responses in systemic and renal arteries during HSD. Vascular smooth muscle-specific expression of a dominant-negative PPARγ mutation (P467L) resulted in a failure to vasodilate in systemic and renal vasculature in response to HSD. The impaired vasodilation in systemic vessels preceded the salt-induced blood pressure elevations and may contribute to hypertension through increased total PVR. The impaired vasodilation in renal arteries likely restricted RBF during salt loading and was associated with blunted urinary NO metabolites, decreased capacity to excrete a sodium/volume load, and enhanced sodium retention. Impaired renal perfusion and increased renal sodium/water retention may have altered the pressure-natriuresis function in the S-P467L mice-fed HSD. Thus, we conclude that the failure to vasodilate in response to HSD alters systemic vascular function and renal haemodynamics and may play a role in increased blood pressure caused by HSD.
We observed salt-induced vascular dysfunction in male S-P467L mice, but not in female littermates, suggesting a sexual dimorphism in vascular actions of PPARγ. This is not the first time that we observed sex differences in PPARγ physiology. In a recent publication, we showed that endothelial PPARγ protects against angiotensin-II-induced oxidative stress and endothelial dysfunction in adult offspring born from pregnancies complicated by hypertension.36 The protective effects were more prominent in male offspring, consistent with observations in the present study. Moreover, several population studies have identified sex-dependent associations between PPARγPro12Ala polymorphism and obesity, cognitive function, and longevity.37–39 Future studies are necessitated to reveal the mechanism of sex differences in PPARγ biology and these observations reiterate the importance of considering sex as a critical biological variable.
Salt did not augment vasoconstriction but selectively caused a further loss of vasodilation in S-P467L animals, suggesting that the salt sensitivity observed in S-P467L mice was associated with the vasodilatory function, although the contribution of vasoconstriction cannot be ruled out. The effect of impaired vasodilation seems to be bi-phasic in the development of SS hypertension. In the acute phase of salt loading (within 3–7 days), SR humans exhibit marked vasodilation and immediate decreases in PVR which blunts arterial pressure elevation.11 This phenomenon is absent in SS humans such that there is either no decrease in PVR or in some cases an increase in PVR during acute salt loading.9–11 The distinct PVR responses to acute salt loading are the direct cause of the divergent blood pressure changes in SR and SS subjects, as both groups exhibit similar increases in body weight, CO, and cumulative sodium balance.11 Consistent with this concept, a loss of vasodilation was observed in S-P467L mice after only 3 day HSD, which occurred concomitantly with the initial increase in SBP in S-P467L mice-fed HSD. During the chronic phase of HSD (Week 3 and Week 4), NT mice preserved their vasodilation function and exhibited a compensatory increase in RBF. In contrast, the severely impaired vasodilation in renal vessels of S-P467L mice eliminated the compensatory increase in RBF, which was associated with enhanced sodium retention and progressive increase in blood pressure. Thus, our results suggest that impaired vasodilation may portend salt-induced hypertension through systemic haemodynamic changes in the acute phase and renal mechanisms in the chronic phase.
Notably, although salt impaired vasodilation in both systemic and renal vessels, the mechanisms seem to be distinct. Salt caused a further loss of vasodilatory responses to endogenous or exogenous NO in the carotid artery of S-P467L mice, indicative of decreased smooth muscle responsiveness to NO in systemic vessels. However, in renal segmental artery of S-P467L mice, salt selectively impaired vasodilation induced by ACh, but not by SNP (an exogenous NO donor), suggesting that salt-induced renovascular dysfunction was mediated by blunted production of endogenous NO. In keeping with this, we observed blunted renal NO production in S-P467L mice on HSD as evidenced by blunted urinary NO metabolites compared to NT mice on HSD.
In addition to its essential role in vasodilation, NO also promotes natriuresis and diuresis via direct actions in the renal tubule.26 In isolated thick ascending limb, NO inhibits the activity of NKCC2 by increasing cyclic guanosine monophosphate (cGMP) through soluble guanylate cyclase and cGMP-stimulated phosphodiesterase II (PDE II) which in turn decreases cAMP levels.40 The natriuretic effect of NO has also been demonstrated in vivo as NO produced by intrarenal macrophages via NOS2 suppresses NKCC2 activity and limits angiotensin II-induced hypertension.27 Consistent with this, the blunted urinary NO metabolites in HSD-fed S-P467L mice was associated with a decline in natriuretic/diuretic capacity which was corrected by pharmacological inhibition of NKCC2. Moreover, furosemide but not thiazide lowered blood pressure in HSD-fed S-P467L mice, strongly suggesting that a lack of HSD-induced suppression of NKCC2 may underlie enhanced sodium retention and augmented hypertension in this model.
The increase in urinary nitrate/nitrite excretion is inversely correlated with the increase in arterial pressure during HSD in human studies, suggesting the salt sensitivity may be related to blunted generation of endogenous NO in the kidney.41 All three isoforms of NO synthase exist in the kidney. NO generation in vascular endothelium (NOS3) and tubular epithelium (NOS1) is flow-mediated,42,43 while vascular smooth muscle and intrarenal macrophages produce NO via NOS2.27,44 Because NO is electrically neutral and diffuses across membranes freely, decreased NO production in one cellular compartment may cause an NO deficiency in other cell types in proximity. In SS human subjects, decreased renal NO bioavailability may occur as a result of decreased NOS expression, decreased NOS activation, decreased bioavailability of NOS substrate/cofactor, or oxidative stress.9 HSD did not increase renal superoxide or urinary 8-isoprostane, a biomarker of oxidative stress, in NT or S-P467L mice (data not shown), suggesting decreased NO bioavailability is not associated with renal oxidative stress. As mentioned above, the different responses to ACh and SNP in renal arteries suggest there is decreased endothelial bioavailability of NO in S-P467L mice on HSD. Moreover, because NO generation is flow-mediated,45 further studies are warranted to determine whether decreased renal NO bioavailability occur as a result of blunted RBF or tubular urine flow.
4.1 Perspectives
Although global PPARγ activators have been shown to cause fluid retention in congestive heart failure, these effects are mediated by sodium retention in the renal tubule,46 not by vascular actions of PPARγ. Despite the renal effects, pioglitazone dissociated blood pressure response to salt and abolished salt sensitivity in SS diabetic and hypertensive individuals,46 suggesting that the vascular actions of PPARγ overweighs its effects in the renal tubule. In our study, the dominant-negative PPARγ P467L mutation was selectively expressed in the vascular smooth muscle, not in renal tubules. Thus, the resultant impairment of vasodilation and salt sensitivity in S-P467L mice cannot be explained by any change in PPARγ signalling in the renal tubule. Instead, we have provided mounting evidence supporting the essential role of PPARγ in blood pressure regulation through its regulation of vasocontraction and vasodilation.2,4–8 These experimental and clinical observations demonstrate the multi-faceted roles of PPARγ signalling and the necessity to design new therapies that selectively utilize the protective effects of PPARγ, while minimizing the potential adverse effects of thiazolidinediones.
Data availability
The data underlying this article will be shared on reasonable request to the corresponding author.
Supplementary material
Supplementary material is available at Cardiovascular Research online.
Authors’ contributions
J.W. and C.D.S. conceived the hypothesis, designed experiments, and drafted the article. J.W. performed pulse wave velocity study, power spectral analysis, and flow cytometry. J.W., L.N.A., M.M., A.R.N., and P.N. performed ex vivo wire myography and pressure myography. A.R.N. measured plasma renin levels. J.W., S.F., and J.L.G. conducted the metabolic cage studies, measured urinary sodium and albumin, and performed data analysis. J.W. and R.M.W. performed echocardiogram and vascular ultrasound studies. D.A.M. and K.R. recorded renal sympathetic nerve activity. J.W., A.S., and J.A.M. performed western-blot analysis of renal sodium transporters. All authors reviewed, revised, and approved the article.
Time for primary review: 28 days
Acknowledgements
We thank Ms Kathy A. Zimmerman in the Cardiac Imaging Core at the University of Iowa for her technical service in the studies of echocardiogram and vascular ultrasound. We thank Mr Shao Yang Zhang for his technical support in analysing urinary sodium concentration. We also thank the University of Iowa Gene Editing Core for genotyping. We thank the Biochemical Assay Core Laboratory in the Department of Physiology at Medical College of Wisconsin for the measurement of urine albumin.
Conflict of interest: none declared except for the research funding detailed below.
Funding
This work was supported through research grants from the National Institutes of Health (NIH) to C.D.S. (HL084207 and HL144807), J.L.G. (HL134850), and J.A.M. (DK098141 and DK117903), and American Heart Association to C.D.S. (15SFRN23480000) and J.L.G. (18EIA33890055). R.M.W. and the Cardiac Imaging Core at the University of Iowa were funded by the NIH (OD019941). J.W. was supported by an AHA postdoctoral fellowship (17POST33660685). L.N.A. was supported in part by the Iowa Cardiovascular Interdisciplinary Research Fellowship (T32HL007121) and P.N. was supported in part by the Iowa Cardiovascular Interdisciplinary Research Fellowship (T32HL007121), Iowa Training Program in Kidney and Hypertension Research (T32DK007690), and MCW Training in Signature Transdisciplinary Cardiovascular Sciences (T32HL134643). K.R. is supported by NIH (HL084207), Department of Veterans Affairs (BX004249), and University of Iowa Fraternal Order of Eagles Diabetes Research Center. The authors gratefully acknowledge the previous research support of the Roy J. Carver Trust.
References
Mutations in PPARγ cause hypertension whereas treatment with PPARγ activators lowers blood pressure. The cardioprotective role of PPARγ in blood pressure regulation is largely mediated by its actions in the vasculature, but the role of vascular PPARγ in salt sensitivity of blood pressure remains unknown. We present evidence that smooth muscle PPARγ protects from salt sensitivity by promoting renal and systemic vasodilation in response to HSD and that mutations in PPARγ prevent this compensatory mechanism. The multi-faceted roles of PPARγ signalling necessitate the design of new therapies that selectively utilize the protective effects of PPARγ in vasculature, while minimizing the potential adverse effects of global PPARγ activation by thiazolidinediones.
