


Abstract
See Moskowitz (doi:) for a scientific commentary on this article.
The migraine aura is characterized by transient focal cortical disturbances causing dramatic neurological symptoms that are usually followed by migraine headache. It is currently not understood how the aura symptoms are related to the headache phase of migraine. Animal studies suggest that cortical spreading depression, the likely mechanism of migraine aura, causes disruption of the blood–brain barrier and noxious stimulation of trigeminal afferents leading to activation of brainstem nuclei and triggering of migraine headache. We used the sensitive and validated technique of dynamic contrast-enhanced high-field magnetic resonance imaging to simultaneously investigate blood–brain barrier permeability and tissue perfusion in the brainstem (at the level of the lower pons), visual cortex, and brain areas of the anterior, middle and posterior circulation during spontaneous attacks of migraine with aura. Patients reported to our institution to undergo magnetic resonance imaging during the headache phase after presenting with typical visual aura. Nineteen patients were scanned during attacks and on an attack-free day. The mean time from attack onset to scanning was 7.6 h. We found increased brainstem perfusion bilaterally during migraine with aura attacks. Perfusion also increased in the visual cortex and posterior white matter following migraine aura. We found no increase in blood–brain barrier permeability in any of the investigated regions. There was no correlation between blood–brain barrier permeability, brain perfusion, and time from symptom onset to examination or pain intensity. Our findings demonstrate hyperperfusion in brainstem during the headache phase of migraine with aura, while the blood–brain barrier remains intact during attacks of migraine with aura. These data thus contradict the preclinical hypothesis of cortical spreading depression-induced blood–brain barrier disruption as a possible mechanism linking aura and headache.
Introduction
Migraine with aura is an important, distressing and common condition occurring in ∼8% of the general population (Kirchmann, 2006). The dramatic symptoms of the aura clearly arise from the cerebral cortex [Headache Classification Committee of the International Headache Society (IHS), 2013]. Having puzzled neurologists for centuries, a breakthrough in the understanding of migraine with aura was made in the mid-20th century by Leão with the discovery of cortical spreading depression; a possible underlying mechanism of migraine aura (Leao, 1944). Later, seminal studies of cerebral blood flow (CBF) during migraine aura showed perfusion change corresponding to those seen during cortical spreading depression (Olesen et al., 1981).
One of the great mysteries of migraine with aura is the relation between the aura and the headache phase of migraine. Does the aura trigger subsequent headache and associated symptoms and, if so, how?
A long-standing hypothesis is that the changes in CBF observed during migraine aura cause a disruption of the blood–brain barrier, giving inflammatory substances access to cerebral perivascular nociceptors, thereby triggering migraine headache (Harper et al., 1977). In animals, cortical spreading depression has been shown to release matrix metalloproteinases (MMPs), enzymes that promote blood–brain barrier breakdown (Gursoy-Ozdemir et al., 2004), and to activate brainstem nuclei via stimulation of trigeminal afferents (Bolay et al., 2002). To date, blood–brain barrier permeability has not been systematically investigated in migraine patients and brainstem activation has not been assessed specifically during attacks of migraine with aura (Weiller et al., 1995; Afridi, 2005). Thus, the link between aura and headache in patients remains elusive.
In the present study we investigated patients with typical aura during spontaneous migraine attacks. We used a sensitive method of dynamic contrast-enhanced (DCE) MRI, which has recently been developed and validated at our institution (Larsson et al., 2008), to simultaneously measure blood–brain barrier permeability and CBF of relevant brain regions including the brainstem. We hypothesized that migraine with aura patients would have increased blood–brain barrier permeability and brain hyperperfusion during attacks of migraine with typical aura.
Materials and methods
Study design and participants
Patients were eligible for inclusion if they were aged between 18 and 65 years and had a verified diagnosis of migraine with aura in accordance with the International Headache Society (IHS) criteria [Headache Classification Committee of the International Headache Society (IHS), 2013]. Exclusion criteria were as follows: a history of any other primary headache (except episodic tension-type headache for <5 days per month), pregnant or breast-feeding women, contraindications for MRI (i.e. metal in the body or claustrophobia), cardiovascular or cerebrovascular disease, or psychiatric disease or drug abuse. We recruited patients via announcement on a Danish website for recruitment of volunteers to health research (http://www.forsoegsperson.dk) and on the intranet for hospital workers in the Capital Region of Denmark. Enrolment was done at Rigshospitalet Glostrup from 28 November 2012 to 14 January 2014. The Ethical Committee of the Capital Region of Denmark (H-3-2012-073) approved the study. All participants gave written consent after receiving detailed oral and written information and the study was done in accordance with the Declaration of Helsinki.
Procedures
All patients were asked to telephone a member of the research team (A.H. or F.M.A.) when they experienced an attack of migraine with aura. Patients were instructed to come to the hospital by taxi (fare reimbursed) to undergo an MRI investigation between 4 and 24 h from aura onset. This time range was chosen as increasing blood–brain barrier breakdown was observed from 3 h, peaking at 24 h, following cortical spreading depression in animals (Gursoy-Ozdemir et al., 2004).
On arrival at the hospital MRI was performed as described below. Additionally, all participants who were scanned during attacks were subsequently scanned on an attack-free day where patients had to be headache (48 h) and migraine (72 h) free. Analgesics or triptans were not allowed 48 h before scanning on both experimental days. Headache intensity was evaluated on a verbal rating scale (VRS) from 0 to 10 (0: no pain, 10: worst pain imaginable).
General MRI procedures
MRI was performed on a 3 T MR unit (Philips Achieva) using a 32-element phased-array head coil. To minimize head movement foam pads were placed in the head coil in both temple regions. Anatomical images were acquired using a 3D T1-weighted MP-RAGE (magnetization-prepared rapid gradient-echo) sequence with repetition time of 6.9 ms, echo time of 2.78 ms, field of view 263 × 281 × 150 mm3 and matrix size 256 × 256 mm3, 137 sagittal slices, 1.1 × 1.1 × 1.1 mm3 voxels).
Dynamic contrast-enhanced MRI
DCE-MRI imaging used a T1-weighted 2D saturation-recovery gradient recalled sequence for both precontrast T1 measurement and subsequent dynamic imaging. Each slice was acquired after application of a non-selective saturation pre-pulse with a saturation time delay of 120 ms. Echoes were read with a radiofrequency flip angle of 30°, repetition time of 3.9 ms, echo time of 1.95 ms, centric phase ordering, SENSE factor of 2, scan matrix size 96 × 62 (interpolated to 256 × 256), acquired voxel-size 2.40 × 2.98 × 8 mm3 (interpolated to 0.90 × 0.89 × 8 mm3), field of view 230 × 182 mm2, and six slices with a slice thickness of 8 mm and a gap of 1.5 mm. Data for an initial measurement of relaxation time (T1) and equilibrium magnetization (M0) were generated using a series of saturation time delays from 120 ms to 10 s, covering the same slices as imaged during the bolus passage. The dynamic sequence used a saturation time delay of 120 ms, giving a time resolution of 1.52 s, and 400 time points, corresponding to a total sampling duration of 606 s. Contrast agent (GADOVIST®: two boli of 0.045 mmol/kg bodyweight) was automatically injected (Spectris, Medrad) at time points 8 and 100 with a speed of 3 ml/s, followed by 20 ml of saline. Injection duration for each of the two boli was approximately 1 s. We applied this double bolus procedure to increase the sensitivity of subsequent parameter estimation, as recently described (Ingrisch et al., 2012). We acquired a separate slice at the level of the internal carotid artery to obtain an arterial input function with minimal partial volume. The remaining five DCE slices were used for defining regions of interest and subsequent parameter estimation. More details can be found in a previous publication (Cramer and Larsson, 2014).
MRI data analysis
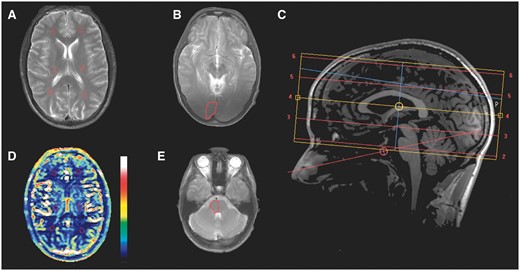
Location of the investigated regions of interest. Regions of interest are marked with red lines. (A) T2-weighted image showing regions of interest on the left and right side of regions of the anterior, middle and posterior cerebral circulation. (B) T2-weighted image showing regions of interest in the right visual cortex. (C) Sagittal T1-weighted image showing location of axial slices. (D) Cerebral perfusion corresponding to (same slice as) A. The colour bar gives the perfusion values from 0 (bottom) to 120 (top) ml/100 g/min. (E) T2-weighted image showing region of interest in the right side of the brainstem.
Estimation of permeability and perfusion
The DCE-MRI data were analysed with a semi-automatic procedure (Larsson et al., 2008) using in-house MatLab®-based software. The DCE-MRI time series was converted to units of contrast agent concentration using baseline T1 and M0 (Cramer and Larsson, 2014). The input function was corrected for partial volume by normalizing to a magnitude and phase-derived venous outflow function, in order to eliminate partial volume effects (van Osch et al., 2001), sampled in the sagittal sinus (Hansen et al., 2009). Tissue concentration–time curves were evaluated using the Patlak model, using the median value from each region of interest. Brain perfusion (CBF) was estimated by model-free deconvolution using Tikhonov’s method. Details of these methods are described in a previous publication (Larsson et al., 2009). Permeability and perfusion values are reported as Ki and CBF, respectively, both in the unit of ml/100 g/min assuming brain tissue density of 1 g/ml.
Statistical analysis
Absolute permeability and perfusion values are presented as mean ± standard deviation (SD). We calculated our sample size based on detection of at least 35% difference (d) in the Ki value between the attack days versus attack-free days at 5% significance (α = 0.025) and with 90% power (β = 0.1). The estimated SD of Ki was assumed to be 30%. We estimated that 19 patients should be included. Power calculation: N ≥ 2 (Z1-α + Z1-β)2 SD2 /d2 = 2 (1.96 + 1.64)2 0.32 /0.352 ≈ 19.
The primary hypothesis of the study was that the Ki value would be increased in one or more regions of interest on the attack day compared to the attack-free day in the hemisphere (or ipsilateral brainstem side) that was affected during the aura (i.e. the hemisphere contralateral to the perceived aura symptoms). For patients with bilateral visual aura, values for the affected hemispheres were the mean of the left and right hemispheres. The secondary hypothesis was that CBF would be increased in posterior regions of interest (visual cortex and/or posterior circulation) and in the brainstem on the side of the affected hemisphere. The hypothesis of cerebral hyperperfusion was based on previous observations of long-lasting hyperperfusion following the initial oligaemia during attacks of migraine with aura (Olesen et al., 1990).
Additional hypotheses were (i) a greater average (both sides) Ki and/or CBF value during attack versus outside of attack; (ii) a greater Ki and/or CBF value of the affected hemisphere versus the non-affected hemisphere during attack; and (iii) a greater Ki and/or CBF value on the pain side during attack versus outside of attack. We further tested the effects of time from symptom onset to scanning and headache intensity on these endpoints.
We used paired, one-sided t-tests for testing the hypotheses and a standard linear regression approach for assessing the relations between Ki and CBF and the time from aura onset to the time of scanning as well as the headache intensity scores. We used R (ver. 3.2.3) for all statistical analyses. A 5% level of significance was accepted for each comparison.
Results
Patient characteristics
| Patient no. | MA attacks per month | TTH days per month | Characteristics of studied spontaneous attack | |||||||
|---|---|---|---|---|---|---|---|---|---|---|
| Aura side | Aura symptoms | Aura duration (min) | Time to scan (h) | Headache side | Headache intensity | Associated symptoms (nausea/photophobia /phonophobia) | Visual aura description | |||
| 1 | 2 | 3 | Right | V + S + A | 30 | 9.5 | Left | 6 | yes/yes/yes | Zig-zag lines, scotoma, gradual development |
| 2 | 0.1 | 1 | Left | V | 20 | 1.0 | Bilateral | 5 | yes/yes/no | Zig-zag lines, scotoma, gradual development |
| 3 | 1 | 4 | Bilateral | V | 45 | 1.2 | NA | NA | NA | Bilateral ‘heat waves’, blurring, gradual development |
| 4 | 1 | 2 | Right | V | 30 | 5.4 | Left | 4 | yes/no/no | Zig-zag lines, scotoma, gradual development |
| 5 | 0.3 | 1 | Left | V | 18 | 4.9 | Right | 6 | yes/yes/yes | Wave-shaped pattern, scotoma, gradual development |
| 6 | 0.7 | 1 | Right | V | 20 | 22.8 | Right | 3 | no/no/no | ‘Static noise’, scotoma, gradual development |
| 7 | 1 | 1 | Left | V | 60 | 8.7 | Bilateral | 2 | no/no/no | Zig-zag lines, colours, scotoma, gradual development |
| 8 | 0.3 | 0 | Left | V | 30 | 3.8 | Right | 3 | yes/no/no | Zig-zag lines, scotoma, gradual development |
| 9 | 1 | 4 | Left | V | 30 | 4.0 | Right | 8 | yes/yes/yes | Wavy lines and dots, scotoma, gradual development |
| 10 | 1 | 0 | Left | V | 20 | 5.5 | Bilateral | 2 | non/yes/no | ‘Kaleidoscope’ (sharp edges), colours, scotoma, gradual development |
| 11 | 0.5 | 1 | Left | V | 25 | 6.7 | Right | 6 | yes/yes/yes | Zig-zag lines, scotoma, gradual development |
| 12 | 1 | 0 | Right | V | 35 | 5.1 | Left | 3 | yes/yes/yes | Zig-zag lines, dots, scotoma, gradual development |
| 13 | 0.5 | 2 | Left | V + S | 30 | 18.6 | Right | 2 | yes/yes/yes | Zig-zag lines, colours, scotoma, gradual development |
| 14 | 1.5 | 2 | Right | V + S | 30 | 17.9 | Left | 6 | yes/yes/yes | Flickering area with soft edges, gradual development |
| 15 | 1 | 1 | Right | V | 40 | 10.0 | Left | 5 | no/yes/yes | Zig-zag lines, flashes, scotoma, gradual development |
| 16 | 1 | 0 | Left | V | 50 | 5.9 | Right | 9 | yes/yes/no | Zig-zag lines, colours, scotoma, gradual development |
| 17 | 0.3 | 0 | Left | V + S | 40 | 4.2 | Right | 5 | no/yes/yes | Zig-zag lines, scotoma, gradual development |
| 18 | 2 | 0 | Bilateral | V + S + A | 40 | 6.4 | Left | 5 | no/yes/yes | Bilateral, peripheral scotomas, no flickering, zig-zag lines, gradual development |
| 19 | 2 | 1 | Left | V | 30 | 7.6 | Right | 8 | no/yes/yes | Zig-zag lines, scotoma, gradual development |
MA = migraine with aura; TTH = tension-type headache.
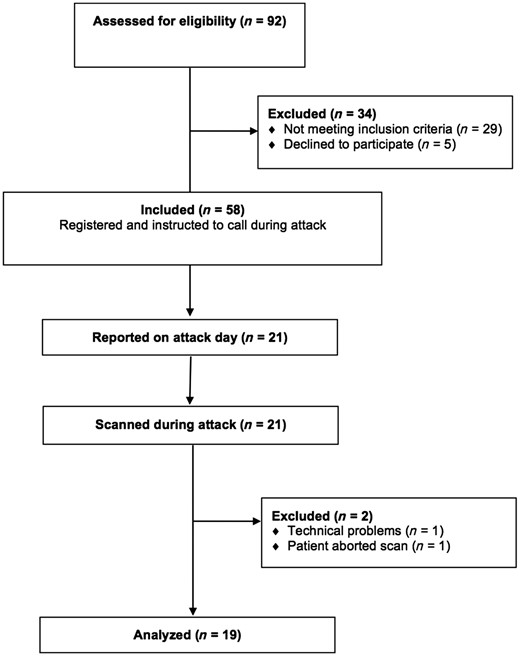
Flowchart of patient recruitment.
Blood–brain barrier permeability and cerebral blood flow during attacks
We found no increases in blood–brain barrier permeability (Ki) on migraine aura attack days compared to attack-free days for any of the regions of interest in the affected hemispheres, in the pain side or for the average of both hemispheres. Blood–brain barrier permeability was not greater in affected compared to non-affected hemispheres during attacks. Since the quality of the visual aura symptoms is likely dependent on the location of the cortical disturbance, we performed subanalyses to compare visual cortex blood–brain barrier permeability of the six patients who did not report scotomas with sharp edges (Patients 3, 5, 6, 9, 14 and 18) to the 13 patients who did. We found no differences in blood–brain barrier permeability between baseline and attack within these patient groups and no differences in permeability changes between these groups for the affected hemispheres, non-affected hemispheres or means of both hemispheres (uncorrected P > 0.1).
Mean permeability values (ml/100 g/min) and SD between the attack and attack-free days in 19 migraine with aura patients
| Anatomical region | Attack-free day Ki value (SD) | Attack day Ki value (SD) | P-value |
|---|---|---|---|
| Visual cortex (both sides) | 0.17 (0.06) | 0.19 (0.09) | 0.15 |
| Affected hemisphere | 0.17 (0.07) | 0.20 (0.09) | 0.15 |
| Non-affected hemisphere | 0.16 (0.09) | 0.18 (0.09) | |
| Brainstem (both sides) | 0.09 (0.06) | 0.10 (0.06) | 0.18 |
| Aura side | 0.08 (0.04) | 0.10 (0.06) | 0.12 |
| Non-aura side | 0.09 (0.04) | 0.10 (0.07) | 0.26 |
| Anterior cerebral (both sides) | 0.08 (0.08) | 0.09 (0.09) | 0.09 |
| Affected hemisphere | 0.06 (0.05) | 0.08 (0.06) | 0.06 |
| Non-affected hemisphere | 0.09 (0.14) | 0.10 (0.15) | 0.31 |
| Middle cerebral (both sides) | 0.08 (0.04) | 0.07 (0.05) | 0.55 |
| Affected hemisphere | 0.07 (0.05) | 0.07 (0.05) | 0.67 |
| Non-affected hemisphere | 0.08 (0.05) | 0.05 (0.05) | 0.95 |
| Posterior cerebral (both sides) | 0.09 (0.04) | 0.10 (0.05) | 0.08 |
| Affected hemisphere | 0.09 (0.04) | 0.10 (0.05) | 0.12 |
| Non-affected hemisphere | 0.08 (0.05) | 0.11 (0.06) | 0.11 |
Ki = permeability value (ml/100 g/min). P-value = paired t-test, one-sided, not corrected for multiple comparisons.
Animal studies suggest that cortical spreading depression—the likely mechanism of migraine aura—disrupts the blood-brain barrier, and thereby leads to migraine headache. However, using an advanced MRI technique in patients, Hougaard et al. demonstrate that headache following spontaneous aura is associated with brainstem hyperperfusion while the blood-brain barrier remains intact.
Mean brain perfusion (CBF) values (ml/100 g/min) and SD between the attack and attack-free days in 19 migraine with aura patients
| Anatomical region | Attack-free day CBF (SD) | Attack day CBF (SD) | P-value |
|---|---|---|---|
| Visual cortex (both sides) | 27.1 (5.2) | 31.4 (8.9) | 0.03a |
| Affected hemisphere | 27.6 (5.5) | 32.2 (10.1) | 0.03a |
| Non-affected hemisphere | 26.5 (5.3) | 30.5 (8.0) | 0.03a |
| Brainstem (both sides) | 18.1 (3.2) | 21.2 (7.2) | 0.04a |
| Perceived aura side | 17.6 (3.1) | 20.9 (7.3) | 0.03a |
| Contralateral side | 18.6 (3.5) | 21.4 (7.2) | 0.05a,b |
| Anterior cerebral (both sides) | 13.1 (2.2) | 14.6 (4.4) | 0.06 |
| Affected hemisphere | 13.4 (2.7) | 15.0 (4.6) | 0.08 |
| Non-affected hemisphere | 12.7 (1.9) | 14.2 (4.5) | 0.06 |
| Middle cerebral (both sides) | 18.4 (7.1) | 19.2 (6.8) | 0.31 |
| Affected hemisphere | 18.2 (6.9) | 19.6 (7.3) | 0.24 |
| Non-affected hemisphere | 18.6 (8.0) | 18.8 (7.3) | 0.45 |
| Posterior cerebral (both sides) | 12.9 (2.5) | 15.3 (6.5) | 0.05 |
| Affected hemisphere | 12.9 (2.6) | 15.3 (6.7) | 0.04a |
| Non-affected hemisphere | 13.0 (2.8) | 15.2 (6.8) | 0.07 |
CBF = brain perfusion (ml/100 g/min). P-value = paired t-test, one-sided, not corrected for multiple comparisons.
aStatistically significant at the 5% level. bRounded P-value is below 0.05.
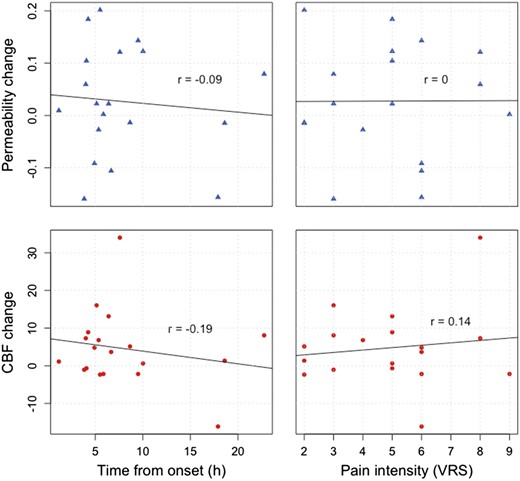
Relations between observed changes in permeability (Ki, blue triangles) and perfusion (CBF, red circles) versus time from symptom onset to examination and pain intensity measured on a verbal rating scale (VRS). We found no significant correlations between any of these variables.
Discussion
The major novel findings of the present study were that during spontaneous attacks of migraine with typical aura (i) the blood–brain barrier remains intact; and (ii) the brainstem, at the level of the lower pons, is activated.
No blood–brain barrier disruption following migraine aura
Blood–brain barrier permeability increases in a number of diseases of the CNS including multiple sclerosis, brain tumours, CNS infections, and stroke (Weiss et al., 2009). Aura symptoms are usually transient and short, lasting less than an hour. From a clinical point of view, the aura symptoms, though dramatic and distressing to patients, are less severe than conditions known to involve blood–brain barrier disruption.
The hypothesis of increased blood–brain barrier permeability in migraine with aura has survived for decades but is only poorly supported by scientific evidence. One basic science study reported activation of MMP9 and brain oedema in rats 3–6 h following repeated episodes of cortical spreading depression induced by pin-prick (Gursoy-Ozdemir et al., 2004). The results of the present study suggest that this observation does not apply to the clinical condition of migraine with aura. An increase of plasma MMP9 has been reported during migraine with aura attacks (Leira et al., 2007), but not consistently (Martins-Oliveira et al., 2009), while no changes were reported in a study of migraine without aura (Ashina et al., 2009). MMP9 is not specific of blood–brain barrier breakdown but is generally involved in the degradation of extracellular matrix in a wide range of conditions, including rheumatoid arthritis (Gruber et al., 1996), atrial fibrillation (Li et al., 2014), and cancer (Roomi et al., 2009).
Some cases suggestive of increased blood–brain barrier permeability have been reported in severe episodes of hemiplegic migraine involving decreased consciousness (Russell and Ducros, 2011). Unlike patients with typical aura, hemiplegic migraine patients are at risk of major episodes of coma, encephalopathy and seizures, affecting up to one-third of patients with familial hemiplegic migraine (FHM) type 1 (Ducros et al., 2001). These symptoms reflect a different, more severe and very rare pathophysiology that is highly unlikely to be present in non-hemiplegic migraine.
A recent PET study investigated cerebral binding of radioactively marked dihydroergotamine in six migraine patients before and during glyceryl trinitrate-induced attacks without aura and found no ictal increase in binding (Schankin et al., 2016). Even though this study was relatively small and applied a method that has not positively demonstrated blood–brain barrier breakdown in other conditions, it supplements our present findings with evidence that the blood–brain barrier also remains intact during migraine without aura.
Perfusion changes following migraine aura
We observed hyperperfusion in the visual cortices and in the posterior white matter of hemispheres contralateral to the perceived aura symptoms. In addition, perfusion was increased in the lower pons bilaterally. The cerebral findings are in line with previous reports of CBF measurements in migraine with aura patients showing an initial hypoperfusion during the aura symptoms lasting for a few (∼4) hours, followed by a longer lasting (∼8 h) hyperperfusion, probably depending on the duration and type of the aura symptoms (Olesen et al., 1990). Similar hyperperfusion has also been observed using the more recent MRI technique of arterial spin labelling (Pollock et al., 2008).
Brainstem hyperperfusion has not previously been reported following migraine aura specifically. In animals, cortical spreading depression causes release of ions and neurotransmitters from the cortex, leading to sensitization of perivascular trigeminal afferents, and subsequently activation of second-order trigeminal neurons in the trigeminal nucleus caudalis of the brainstem (Bolay et al., 2002). In the present study, all patients reported typical aura, which in all but one patient was followed by headache, and we observed clear brainstem hyperperfusion in these patients during the headache phase.
It should be noted that, based on clinical observations, the relation between migraine aura and headache is complex. Migraine aura without subsequent headache is common and likely underdiagnosed with a possible true prevalence above 30% (Alstadhaug et al., 2012) and auras may occur during or after the headache phase (Russell and Olesen, 1996).
Brainstem ‘activation’ (i.e. hyperperfusion), in the same area as in the present study, has previously been reported in PET studies of spontaneous migraine attacks without aura (Weiller et al., 1995), in a mixed group of patients with and without aura (Afridi et al., 2005), and in attacks of migraine without aura triggered by glyceryl trinitrate (Afridi, 2005). These observations have led to a theory of the brainstem as a ‘migraine generator’. In contrast, brainstem activation has not been reported in other primary headaches, such as cluster headache (May et al., 2000), or in experimental trigeminal pain using capsaicin injection (May et al., 1998). However, changes in ipsilateral pontine activity were observed in a PET study of cold-induced pain to the hand (Petrovic et al., 2004), suggesting that this phenomenon could reflect more general ascending or descending pain-related signalling. Interestingly, Weiller et al. (1995) observed lateralization of brainstem activation towards the contralateral side of the headache, as was the case in the present study. In addition, symptomatic migraine has been reported due to brainstem lesions (Goadsby, 2002; Afridi and Goadsby, 2003; Obermann et al., 2006). In most of these cases, the lesions were located on the contralateral side of the head pain. The pathologically affected site could theoretically be the serotonergic raphe nuclei, which have bilateral projections to migraine-relevant structures such as the hypothalamus, the trigeminal nucleus caudalis, and the cerebral cortex (Hornung, 2003). A recent functional MRI study reported activation of the dorsal pons during repeated attacks of migraine without aura and, in addition, increased functional coupling between the pons and the hypothalamus in the ictal state (Schulte and May, 2016). Thus, brainstem hyperperfusion is likely a common feature of migraine with and without aura.
Strengths and limitations of the study
We applied a sensitive and robust method, DCE-MRI, which has previously demonstrated increased blood–brain barrier permeability in patients with intracranial neoplasms (Larsen, 2013), multiple sclerosis (Cramer, 2013), ischaemic stroke (Kassner, 2009), and Alzheimer’s disease (Starr, 2009). Brain perfusion measurements by this method have been shown to be accurate compared to other modalities including PET (Henriksen et al., 2012). Patients served as their own controls, thus excluding important potential confounders. Investigators had no influence on the outcome of the study. While permeability investigations of the visual cortex have not, to our knowledge, previously been performed using DCE-MRI, the observed white matter permeability values were similar to previously reported values in healthy volunteers (0.08 ml/100 g/min) (Cramer and Larsson, 2014). The visual cortex regions of interest were not homogenous but included different tissues such as grey matter, white matter, and blood vessels, potentially increasing the variability of measurements. A limitation of the study sensitivity was that blood–brain barrier function was tested for a gadolinium-based contrast agent, which is a 604 Da extremely hydrophilic molecule. A post hoc power analysis showed that we could have detected permeability changes in the primary visual cortex region of interest of 11%. We cannot rule out that subtle changes below this detection limit occur.
The hypotheses of increased permeability and increased perfusion were each tested for a total of 10 a priori designated regions of interest. The statistical threshold corrected for comparison of multiple regions of interest by the Bonferroni method of P < 0.005 was not reached by any of the statistical tests in the study and the uncorrected results should be interpreted with caution. However, Bonferroni correction produces a high risk of type II error (Perneger, 1998). Considering the anatomical coherence and agreement with previous observations of our perfusion results, we do not suspect them to be random findings due to multiple testing. Patients were examined several hours following aura onset, which is ideal based on animal studies of cortical spreading depression (Gursoy-Ozdemir et al., 2004). However, we cannot rule out the possibility of interspecies differences, and the timeframe may not be optimal for the study of migraine patients. Thus, short and transient permeability changes occurring early during attacks cannot be refuted with certainty based on these data.
Conclusions
Data from simultaneous measurements of blood–brain barrier permeability and brain perfusion clearly oppose the long-standing, but poorly supported, hypothesis of blood–brain barrier leakage following episodes of typical migraine aura. Instead, we observed brainstem hyperperfusion during headache preceded by aura.
Funding
We thank the Lundbeck Foundation (R155-2014-171), the Novo Nordisk Foundation (NNF11OC1014333), University of Copenhagen, the Research Foundation of the Capital Region of Denmark (A4620), and the Danish Council for Independent Research-Medical Sciences (DFF-4004-00169B). Funding sources played no role in study design, data collection, analysis, interpretation, manuscript preparation, or submission. The corresponding author had full access to and the final responsibility to submit all study data for publication.
Conflicts of interest
M.A. is a consultant or scientific advisor for Allergan, Amgen, Alder, ATI and Eli Lilly, primary investigator for an Amgen 20120178 (Phase 2), 20120295 (Phase 2), 20130255 (OLE), 20120297 (Phase 3) and GM-11 gamma-Core-R trials, and reports grants from Lundbeck Foundation (R155-2014-171), Research Foundation of the Capital Region of Copenhagen, Danish Council for Independent Research-Medical Sciences and Novo Nordisk Foundation (NNF11OC101433) during the conduct of the study. A.H, F.A, C.E.C, S.Y, F.W, S.P.C, and H.B.W.L report no disclosures relevant to the manuscript.
Abbreviations
References
Cramer SP, Simonsen H, Frederiksen JL, Rostrup E, Larsson HB. Abnormal blood-brain barrier permeability in normal appearing white matter in multiple sclerosis investigated by MRI. Neuroimage Clin 2013; 4: 182–9.
Kassner A, Roberts T, Taylor K, Silver F, Mikulis D. Prediction of haemorrhage in acute ischemic stroke using permeability MR imaging. AJNR Am J Neuroradiol 2005; 26: 2213–17.
Starr JM, Farrall AJ, Armitage P, McGurn B, Wardlaw J. Blood-brain barrier permeability in Alzheimer's disease: a case-control MRI study. Psychiatry Res 2009; 171: 232–41.
Author notes
See Moskowitz (doi:) for a scientific commentary on this article.

