


Abstract
A main goal of rehabilitation strategies in humans with spinal cord injury is to strengthen transmission in spared neural networks. Although neuromodulatory strategies have targeted different sites within the central nervous system to restore motor function following spinal cord injury, the role of cortical targets remain poorly understood. Here, we use 180 pairs of transcranial magnetic stimulation for ∼30 min over the hand representation of the motor cortex at an interstimulus interval mimicking the rhythmicity of descending late indirect (I) waves in corticospinal neurons (4.3 ms; I-wave protocol) or at an interstimulus interval in-between I-waves (3.5 ms; control protocol) on separate days in a randomized order. Late I-waves are thought to arise from trans-synaptic cortical inputs and have a crucial role in the recruitment of spinal motor neurons following spinal cord injury. Motor evoked potentials elicited by transcranial magnetic stimulation, paired-pulse intracortical inhibition, spinal motor neuron excitability (F-waves), index finger abduction force and electromyographic activity as well as a hand dexterity task were measured before and after both protocols in 15 individuals with chronic incomplete cervical spinal cord injury and 17 uninjured participants. We found that motor evoked potentials size increased in spinal cord injury and uninjured participants after the I-wave but not the control protocol for ∼30 to 60 min after the stimulation. Intracortical inhibition decreased and F-wave amplitude and persistence increased after the I-wave but not the control protocol, suggesting that cortical and subcortical networks contributed to changes in corticospinal excitability. Importantly, hand motor output and hand dexterity increased in individuals with spinal cord injury after the I-wave protocol. These results provide the first evidence that late synaptic input to corticospinal neurons may represent a novel therapeutic target for improving motor function in humans with paralysis due to spinal cord injury.
Introduction
Treatments in spinal cord injury (SCI) result in limited behavioural improvements, highlighting the need to develop new methodologies to strengthen spared neural networks. During the past decade, neuromodulatory therapies in humans with SCI have commonly used electrical stimulation of the spinal cord (Gerasimenko et al., 2007; Harkema et al., 2011; Angeli et al., 2014), operant conditioning of spinal reflexes (Thompson et al., 2013), spike-timing dependent plasticity protocols targeting synaptic interactions between corticospinal neurons and spinal motor neurons (Bunday and Perez, 2012) and stimulation of the motor cortex (Tazoe and Perez, 2015), alone or in combination with training, to promote functional recovery. Although these approaches have resulted in improvements in voluntary motor output and other related body functions, it is clear that the improvements are limited and there is a need to develop novel mechanistic-based interventions.
After SCI, synaptic transmission and organization of neural networks not only change in the spinal cord but also in higher order structures such as the motor cortex (Oudega and Perez, 2012). For example, animal models of SCI showed that cortical deafferentation results in layer-specific synaptic pruning and expansive reorganization (Kim et al., 2006; Ghosh et al., 2010). Humans with SCI show altered transmission in cortical circuits (Nardone et al., 2015; Cirillo et al., 2016) and expansion of residual motor cortical representations compared with uninjured subjects (Moxon et al., 2014). Cortical synaptic inputs to corticospinal neurons contribute to different forms of motor behaviour and learning in animals and humans (Sanes and Donoghue, 2000; Graziano and Aflalo, 2007). Also, increases in the efficacy of cortical synaptic connections to corticospinal neurons has been shown to enhance transmission in the corticospinal pathway and voluntary motor output in uninjured individuals and in people with motor disorders such as stroke (Thickbroom et al., 2006; Ridding and Rothwell, 2007). A critical question is if neuromodulatory therapies targeting cortical networks could be advantageous to strengthen voluntary motor output following SCI.
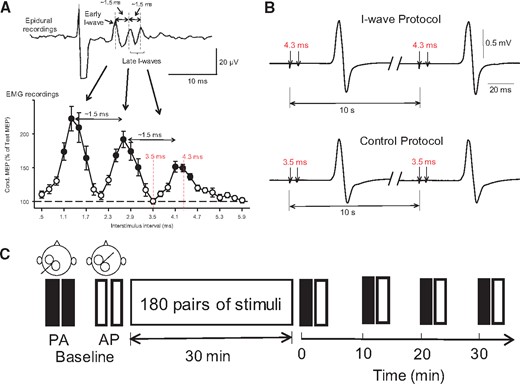
Experimental set-up. (A) Upper trace shows early and late descending indirect (I) waves on corticospinal volleys recorded from the cervical epidural space after a single TMS pulse with a periodicity of ∼1.5 ms. The earliest wave due to direct stimulation of the corticospinal neuron at or near the initial segment (D-wave) is not shown in the diagram. In the graph, the abscissa shows the interstimulus interval between pairs of TMS pulses (0.5–5.9 ms, in 0.2-ms steps) and the ordinate shows the size of a conditioned MEP (expressed as a percentage of a test MEP, horizontal dashed line) recorded by surface EMG from the first dorsal interosseous muscle. MEPs were enhanced at interstimulus intervals corresponding to the I-waves recorded from epidural recordings. (B) Conditioned MEPs recorded from a representative subject by using pairs of TMS pulses delivered at an interstimulus interval of 4.3 ms (I-wave protocol; top) and 3.5 ms (control protocol; bottom) at an intertrial interval of 10 s. Note that at 4.3 ms MEPs are facilitated mimicking the peak of a late I-wave and at 3.5 ms MEPs are not facilitated corresponding to an interval in-between the I-waves (see red dotted lines in the graph on the left; modified from Cirillo et al., 2016). (C) Two sets of 20 MEPs were recorded with the coil in the posterior-anterior (PA) and anterior-posterior (AP) orientation, before (baseline) and after (0, 10, 20, and 30 min) receiving 180 pairs of pulses in each protocol.
Materials and methods
Subjects
Fifteen subjects with SCI (mean age = 44.0 ± 15.3 years, four females) and 17 right-handed age-matched uninjured subjects (mean age = 37.3 ± 12.3, P = 0.23; five females) participated in the study. All subjects gave written informed consent prior to participation in the study, which was approved by the local ethics committee at the University of Miami. The study was performed in accordance with the Declaration of Helsinki. Subjects with SCI were categorized by the American Spinal Cord Injury Association Impairment Scale (AIS) as AIS C or D, had a chronic (>1 year), cervical injury (C2–C7), and residual sensory and motor hand and arm motor function (Table 1). Maximal voluntary contraction (MVC) isometric forces into index finger abduction were larger in uninjured compared with SCI subjects (uninjured = 27.3 ± 7.3 N, SCI = 14.8 ± 6.1 N, P < 0.001; Table 1).
Spinal cord injury participants
| SCI subject | Age, years | Gender | Level | AIS score | Aetiology | Time, years | Index finger abduction MVC (N) |
|---|---|---|---|---|---|---|---|
| 1 | 37 | M | C7 | D | T | 9 | 14.2 |
| 2 | 42 | F | C3 | C | T | 8 | 21.1 |
| 3 | 68 | M | C3 | D | T | 13 | 9.1 |
| 4 | 35 | M | C7 | C | T | 2 | 7.8 |
| 5 | 36 | M | C2 | C | T | 13 | 18.4 |
| 6 | 49 | F | C2 | C | T | 9 | 10.7 |
| 7 | 30 | M | C3 | C | T | 9 | 24.9 |
| 8 | 67 | M | C2 | D | T | 6 | 19.1 |
| 9 | 50 | M | C3 | C | T | 12 | 10.8 |
| 10 | 19 | M | C2 | D | T | 3 | 8.2 |
| 11 | 51 | F | C5 | C | T | 14 | 22.6 |
| 12 | 64 | M | C5 | C | T | 5 | 15.1 |
| 13 | 48 | M | C4 | C | T | 4 | 12.3 |
| 14 | 21 | M | C6 | C | T | 2 | 16.8 |
| 15 | 47 | F | C5 | C | T | 4 | 10.9 |
AIS = American Spinal Cord Injury Association Impairments Scale; M = Male; F = Female; T = traumatic; N = Newtons (uninjured = 27.3 ± 7.3, SCI = 14.8 ± 6.4).
EMG recordings
Surface EMG was recorded at rest from the first dorsal interosseous muscle of the right hand in uninjured subjects and from the more affected hand in individuals with SCI using Ag-AgCl surface electrodes (10 mm diameters). The signals were amplified, filtered (30–2000 Hz), and sampled at 2 kHz for off-line analysis (CED 1401 with Signal software, Cambridge Electronic Design). During MVC, force exerted at the proximal interphalangeal joint of the index finger was measured by load cells (Honeywell, Ltd., range ± 498.1 N, voltage ± 5 V, high-sensitivity transducer 0.045 V/N). Force was sampled at 200 Hz and stored on a computer for off-line analysis.
Transcranial magnetic stimulation
Transcranial magnetic stimuli were applied using a figure-of-eight coil (loop diameter 70 mm) through a Magstim 2002 magnetic stimulator (Magstim) with a monophasic current waveform. TMS was used to activate different sets of synaptic input to corticospinal neurons by changing the current flow across the hand area of the motor cortex (Di Lazzaro et al., 2012). We used a posterior–anterior (PA, coil handle 45° to the midline) and anterior–posterior (AP, coil handle 180° relative to PA) coil orientations to preferentially evoke volleys with characteristics resembling early and late I-waves, respectively. Note that currents flowing from PA across the central sulcus preferentially evoke highly synchronized corticospinal activity consistent with early I-waves whereas currents flowing from AP preferentially evoke less synchronized and, in some cases, delayed corticospinal activity consistent with late I-waves (Di Lazzaro et al., 2012; Di Lazzaro and Rothwell, 2014). The coil was placed at the optimal scalp position for eliciting a motor evoked potential (MEP) in the contralateral first dorsal interosseous muscle for the PA induced current and this position was then marked as the hotspot also for the AP orientation. The TMS coil was held to the head of the subject with a custom coil holder, while the head was firmly secured to a headrest by straps to limit head movements.
I-wave and control protocol
During testing, participants were seated in a customized armchair with both arms flexed at the elbow by 90°, the forearm pronated and the wrist restrained by straps. Subjects participated in two stimulation protocols separated by 3–5 days in a randomized order. In each protocol, we applied 180 pairs of stimuli for ∼30 min over the hand representation of the motor cortex at an interstimulus interval targeting late I-waves in corticospinal neurons (I-wave protocol) or at an interstimulus interval in-between I-waves (control protocol). The I-wave protocol was based on a paired-pulse TMS paradigm where a conditioning stimulus (S2) was delivered after a test stimulus (S1) at a 4.3 ms interstimulus interval with the coil in the PA orientation (Tokimura et al., 1996; Ziemann et al., 1998a). We ensured that all subjects showed I-wave facilitation at this interval at baseline. The S1 intensity was set at 120% of the resting motor threshold and the S2 was set at 90% of the resting motor threshold. In the control protocol, the S2 was given 3.5 ms after the S1 to target an interval in-between I-waves (Fig. 1B). Although the same stimulus intensity was used in both protocols the size of MEPs elicited by the combined S1 and S2 progressively increased during the I-wave but not the control protocol, highlighting the specificity of these approaches. MEP peak-to-peak amplitude and onset latency dispersion tested with the coil in the PA and AP orientation, voluntary motor output and hand dexterity were measured before (baseline), immediately after (0), and 10, 20, and 30 min after the I-wave protocol and the control protocol (Fig. 1C). To further understand the mechanisms contributing to changes in MEP outcomes present after the I-wave protocol short-interval intracortical inhibition (SICI), short-interval intracortical facilitation (SICF), and F-waves (amplitude and persistence) were measured at similar time as described above.
Motor evoked potentials
Resting motor threshold was determined at the minimum stimulus intensity required to elicit MEP > 50 µV peak-to-peak amplitude above the background EMG activity in at least 5 of 10 consecutive trials in the relaxed first dorsal interosseous muscle. Resting motor threshold was higher in SCI compared with uninjured subjects [F(1,25) = 6.6, P = 0.017] when the coil was in the AP (uninjured = 63.9 ± 13.6%, SCI = 74.0 ± 10.8% of stimulator output) and PA (uninjured = 49.0 ± 10.7%, SCI = 62.1 ± 12.4% of stimulator output) orientation [F(1,25) = 161.5, P < 0.001]. TMS intensity was set at 120% of the resting motor threshold. A total of 20 MEPs were recorded at each time point before and after each protocol, using PA and AP induced currents in uninjured (n = 17) and SCI (n = 15) participants. At baseline, the size of MEPs elicited with the coil in the PA and AP orientation we maintained similar in uninjured (PA = 1.2 ± 0.2 mV, AP = 1.3 ± 0.2 mV; P = 0.9) and SCI (PA = 0.4 ± 0.2 mV, AP = 0.3 ± 0.1 mV; P = 0.2) participants for the different coil orientations tested. As MEPs were larger in uninjured compared with SCI participants the analysis was also conducted in a subgroup of SCI individuals (n = 8) in whom MEPs were similar across groups. We measured the MEP onset latency dispersion before and after each protocol in each coil orientation by subtracting the mean MEP onset latency from individual MEPs onset latency in each condition. In a subset of subjects the effects of the stimulation were followed up until measurements returned to baseline.
Short-interval intracortical inhibition
SICI was tested using a previously described paired-pulse paradigm (Kujirai et al., 1993) in uninjured (n = 10) and SCI (n = 9) participants before and after the I-wave protocol with the coil in the AP and PA orientation. An S2 was set at an intensity of ∼70% of resting motor threshold (uninjured = 73.5 ± 8.9%, SCI = 71.2 ± 10.3% of resting motor threshold; P = 0.73) and an S1 was set at 120% of resting motor threshold in both groups. The S2 was delivered 2 ms before S1. Previous evidence showed that the size of a test MEP can affect the magnitude of SICI. Because MEP size in the AP orientation increased after the I-wave protocol compared with baseline we also tested SICI by adjusting the test MEP size to match MEP amplitudes produced at baseline. SICI was calculated by expressing the size of conditioned MEP as a percentage of the test MEP size [(conditioned MEP × 100)/(test MEP)]. Twenty test MEPs and 20 conditioned MEPs were recorded at each time point.
Short-interval intracortical facilitation
We used a previously described paired-pulse paradigm (Tokimura et al., 1996; Ziemann et al., 1998a; uninjured, n = 10 and SCI, n = 10) to test SIFC before and after the I-wave protocol. An S2 was delivered 1.3 ms after an S1 with the coil in the PA and AP orientation. The intensity of the S1 was set at 120% of resting motor threshold and for the S2 at 90% of resting motor threshold. Since MEP size in AP orientation was increased after I-wave protocol compared to baseline, here we also tested SICF by adjusting the S1 MEP size to match MEP amplitudes produced at baseline. SICF was calculated by expressing the size of conditioned MEP as a percentage of the test MEP size [(conditioned MEP × 100)/(test MEP)]. A total of 20 test and 20 conditioned MEPs were recorded at each time point.
F-waves
Motor neuron excitability (reflected by changes in F-wave amplitude and persistence) was measured in both groups (uninjured, n = 10; SCI, n = 10) using supramaximum stimulus intensity to the ulnar nerve at the wrist (200 µs pulse duration, DS7A; Digitimer) with monopolar bar electrodes before and after the I-wave protocol. The anode and cathode were 3 cm apart and 1 cm in diameter with the cathode positioned proximally. The stimuli were delivered at 1 Hz at an intensity of 150% of the M-max. For each trial, we quantified for each F-wave the peak-to-peak amplitude (expressed relative to the M-max) and F-wave persistence (the percentage of stimuli evoking a response; McNeil et al., 2013). If the F-wave was not present, an amplitude of zero was included in the mean (Butler and Thomas, 2003). The same result was observed in both groups whether zero F-wave amplitudes were included in the analysis or not. Three sets of 30 F-waves were recorded before and after each time point in the I-wave protocol.
Motor output
Individuals were instructed to perform sets of 20 brief, fast, isometric voluntary contractions into index finger abduction by moving a cursor on a computer screen into a target line representing 10% of MVC (uninjured, n = 10; SCI, n = 10). The index finger was attached to a custom two-axis load cell (Honeywell Ltd.), which measured finger abduction force. At the start of the experiment, subjects performed three brief MVCs (3–5 s) into index finger abduction separated by 30 s. The maximal forces were used to set targets for subsequent submaximal contractions of around 10% of MVC. Subjects were able to control movement of the cursor up to 8% of MVC and the rest of the displacement (2% of MVC) was simulated by a LabVIEW program. This allowed subjects to rely on their internal calibration and not to make conscious corrections of the voluntary output exerted. Four sets of 20 trials were repeated before and after each protocol. Force and mean rectified EMG in the first dorsal interosseous muscle, which contributes to index finger abduction, were analysed in a 250 ms window during each trial using Spike2 (Bunday and Perez, 2012). We examined motor output steadiness by measuring the coefficient of variation (CV) of the rectified EMG [standard deviation (SD)/mean EMG] and force amplitude (SD/mean force amplitude). We also calculated reaction times as the time point after the auditory signal at which EMG activity exceeded ± 4 SD of the mean average rectified EMG, measured 100 ms before stimulus artefact.
Nine-hole peg test
During testing, participants with SCI (n = 10) were seated in front of a table where the apparatus used for the nine-hole peg test was located. The distance and position between each subject’s hand and the apparatus was recorded and maintained constant across time. Subjects were instructed to pick up nine pins and position each one of them into a reservoir as fast and accurately as possible. A stopwatch was used to measure the time to execute the task. Time was recorded separately for the in and out components of the task. After familiarization, participants were asked to repeat the task five times before and after each protocol.
Data analysis
Normal distribution was tested by the Shapiro-Wilk test and the Mauchly test was used to test sphericity. When normal distribution could not be assumed data were log transformed. When sphericity could not be assumed the Greenhouse-Geisser correction statistic was used. Repeated measures ANOVAs were performed to determine the effect of Protocol (I-wave, control), Time (Baseline, 0, 10, 20, 30 min), Coil orientation (PA, AP) and Group (uninjured, SCI) on MEP size, and MEP onset latency dispersion. Repeated measures ANOVAs were also performed to determine the effect of Time, Group and Coil orientation on SICI and SICF and the effect of Time and Group on F-wave amplitude and persistence. Bonferroni post hoc tests were used to check for significant comparisons. The significant level was set at P < 0.05 and group data are presented as mean ± SD in the text and figures.
Results
Motor evoked potentials

MEPs elicited with the coil in the AP orientation. Raw MEP traces from the first dorsal interosseous muscle in a representative control (A) and SCI subject (C) tested with the TMS coil in the AP orientation before and after the I-wave (upper traces) and control (lower traces) protocol. Waveforms show the average of 20 MEPs. (B and D) Graphs showing group (n = 17; SCI, n = 15, left) and individual (right) data. The abscissa shows the time at which MEPs were tested (baseline, and 0, 10, 20 and 30 min after stimulation) and the ordinate shows the size of MEPs (expressed as a percentage of baseline). MEPs (expressed as a percentage of baseline MEP) are also shown for individual subjects after I-wave (red bars) and control (black bars) protocol. Error bars indicate SDs. *P < 0.05, comparison between protocols; ¥P < 0.05, comparison with baseline.
Repeated measures ANOVA showed a significant effect of Protocol [F(1,520) = 5.5, P = 0.02], Time [F(4,520) = 4.5, P = 0.002], Coil orientation [F(1,520) = 4.6, P = 0.03], Group [F(1,520) = 20.6, P < 0.001], but not in their interaction [F(4,520) = 0.56, P = 0.81] on MEP size. Post hoc testing showed that MEPs in the AP orientation increased in uninjured (by 69.7 ± 19.9%, 15/17, P < 0.001; Fig. 2B) and SCI (by 42.3 ± 13.2%, 14/15, P < 0.001; Fig. 2D) participants compared with baseline for 30 min. Note that MEPs in the AP orientation also increased after the I-wave protocol in SCI subjects in whom MEP size at baseline was similar to uninjured participants. We followed up the effects of the I-wave protocol and found out that MEP size returned to baseline ∼30–110 min after the stimulation (mean = 54.3 ± 30.1 min, n = 8). Also note that MEPs elicited with the coil in the PA orientation remained unchanged after the I-wave (uninjured, P = 0.39, SCI, P = 0.52) and control (uninjured, P = 0.62, SCI, P = 0.83; Supplementary Fig. 1) protocol in both groups.
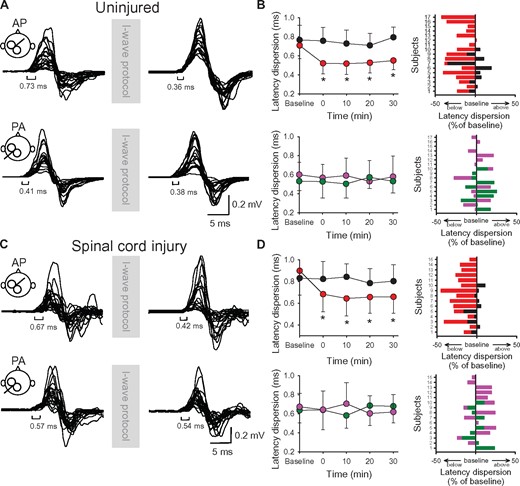
MEP onset latency dispersion. Raw MEP traces from the first dorsal interosseous muscle for a representative uninjured (A) and SCI subject (C) tested with the coil in the AP (upper) and PA (lower) orientation before and after the I-wave protocol. Twenty superimposed MEPs are shown in each condition. (B and D) Graphs showing group (n = 17; SCI, n = 15, left) and individual (right) data. The abscissa shows the time at which MEPs were tested (baseline, and 0, 10, 20 and 30 min after stimulation) and the ordinate shows the MEP onset latency dispersion (in ms) before and after the I-wave (upper graphs in B and D) and control (lower graphs in B and D) protocol. MEP onset latency dispersions (expressed as a percentage of baseline) are shown for individual subjects for MEPs tested in the AP (I-wave protocol = red bars, control protocol = black bars) and PA (I-wave protocol = purple bars, control protocol = green bars) orientation in both groups. Error bars indicate SDs. *P < 0.05, comparison between protocols; ¥P < 0.05, comparison with baseline.
Short-interval intracortical inhibition and short-interval intracortical facilitation
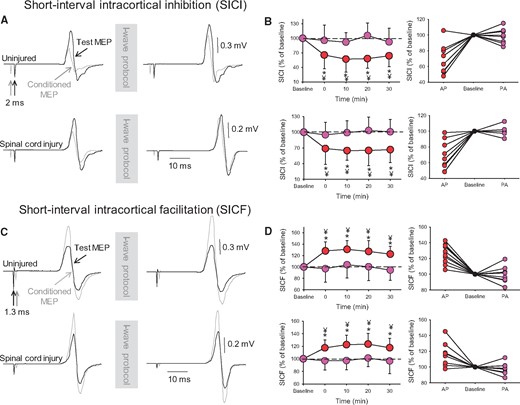
Intracortical inhibition. SICI (A) and SICF (C). Test (black traces) and conditioned (grey traces) MEPs elicited in the first dorsal interosseous muscle of a representative uninjured (upper traces) and SCI (lower traces) subject at an interstimulus interval of 2.0 ms (SICI) and 1.3 ms (SICF) with the coil positioned in the AP orientation before and after the I-wave protocol. For SICI, the conditioning stimulus is given before the test stimulus, and for SICF the conditioning stimulus is given after the test stimulus. Waveforms represent the average of 20 MEPs. Group (left) and individual (right) data are shown in graphs when SICI (B) and SICF (D) were tested with the TMS coil in the AP (red circles) and PA (purple circles) orientation. Note the decrease in SICI (reflected by a number closer to 100%, which indicates that the size of the test and conditioned MEPs are similar) and the increase in SICF (reflected as a number above 100%, which indicates that the size of the conditioned MEPs is larger than the size of the test MEP) in the AP (red circles), but not the PA (purple circles) orientation after the I-wave, in both groups. SICI and SICF values (expressed as a percentage of baseline) are shown for individual subjects when tested with the TMS coil in the AP (red circles) and PA (purple circles) orientation after the I-wave protocol. Error bars indicate SDs. *P < 0.05, comparison between protocols; ¥P < 0.05, comparison with baseline.
Repeated measures ANOVA also showed an effect of Time [F(4,200) = 6.1, P < 0.001], Coil orientation [F(1,200) = 102.8, P < 0.001] but not Group [F(1,200) = 2.2, P = 0.14] and in their interaction [F(4,200) = 0.55, P = 0.69] on SICF. We found that SICF increased in uninjured (by 20.2 ± 3.1%, 10/10, P < 0.001) and in SCI (P < 0.001; 9/10, Fig. 4D) participants compared with baseline for 30 min. The same results were obtained when we adjusted the size of the test MEP to match the size of the test MEP at baseline (SICF increased by 22.6 ± 4.3% in uninjured, P < 0.01 and by 18.6 ± 3.9% in SCI subjects, P < 0.001).
F-waves
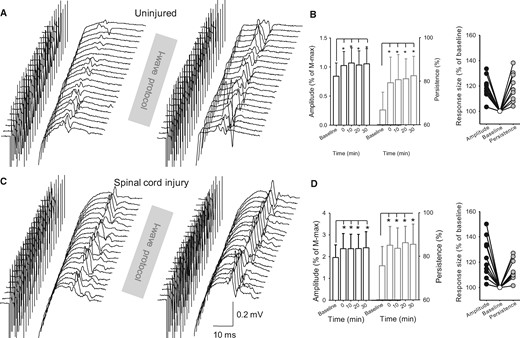
F-waves. Raw M-wave and F-wave traces from the first dorsal interosseous muscle of a representative uninjured (A) and SCI (C) subject before and after the I-wave protocol. Group (B, uninjured, n = 10; D, SCI, n = 10, left) and individual (right) data are shown in both graphs. The abscissa shows the time at which F-waves were tested before (baseline) and after (0, 10, 20 and 30 min) the I-wave protocol. The ordinate shows the F-wave amplitude (left, expressed as a percentage of baseline; black open bars) and persistence (right, expressed as a percentage of baseline; grey open bars). F-wave persistence shows the percentage of stimuli evoking a response (McNeil et al., 2013). F-wave amplitude and persistence values (expressed as a percentage of baseline) are shown for individual subjects when tested after the I-wave protocol. Error bars indicate SDs. *P < 0.05, comparison between protocols.
Voluntary motor output

Voluntary motor output. Force into index finger abduction (upper) and EMG (lower) raw traces from the first dorsal interosseous muscle during brief, fast, index finger voluntary contractions in the abduction direction before (baseline) and after (0, 10, 20, and 30 min) the I-wave protocol from a representative uninjured (A) and SCI (D) subject. Waveforms represent the average of 20 force and EMG traces. Group data (uninjured, n = 10; SCI, n = 10) shows force (B, uninjured and E, SCI) and mean rectified EMG activity (C, uninjured and F, SCI) after the I-wave (red circles) and control (black circles) protocol. Force and EMG activity values (expressed as a percentage of baseline) are shown for individual subjects when tested after the I-wave (red bars) and control (black bars) protocol. Error bars indicate SDs. *P < 0.05, comparison between protocols; ¥P < 0.05, comparison with baseline.
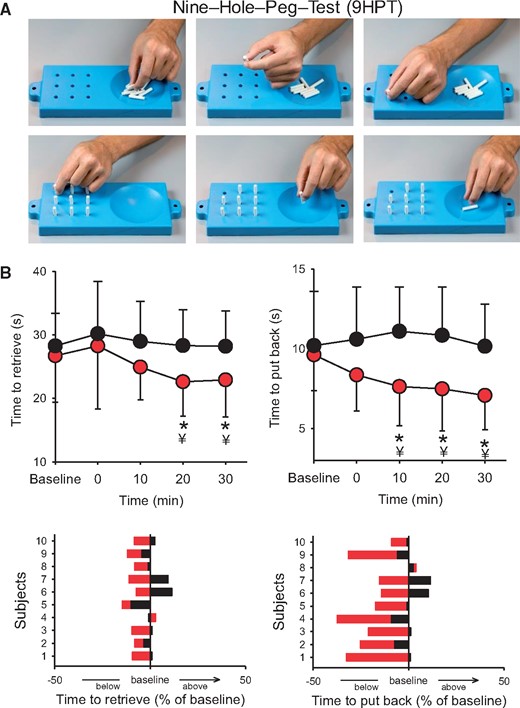
Nine-hole peg test. Manual dexterity was assessed by examining changes in the speed to complete the nine-hole peg test before (baseline) and after (0, 10, 20, and 30 min) the I-wave protocol in participants with SCI. (A) Individual images showing the steps to complete the nine-hole peg test. Note that the top row shows the part of the test where each pin is lifted by a precision grip between the index and thumb and deposited into the reservoir located on the side, while the bottom row shows that each pin is pick up and repositioned back into each hole by a precision grip between the index and thumb (Subject 7 on Table 1). (B) Graph shows group (upper) and individual (lower) data in a participant with SCI (n = 10). The abscissa shows the time of measurements, and the ordinate shows the time to complete the test (in ms) before and after the I-wave (red circles) and control (black circles) protocol. Time to retrieve and replace the pins (expressed as a percentage of baseline) are shown for individual subjects after the I-wave (red bars) and control (black bars) protocol. Error bars indicate SDs. *P < 0.05, comparison between protocols; ¥P < 0.05, comparison with baseline.
Discussion
Our novel findings indicate that late synaptic inputs to corticospinal neurons represent a novel target for improving the recovery of hand function after SCI. We found that repeated pairs of non-invasive cortical stimulation at an interstimulus interval mimicking the rhythmicity of late I-waves in corticospinal volleys enhanced corticospinal transmission and hand voluntary motor output in humans with and without SCI. Intracortical inhibition decreased and F-waves amplitude and persistence increased after the I-wave protocol, highlighting that the motor cortex and the spinal cord might have contributed to the after-effects of this form of stimulation. Repeated stimulation at an interstimulus interval in-between I-waves did not change physiological and behavioural outcomes. We propose that cortical synaptic inputs may represent a novel therapeutic target to enhance motor recovery following chronic incomplete cervical SCI.
A cortical target for promoting motor recovery following SCI
During the past decade, several neuromodulatory strategies have been used to enhance motor function in individuals with SCI. For example, studies have used electrical stimulation of the spinal cord (Gerasimenko et al., 2007; Harkema et al., 2011; Angeli et al., 2014), operant conditioning of spinal reflexes (Thompson et al., 2013), paired corticospinal-motor neuronal stimulation (Bunday and Perez, 2012), and stimulation of the motor cortex (Tazoe and Perez, 2015), with and without training, to improve motor output and other related functions. However, note that in individuals with a clinical diagnosis of complete SCI, invasive epidural electrical stimulation of the lumbosacral spinal cord needs to be combined with extensive periods of training and with the aid of electrical stimulation to result in beneficial behavioural effects (Harkema et al., 2011; Angeli et al., 2014). Also, the beneficial after-effects of non-invasive transcutaneous electrical stimulation of the lumbar spine in humans with complete SCI are mostly evoked in antigravity positions and do not translate yet to independent motor behaviours (Gerasimenko et al., 2007; Tator et al., 2012). Paired corticospinal-motor neuronal stimulation relies on the synchronized arrival of corticospinal descending volleys and antidromic volleys from the periphery at the spinal cord (Bunday and Perez, 2012), while operant conditioning of spinal reflexes is prevented by ablation of the corticospinal tract (Chen et al., 2002) and/or the sensorimotor cortex (Chen et al., 2006). Repetitive TMS over motor cortex has resulted in variable results (Tazoe and Perez, 2015). Thus, neuromodulatory strategies for improving motor recovery after SCI still have constraints and result in limited functional outcomes, highlighting the need for additional targets to strengthen transmission in spared neural networks.
We report a new strategy that mimics the rhythmicity of descending late cortical volleys as a mechanism for strengthening motor recovery in humans with chronic incomplete cervical SCI. Epidural recordings from the spinal cord in humans showed that a single TMS pulse over the motor cortex elicits a series of late I-waves with peaks ∼4–5 ms after the stimulus artefact (Di Lazzaro et al., 2012). Paired-pulse TMS paradigms using interstimulus intervals of ∼4–5 ms have been used to make inferences about the physiology of late I-waves from surface EMG recordings in individuals with (Cirillo et al., 2016) and without (Tokimura et al., 1996; Ziemann et al., 1998a) SCI. Several of our results support the view that we were able to preferentially target volleys with characteristics resembling late I-waves in corticospinal neurons during our I-wave protocol. First, we found that the size of MEPs elicited with the coil in the AP, but not in the PA, orientation increased for ∼30 to 60 min. TMS-induced electric currents flowing in the PA orientation across the central sulcus preferentially evoke highly synchronized corticospinal activity resembling early I-waves whereas currents flowing in the AP orientation evoke less synchronized delayed corticospinal activity resembling late I-waves (Patton and Amassian, 1954; Sakai et al., 1997; Di Lazzaro et al., 2012; Federico and Perez, 2016). Second, we found that SICI, measured by a paired-pulse TMS paradigm using an interstimulus interval of 2 ms decreased after the I-wave protocol in both groups of subjects. Evidence from epidural recordings of descending volleys from the spinal cord and pharmacological studies in humans suggests that changes in SICI relates to activation of γ-aminobutyric acid (GABA) inhibitory circuits in the motor cortex (Di Lazzaro et al., 2000). SICI-related cortical interneurons are also thought to overlap with cortical circuits contributing to the generation of late I-waves (Di Lazzaro et al., 2012). Thus, the decrease in SICI after the I-wave protocol suggests that the motor cortex is a possible site that could have contributed to our results. This also agrees with findings showing that individuals with SCI retain the ability to modulate intracortical inhibition in a task-dependent manner to a similar extent as control subjects (Barry et al., 2013; Bunday et al., 2014). Third, we found that SICF, another paired-pulse TMS paradigm used to make inferences about intracortical inhibition, increased after the I-wave protocol in both groups. Studies using epidural recordings (Di Lazzaro et al., 1999) and pharmacology (Ziemann et al., 1998b) suggested that changes in SICF are related to activation of GABA inhibitory circuits in the motor cortex. SICF at the interstimulus interval measured in our study likely reflects summation of late I-waves inputs (Sakai et al., 1997; Di Lazzaro et al., 2012). Thus, a possible interpretation of our results is that the efficacy of less synchronized AP synaptic inputs, which were preferentially targeted by the I-wave protocol, was potentiated after the stimulation. Another possible interpretation is that our results reflect contributions from other brain areas. AP latencies correlate with functional connectivity between motor cortex and frontal areas (Volz et al., 2014) and brain reorganization after SCI has been shown to be present in a distributed network of motor-related cortical areas (Isa and Nishimura, 2014). Multiple descending motor pathways might contribute to the recovery of hand function after SCI. Indeed, previous data support the view that finger muscles are controlled cooperatively by both corticospinal and reticulospinal pathways after SCI (Baker, 2011; Baker and Perez, 2017). Also, MEP responses tested in our study likely involve an early component by direct activation of the motor neurons by corticospinal neurons and late components due to indirect activation through excitatory inputs from the brainstem and/or spinal cord (Petersen et al., 2010). Thus, it is possible that all these factors influenced our results.
It could also be argued that the activity in spinal cord circuits contributed to our findings as we found that the amplitude and persistence of F-waves increased after the I-wave protocol in both groups of subjects. This is consistent with results showing that late I-waves evoked by TMS receive contributions from subcortical networks (Cirillo and Perez, 2015). It also agrees with evidence showing that late I-waves, measured by TMS, make a crucial contribution to the motor neuron recruitment in SCI and uninjured subjects (Cirillo et al., 2016). A critical question is how repeated activation of late cortical synaptic inputs to corticospinal neurons changed the excitability of spinal motor neurons? A possibility is that better synchronized late corticospinal volleys travelling to spinal motor neurons contributed to this outcome. This is supported by the reduced onset latency dispersion for MEPs tested in the AP but not in the PA orientation in both groups. Corticospinal axons undergo demyelination and progressive atrophy near to and further away from the injury epicentre following SCI (Oudega and Perez, 2012). Reaction times in response to a signal to move are prolonged in subjects with SCI compared with uninjured individuals (Federico and Perez, 2017) and prolonged reaction times in SCI subjects have been related to an altered ability to synchronize corticospinal descending volleys at the spinal cord (Cirillo et al., 2016). This might reflect a longer time needed to raise spinal motor neurons to threshold because of the altered descending drive after the injury. Indeed, spinal motor neurons of subjects with chronic SCI are activated by longer periods of depolarization compared with uninjured subjects (Norton et al., 2008). Note that the latency of excitatory postsynaptic potentials on motor neurons shows a direct relation with the latencies of I-waves (Kernell and Chien-Ping, 1967). Altogether, these factors might contribute to changes in EMG and force outcomes exerted during ballistic index finger voluntary contractions after the I-wave protocol.
Functional considerations
Although we did not record directly from synaptic connections to corticospinal neurons, the specificity of our results support the view that cortical circuits were successfully targeted to facilitate voluntary motor output following chronic SCI. This is important because this site may represent a target that is less affected by the hostility of the injury environment (Oudega and Perez, 2012) and agrees with evidence suggesting that late I-wave synaptic inputs are important to enhance plasticity and motor learning (Hamada et al., 2013, 2014). Studies using other types of targeted plasticity found that some of the beneficial effects of the stimulation on behavioural outcomes can be present a few minutes after the stimulation (Taylor and Martin, 2009; Bunday and Perez, 2012), which might be related to the time when physiological effects are stronger (Taylor and Martin, 2009). In agreement, we found that the group of SCI participants that performed the nine-hole peg test showed larger changes in MEP size and hand dexterity at similar times after the stimulation.
It is difficult to compare the I-wave protocol to other stimulation paradigms resulting in plasticity. The interval between pairs of stimuli used in the I-wave protocol is shorter than what has been used in theta burst stimulation in humans (Huang et al., 2005) and longer than what has been used for sensorimotor cortex stimulation in rodents (Carmel et al., 2010, 2013). There are also differences in the arrangement of trains of stimuli, duration, and other stimulation parameters. I-waves have been recorded in the pyramidal tract in rodents after electrical stimulation (Ohta and Tashiro, 1968), which likely activates the corticospinal axon directly while I-waves tested here in humans are thought to arise from trans-synaptic cortical inputs. Regardless of these differences, our results extend previous findings and demonstrate for the first time that an approach that mimics the rhythmicity of late cortical synaptic inputs on corticospinal neurons represents a strategy to promote motor recovery of hand function following human SCI.
Funding
National Institute of Neurological Disorders and Stroke. Grant Numbers: R01NS076589, R01 NS090622. Department of Veterans Affairs. Grant Number: I01RX000815, I01RX001807.
Supplementary material
Supplementary material is available at Brain online.
Abbreviations
- MEP
motor evoked potential
- MVC
maximal voluntary contraction
- SCI
spinal cord injury
- SICF
short-interval intracortical facilitation
- SICI
short-interval intracortical inhibition
- TMS
transcranial magnetic stimulation
References
Author notes
*These authors contributed equally to this work.

