


Abstract
MicroRNAs (miRNAs) have significant implications in diverse human diseases and have proven to be effectively targeted by small molecules (SMs) for therapeutic interventions. However, current SM–miRNA association prediction models do not adequately capture SM/miRNA similarity. Matrix completion is an effective method for association prediction, but existing models use nuclear norm instead of rank function, which has some drawbacks. Therefore, we proposed a new approach for predicting SM–miRNA associations by utilizing the truncated schatten p-norm (TSPN). First, the SM/miRNA similarity was preprocessed by incorporating the Gaussian interaction profile kernel similarity method. This identified more SM/miRNA similarities and significantly improved the SM–miRNA prediction accuracy. Next, we constructed a heterogeneous SM–miRNA network by combining biological information from three matrices and represented the network with its adjacency matrix. Finally, we constructed the prediction model by minimizing the truncated schatten p-norm of this adjacency matrix and we developed an efficient iterative algorithmic framework to solve the model. In this framework, we also used a weighted singular value shrinkage algorithm to avoid the problem of excessive singular value shrinkage. The truncated schatten p-norm approximates the rank function more closely than the nuclear norm, so the predictions are more accurate. We performed four different cross-validation experiments on two separate datasets, and TSPN outperformed various most advanced methods. In addition, public literature confirms a large number of predictive associations of TSPN in four case studies. Therefore, TSPN is a reliable model for SM–miRNA association prediction.
INTRODUCTION
MicroRNAs (miRNAs) are naturally occurring non-coding entities consisting of small RNA molecules that typically range in length from 21 to 25 nucleotides. They are widely found across organisms, including animals, green algae, plants and viruses [1, 2]. As experimental studies have progressed, researchers have identified that miRNAs are crucial in regulating genes [3]. Research suggests that miRNAs associated with humans exert a regulatory influence on more than 30% of human genes [4]. In addition, miRNAs are key players in a diverse array of essential biological processes [5] that include differentiation, development, cell cycle and apoptosis of cells [2, 6, 7]. An increasing evidence suggests that miRNAs have a crucial gene regulatory role in the pathogenesis of numerous complex diseases, especially cancer. As a result, they have gained significant attention as potential therapeutic targets and promising diagnostic markers [5, 8–11]. Small molecule (SM) drugs possess the attributes of potent biological activity and high delivery efficiency, making them extensively utilized in clinical treatment [12, 13]. Recently, numerous studies have shown that certain SMs can effectively regulate miRNA expression, thereby inhibiting disease cell growth and drug resistance [14, 15]. Considering the intricate and time-consuming nature of developing new SMs, along with the unknown side effects associated with them, an effective therapeutic approach lies in targeting dysregulated miRNAs and regulating their expression using existing SMs [16]. In addition, many recent studies have reported SM–miRNA interactions [17]. For example, mir-21 overexpression occurs in a variety of cancer cells, and paclitaxel can downregulate the level of mature mir-21 to achieve therapeutic effects on the disease [18].
Correlations among SMs, miRNAs and diseases have been verified by the databases SM2miR (version 1) [19] and dbDEMC [20]. As shown in Table 1, miRNAs act as a bridge between SMs and diseases, establishing an association between the two. For example, the SM CID: 45166 uses mir-145 as a therapeutic target to treat kidney cancer.
Briefly list 5 SM–miRNA–disease associations confirmed by databases
| SM | miRNA | Disease | Evidence |
|---|---|---|---|
| CID:45166 | hsa-mir-145 | Kidney neoplasms | SM2miR; dbDEMC |
| CID:10635 | hsa-mir-221 | Esophageal neoplasms | SM2miR; dbDEMC |
| CID:3229 | hsa-let-7b | Colon neoplasms | SM2miR; dbDEMC |
| CID:4091 | hsa-let-7c | Breast neoplasms | SM2miR; dbDEMC |
| CID:5757 | hsa-mir-200a | Lung neoplasms | SM2miR; dbDEMC |
Studying the associations between SMs and miRNAs not only deepens our understanding of drug characteristics and miRNA functions but also provides valuable insights into diseases and their mechanisms. This knowledge offers hope for developing cures for diseases that are incurable at the present. However, the validation of SM–miRNA associations through biological experiments is both complex and costly. As a result, effective and practical computational methods for the SM–miRNA association prediction require being developed.
In recent years, a multitude of computational models have emerged with the primary objective of predicting potential SM–miRNA associations. These models have significantly advanced our understanding in this field of research. SLHGISMMA [26] initially reduced noise by minimizing the kernel norm and sparse norm, followed by integrating SM and miRNA information into a heterogeneous network. The prediction scores were subsequently derived using an iterative algorithm within this framework. Qu et al. [24] designed a three-layer model for SM–miRNA association prediction (TLHNSMMA). They incorporated relevant disease information into the heterogeneous network, thus improving the accuracy and reliability of association prediction. Guan et al. [25] proposed graphlet interaction to predict SM–miRNA associations (GISMMA). The relationship between SMs or between miRNAs in this model was described by graphlet interactions consisting of 28 isoforms. The number of graphlet interactions in the whole SM and miRNA similar networks was calculated separately to predict the SM–miRNA associations. RFSMMA [27] employed a filter-based approach to carefully select impactful features from both SMs and miRNAs, effectively reducing the dimensionality of the feature vector. Subsequently, they used the random forest algorithm to construct the prediction model utilizing these selected features. Wang et al. [28] introduced a new method for cross-layer dependent inference of multilayer networks (CLDISMMA). The model created a multilayer network and used the intra-layer topology and known cross-layer associations to predict SM–miRNA associations across all layers. The minimization nuclear norm method (BNNRSMMA) was proposed by Chen et al. [23]. Initially, they created a two-layer SM–miRNA network and represented the network with its adjacency matrix. Then they used the alternating direction multiplier method to solve its minimizing nuclear norm to obtain the association probability. EKRRSMMA [22] employed a feature dimensionality reduction technique to effectively eliminate noise and utilized an ensemble learning approach for model training, resulting in the generation of accurate prediction scores. A new method based on matrix decomposition (DCMF) was proposed by Wang et al. [21]. First, they utilized the WKNKN method as a preprocessing step for the SM–miRNA association matrix. Then they used the singular value decomposition method to obtain two eigenmatrices and updated them using alternating least squares method. Finally, the multiplication of the two feature matrices resulted in the generation of a prediction score matrix. DAESTB [29] first created a multidimensional feature matrix by incorporating information from different biological matrices. Subsequently, a deep autoencoder was utilized for the purpose of dimensionality reduction and denoising. Finally, a scalable tree augmentation model was utilized to obtain prediction scores. However, the aforementioned methods have certain limitations, as summarized in Table 2.
The primary innovations and limitations of the previous methods
| Methods | Innovative points | Main limitation |
|---|---|---|
| DCMF [21] | Weighted k nearest known neighbors method | The failure to constrain prediction scores within the range of [0,1] |
| EKRRSMMA [22] | Feature dimensionality reduction technology | Bias against SMs/miRNAs with more associated records |
| BNNRSMMA [23] | Bounded nuclear norm | Excessive contraction of singular values |
| TLHNSMMA [24] | Triple layer heterogeneous network | The failure to study new SMs or miRNAs without confirmed association information |
| GISMMA [25] | Graphlet interactions | Not effectively preventing noise interference. |
| SLHGISMMA [26] | Noise removal method | The failure to constrain prediction scores within the range of [0,1] |
Current SM–miRNA association prediction models do not adequately capture SM/miRNA similarity. In addition, some methods use matrix completion to predict SM–miRNA associations, but these methods adopt nuclear norm instead of rank function for matrix completion, which has some shortcomings. Therefore, we proposed a new approach for predicting SM–miRNA associations by utilizing the truncated schatten p-norm (TSPN). First, the SM/miRNA similarity was preprocessed by incorporating the Gaussian interaction profile kernel similarity (GIPK) method. This identified more SM/miRNA similarities and significantly improved the accuracy of SM–miRNA prediction. Next, we constructed a heterogeneous SM–miRNA network by combining biological information from three matrices and represented the network with its adjacency matrix. Finally, we constructed the prediction model by minimizing the truncated schatten p-norm of this adjacency matrix and we developed an efficient iterative algorithmic framework to solve the model. In this framework, we also used a weighted singular value shrinkage algorithm to avoid the problem of excessive singular value shrinkage. The truncated schatten p-norm approximates the rank function more closely than the nuclear norm, so the predictions are more accurate.
The TSPN computational approach has the following advantages. (i) The Gaussian kernel is used to calculate SM/miRNA similarity separately. This identifies more SM/miRNA similarities and significantly improves SM–miRNA prediction accuracy. (ii) The truncated schatten p-norm provides a closer approximation to the rank function compared to the nuclear norm, resulting in improved prediction scores. (iii) We improved optimization algorithm by assigning different weights to the soft threshold shrinkage operation based on the size of singular values. This avoids the problem of excessive shrinkage of singular values. (iv) TSPN could be used to study new SMs or miRNAs that have no confirmed association information. In our experiments, we performed Global Leave-One-Out Cross-Validation (LOOCV), SM-fixed Local LOOCV, miRNA-fixed Local LOOCV and 5-fold Cross-Validation (CV) based on two datasets. We compared our approach with other most advanced models and found that the TSPN method had a relatively high AUC accuracy, especially in the 5-fold CV where its standard deviation was lower. These results demonstrate that TSPN had a higher prediction accuracy and stability for SM–miRNA association prediction. Finally, we conducted four case studies to further validate the superior predictive performance of TSPN.
MATERIALS AND METHODS
SM–miRNA associations
We constructed two datasets to validate the predictive performance of the TSPN model. Therefore, dataset 1 was constructed, comprising 831 SMs and 541 miRNAs. 831 SMs could be downloaded from SM2miR [19], DrugBank [30] and PubChem [31]. In addition, 541 miRNAs could be downloaded from SM2miR [19], HMDD [32], miR2Disease [33] and PhenomiR [34]. Both datasets contained 664 SM–miRNA associations from SM2miR (version 1), consisting of only 39 SMs and 286 miRNAs. Next, we constructed dataset 2 by removing SMs and miRNAs of unknown association pairs in dataset 1. Therefore, dataset 2, which was specifically designed to assess the effectiveness of the model on small datasets, consisted of 39 SMs and 286 miRNAs. The known SM–miRNA matrix was denoted as |$A_{SM} \in R^{m\times n}$|, where |$m$| and |$n$| represent the number of SMs and miRNAs, respectively. The value |$A_{SM} (s_{i},m_{j})$| is equal to 1 when SM |$s_{i}$| and miRNA |$m_{j}$| are correlated, and equal to 0 otherwise. The association matrix |$A_{SM}$| is described as:
Integrated SM–SM similarity
The integrated SM similarity was obtained by combining four methods for calculating similarity [35] that take into account the disease phenotypic similarity of SMs [36], the functional similarity of SM target gene sets [37], the chemical structural similarity of SMs [38] and the side effect similarity of SMs [36].
To calculate the side effect similarity of SMs, we used the Jaccard score [39] of the SM side effect dataset. A higher Jaccard score indicates that two SMs share more side effects and hence are more similar. The functional consistency similarity of SM target gene sets was calculated using the GSFS score [37] of the SM target gene set. The similarity based on SM chemical structures was calculated using the SIMCOMP method [38], which compares the chemical structures of two SMs by finding the maximum common subgraph isomorphism. The similarity based on related disease phenotypes between SMs was calculated using the Jaccard score. The integrated similarity score was calculated using the following formula:
where |$SS(P)$|, |$SS(F)$|, |$SS(C)$| and |$SS(S)$| represent the above four similarity types in turn. The weight parameter |$a_{i}(i\in \left \{1,2,3,4 \right \})$| measures the contribution of each similarity type. To balance the contribution of each similarity matrix, all four parameters were assigned a value of 1.
Integrated miRNA–miRNA similarity
Similarly, we calculated the integrated miRNA similarity by combining two measures of miRNA similarity, namely the disease phenotypic similarity of miRNAs [36] and the functional similarity of miRNA target genes [37].
The disease phenotype-based miRNA similarity was computed using Jaccard scores [36]. The functional properties of the miRNA-based target genes were computed by the GSFS method [37]. The integrated miRNA similarity is obtained as follows:
where |$MM(P)$| and |$MM(F)$| represent the above two similarity types in turn. Similarly, |$\beta _{j}=1(j\in \left \{ 1,2\right \})$| represents the weight parameter.
GIPK similarity for SM and miRNA
By considering the observation that similar SMs tend to be associated with similar miRNAs, we can utilize GIPK similarity to calculate the similarity of both SMs and miRNAs. In the context of a 2D SM–miRNA association matrix, denoted as |$A_{SM}$|, we define |$K(s_{i})$| as a vector comprising the elements of the |$i$|th row, and |$K(m_{i})$| as a vector consisting of the elements of the jth column of |$A_{SM}$|. Vector |$K(s_{i})$| stores the interaction of SM |$s_{i}$| to each miRNA, and similarly vector |$K(m_{i})$| stores the interaction of miRNA |$m_{i}$| to each SM. The formulas for calculating the GIPK similarities of SM and miRNA are as follows:
The coefficients |$\rho _{s}$| and |$\rho _{m}$| are defined as follows:
Integrated final similarity for SM and miRNA
We integrate |$SS$|, |$MM$| and GIPK similarity to obtain our final SM/miRNA similarity matrix. The similarity between SM |$s_{i}$| and |$s_{j}$| is defined as |$SS(s_{i}, s_{j})$|, and the similarity between miRNA |$m_{i}$| and |$m_{j}$| is defined as |$MM(s_{i}, s_{j})$|. We obtain the following final SM similarity matrix |$A_{SS}$| and final miRNA similarity matrix |$A_{MM}$|.
TSPN
The TSPN model, as depicted in Figure 1, consisted of three steps. In the first step, data preprocessing was conducted on three matrices. In particular, we combined GIPK similarity with |$SS/MM$| to obtain the final SM/miRNA similarity. As shown below. In the second step, we constructed a heterogeneous SM–miRNA network by combining biological information from three matrices and represented the network with its adjacency matrix. In the third step, we built the TSPN model and we developed an efficient iterative algorithmic framework to solve the model.
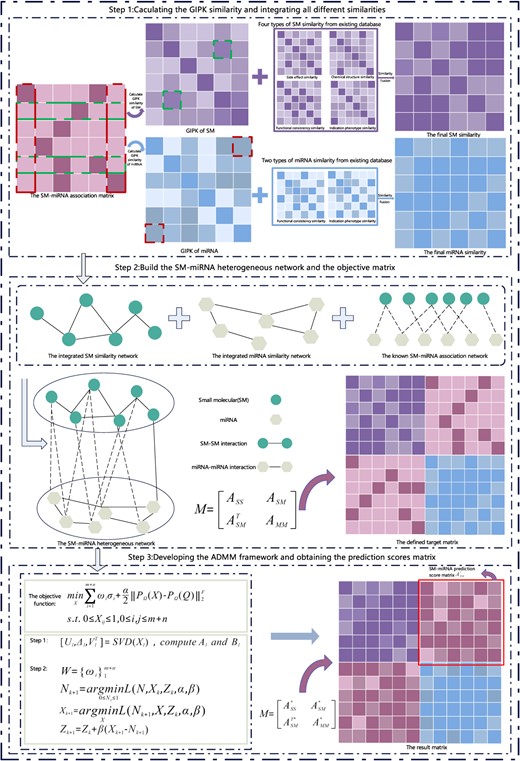
The flowchart of TSPN. Step 1, calculating the GIPK similarity and integrating all different similarities; Step 2, building the SM–miRNA heterogeneous network and the objective matrix; Step 3, developing the ADMM framework and obtaining the prediction scores matrix.
Constructing SM–miRNA heterogeneous network
In this section, a SM–miRNA heterogeneous network was constructed by incorporating biological information from three matrices. The SM–miRNA heterogeneous graph had two kinds of nodes: SM nodes and miRNA nodes. Let |$S= \left \{ S_{1},S_{2},\dots ,S_{m} \right \} $| represent |$m$| SM nodes and |$M= \left \{ M_{1},M_{2},\dots ,M_{n} \right \} $| represent |$n$| miRNA nodes. The similarity scores between the two SMs were employed as the edge weights for the SM–SM network. The miRNA–miRNA networks were constructed similarly, and finally, if an SM and an miRNA were connected in the original dataset, then they were connected in the graph, and the weights of all SM–miRNA edges were specified as 1. We let |$E_{ss}$|, |$E_{mm}$|, |$E_{sm}$| represent SM–SM, miRNA–miRNA and SM–miRNA edges, respectively, and |$W_{ss}$|, |$W_{mm}$| and |$W_{sm}$| represent the weights on these three edges. Then the SM–miRNA heterogeneity graph was represented as |$G_{SM}=\left \{ \left \{ S,M \right \},\left \{ E_{ss},E_{mm},E_{sm} \right \},\left \{ W_{ss},W_{mm},W_{sm} \right \} \right \} $|.
We defined a target matrix in the following manner:
The created target matrix was |$Q \in R^{(m+n)(m+n)}$|, where |$A_{SS}$| and |$A_{MM}$| represent the adjacency matrix of SM and miRNA network, and |$A_{SM}$| denotes the adjacency matrix of SM–miRNA association network.
Building TSPN model
In recent years, matrix completion has gained significant prominence as the main method for solving missing data problems. In our study, we utilized matrix completion to tackle the task of filling in the unknown SM–miRNA association pairs. The objective matrix, denoted as |$Q\in R^{(m+n)(m+n)}$|, and the matrix to be recovered, represented as |$X\in R^{(m+n)(m+n)}$|, were employed for this purpose. Subsequently, we formulated the matrix completion problem using the following model:
where |$rank(\cdot )$| represents the rank function, |$\Omega $| denotes the index of the set of 2D coordinates of SM–miRNA pairs in |$Q$|, and the operator |$P_{\Omega }$| represents the orthogonal projection operator applied to |$\Omega $|.
Because of the nonconvexity and discontinuity inherent in the rank function, there is no existing effective optimization algorithm to solve it directly. Fazel [40] proposed a method for relaxing the rank function as follows:
where |$\left \| X \right \|_{*}= {\textstyle \sum _{i=1}^{m+n}}\sigma _{i}(X)$| refers to the nuclear norm of |$X$|. So far, many studies have shown that the nuclear norm can be employed as an approximate replacement of the rank function. However, nuclear norm minimization also has the drawback. Each singular value should ideally have a unique and substantial impact. It is not appropriate to minimize all singular values equally while ignoring their physical significance, as this often involves overcontraction problems. Therefore, we proposed to replace the rank function with truncated schatten p-norm, which can overcome the above shortcoming. The truncated schatten p-norm means summing to the |$p$|th power of the |$(m+n-r)$| singular values. Mathematically, it can be represented as |$\left \| X \right \|_{r}^{p}=\sum _{i=r+1}^{m+n}\sigma _{i}^{p}(x)$|. Truncated schatten p-norm involves retaining only the most significant first |$r$| singular values while disregarding the smaller ones, thus approximating the rank function of the matrix. Furthermore, by truncating the smaller singular values, it effectively suppresses the impact of noise, leading to a more accurate approximation.
Next, we introduced a crucial lemma for truncated schatten p-norm as follows:
Based on Lemma 1, we improved the original model for minimizing the rank function (equation (11)) and derived a novel model:
Since equation (15) is non-convex, it cannot be solved in the usual way. Therefore, we proceeded to convert the model.
We let |$D(\sigma (X)) = \sum _{i = 1}^{m+n}(1-\sigma _{i}(B^{T}A)(\sigma _{i}(X))^{p}$|. Then the derivative of the equation with respect to |$\sigma (x)$| was
Thus, we obtained the first-order Taylor expansion for |$D(\sigma (X))$|.
We let |$\omega _{i}=p(1-\sigma _{i}\left ( B^{T}A) \right )\left ( \sigma _{i}(X_{k} ) \right )^{p-1} $|. Then |$D\left ( \sigma (x) \right )= {\textstyle \sum _{i=1}^{m+n}\omega _{i}\sigma _{i}(X)}$|, where |$W:= \left \{ \omega _{i} \right \}_{1}^{m+n}$| is a sequence of weights. Therefore, a solvable convex optimization model was obtained. This model (equation (18)) can also be known as the weighted nuclear norm-based model.
Motivated by previous research, we introduced regularization terms to tolerate noise in the integration similarity. We restricted all values of the matrix to the interval [0, 1] to ensure that they were practically meaningful [43, 44]. In summary, we built the following model:
where |$\alpha $| is a balancing parameter and |$0\le X_{i,j}\le 1$| (where |$0\le i,j\le m+n$|) indicates that all elements in |$X$| are in the [0, 1] region.
Solving TSPN
We devised a framework based on the ADMM to address the optimization problem as follows.
Step 1: Initialize |$X_{1} =Q$| and compute the (|$l$|+1)-th iteration of |$X_{l}=U_{l}\bigtriangleup _{l}V_{l}^{T}$|. Then, compute |$A_{l}$| and |$B_{l}$| from |$U_{l}$| and |$V_{l}$|. It has been experimentally verified that |$l\in [1,4]$| works best.
Step 2: Compute the weight |$W= \left \{ \omega _{i} \right \}_{1}^{m+n}$| of the |$k$|-th iteration. Next, the ADMM algorithm is used to solve equation (19). It has been experimentally verified that k = 1 works best.
We introduced new variables and then proceeded by cross-replacing directions while alternating optimization.
The augmented Lagrangian form of equation (20) can be expressed as follows:
where |$Z$| represents the Lagrange multiplier, |$\beta $| represents the penalty parameter, and we initialized all matrices (|$N_{1}$|,|$X_{1}$| and |$Z_{1}$|) to |$Q$|. During the |$k$|-th iterations, |$N_{k+1}$|, |$X_{k+1}$| and |$Z_{k+1}$| are computed sequentially. The iterative algorithm is shown in detail below.
Step 1 (Calculate |$N_{k+1}$|): Fix |$X_{k}$| and |$Z_{k}$| and go through the alternating minimization function L(|$N$|,|$X$|,|$Z$|,|$\alpha $|,|$\beta $|) to update |$N_{k+1}$|. The exact analytic solution of |$N_{k+1}$| has the following obtainable.
We use |$\overline{N}_{k+1}$| to represent the optimal solution of equation (22). The minimum value of L(|$N$|,|$X_{k}$|,|$Z$|,|$\alpha $|,|$\beta $|) occurs when the derivative of equation (22) equals 0, as follows:
where |$P_{\Omega }^{*}$| is the adjoint operator of |$P_{\Omega }$| that satisfies |$P_{\Omega }^{*}P_{\Omega }=P_{\Omega }$|. According to the relevant certificates of Yang et al. [45], we get |$(I+\frac{\alpha } {\beta }P_{\Omega }^{*}P_{\Omega })^{-1}=(I-\frac{\alpha }{\alpha +\beta }P_{\Omega }^{*}P_{\Omega })$|. Thus, we have:
We constrain the value of |$\overline{N}_{k+1}$| to [0, 1] to ensure it is meaningful.
Step 2 (Calculate |$X_{k+1}$|): Fix |$N_{k+1}$| and |$Z_{k}$| and go through the alternating minimization function L(|$N$|,|$X$|,|$Z$|,|$\alpha $|,|$\beta $|) to update |$X_{k+1}$|.
Let |$E_{X}=N_{k+1}-\frac{1}{\beta }Z_{k}$|. Then, we introduce another lemma to solve the above equation.
Therefore, we obtain equation (28) from Lemma 2 as follows:
Step 3 (Calculate |$Z_{k+1}$|): Fix |$N_{k+1}$| and |$X_{k+1}$| and use the gradient ascent method to update |$Z_{k+1}$|.
The termination guidelines for the above iterations are described as follows:
where |$tol_{1}$| and |$tol_{2}$| are the given values from the work of Yang et al. [47].
When the iteration terminates, the result matrix |$Q^{*} $| is obtained as follows:
where |$A_{SM}^{*}$| denotes the SM–miRNA prediction score matrix, and |$A_{SS}^{*}$| and |$A_{MM}^{*}$| correspond to the positions of the processed SM/miRNA similarity matrix, respectively. The specific pseudocode of TSPN is shown in Algorithm 1.

RESULTS
Performance evaluation
We evaluated TSPN’s predictive performance using Global LOOCV, two Local LOOCVs and 5-fold CV on two datasets.
The Global LOOCV maximizes the utilization of training data by excluding only one sample for validation in each iteration, effectively minimizing the sampling error caused by random sampling. The two Local LOOCVs allowed us to evaluate the predictive power of selected SM and miRNA, explore SM–miRNA interactions more effectively, and provide a more complete evaluation of the performance of TSPN. The common feature of these three LOOCVs is that only one known SM–miRNA is excluded for testing at a time, while 663 known association pairs are retained for training. However, the main difference lies in the candidate samples. In the Global LOOCV, candidate samples include all unconfirmed SM–miRNA association pairs. In both of the Local LOOCVs, only unconfirmed SM–miRNA association pairs that include the selected SM/miRNA are considered candidate samples. Therefore, we calculated AUC values to visually evaluate TSPN’s performance in the three cross-validations. Figure 2A shows that TSPN obtained AUC values of 0.9938 (0.8925), 0.9902 (0.8915) and 0.8162 (0.7374) based on two datasets. These results outperformed other advanced models and demonstrated the efficient performance of TSPN for the SM–miRNA association prediction.
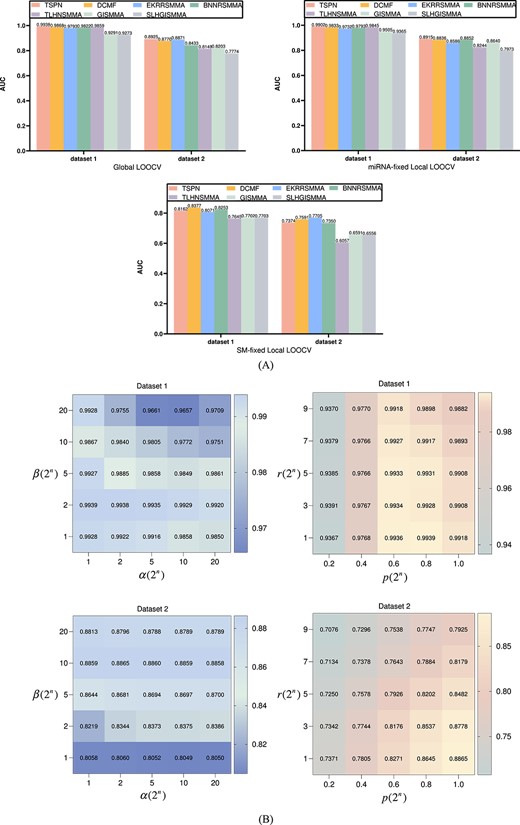
(A) Performance comparison of multiple SM–miRNA association prediction models using Global and Local LOOCV on two datasets. (B) Influence of parameters on TSPN under 5-fold CV experiment on two datasets.
To further evaluate TSPN’s performance, we implemented 5-fold CV using two datasets. The 5-fold CV helps to mitigate bias by preventing an over-reliance on a limited amount of data. We used the obtained scores to sort all predicted SM–miRNA associations accordingly. Subsequently, the AUC values were calculated to visually assess TSPN’s performance. Since 664 known associations were randomly divided, this process was repeated 100 times, and the AUC was averaged over 100 experiments to assess TSPN’s predictive performance. Thus, the AUC and standard deviation of TSPN based on two datasets were 0.9934 |$\pm $| 0.0004 (0.8834 |$\pm $| 0.0038). The same 5-fold CV was implemented for DCMF [21], EKRRSMMA [22], BNNRSMMA [23], TLHNSMMA [24], GISMMA [25] and SLHGISMMA [26], as can be seen in Table 3. TSPN’s AUC value was the highest and its standard deviation was lower than other advanced models, which clearly demonstrated that TSPN predicted SM–miRNA associations with a greater degree of accuracy and stability.
Under 5-fold CV, TSPN was compared to six other methods to evaluate its performance
| Methods | Dataset 1(AUC) | Dataset 2(AUC) |
|---|---|---|
| TSPN | |$\mathbf{0.9934\pm 0.0004}$| | |$\mathbf{0.8834 \pm 0.0038}$| |
| DCMF [21] | 0.9836|$\pm $|0.0012 | 0.8632|$\pm $|0.0042 |
| EKRRSMMA [22] | 0.9767|$\pm $|0.0014 | 0.8560|$\pm $|0.0027 |
| BNNRSMMA [23] | 0.9758|$\pm $|0.0029 | 0.8759|$\pm $|0.0041 |
| TLHNSMMA [24] | 0.9851|$\pm $|0.0012 | 0.8168|$\pm $|0.0022 |
| GISMMA [25] | 0.9263|$\pm $|0.0026 | 0.8088|$\pm $|0.0044 |
| SLHGISMMA [26] | 0.9241|$\pm $|0.0052 | 0.7724|$\pm $|0.0032 |
Independent testing experiment
To further evaluate the reliability of TSPN, we performed an independent test using a novel set of 132 SM–miRNA associations, which were validated by the most recent published experimental literature (Comprehensive information can be accessed in the Supplementary Materials). In the independent testing experiment, the newly identified associations were used for testing, while the original 664 identified associations were used for training. TSPN was then used to acquire the prediction scores. As a result, TSPN obtained an AUC of 0.9970 in the test set validation. The same independent test was performed on BNNRSMMA [23], which obtained an AUC of 0.9891 in the test set validation. Due to the imbalance in the number of positive and negative samples in the independent test experiment, we also introduced AUPR values as an additional evaluation metric. This allowed for a more comprehensive assessment of TSPN’s performance in the independent test experiment. TSPN obtained an AUPR of 0.1318 and BNNRSMMA obtained an AUPR of 0.1104. Comparison results in terms of independent test are shown in Table 4, which clearly demonstrate that TSPN can predict SM–miRNA associations more accurately and reliably.
We further evaluated TSPN’s performance with different ratios of positive and negative samples. Due to the substantial imbalance in sample sizes, with a significantly smaller number of positive samples compared to negative samples, we randomly sampled the negative samples. We divided the positive and negative samples in the independent test experiments into ratios of 1:100, 1:50 and 1:1, respectively. TSPN accordingly obtained AUPRs of 0.4832, 0.6608 and 0.9931. The same operation was performed for BNNRSMMA, which achieved AUPRs of 0.3742, 0.6003 and 0.9887. Therefore, TSPN had better prediction ability under different positive and negative sample datasets, and its prediction ability became more accurate as the ratio of positive and negative samples approached 1:1.
Parametric experiment
Our model has four parameters: |$\alpha $|, |$\beta $|, |$p$| and |$r$|, where |$\alpha $| is the equilibrium parameter, |$\beta $| is the penalty parameter, |$p$| represents the exponent of singular values and |$r$| represents the truncation position of the rank of the target matrix. To ascertain the optimal parameters of TSPN, we performed 5-fold CV using two datasets, as illustrated in Figure 2B. Unlike general 5-fold CV, we did not randomly divide the training and test sets. To optimize the accuracy of the experimental results, we consistently employed identical training and test sets for each experiment. We evaluated the parameters based on the AUC values of the model. After finding the optimal values of |$\alpha $| and |$\beta $|, we fixed them and found the optimal parameters of |$p$| and |$r$|. We found that the optimal parameters for dataset 1 were |$\alpha $| = 1, |$\beta $| = 2, |$p$| = 0.8 and |$r$| = 1, and the optimal parameters for dataset 2 were |$\alpha $| = 2, |$\beta $| = 10, |$p$| = 1 and |$r$|=1.
Ablation experiment
To evaluate the contribution of GIPK similarity to TSPN, we compared the performance of TSPN with and without GIPK similarity under three LOOCVs and 5-fold CV based on two datasets. For descriptive convenience, TSPN without GIPK similarity is noted as TSPN (without GIPK). Figure 3(A) presents a performance comparison between TSPN and TSPN (without GIPK) against AUC based on four different cross-validation experiments for two datasets. As shown in the figure, the AUC of TSPN was consistently higher than that of TSPN (without GIPK) across all cross-validation experiments and both datasets. Therefore, incorporating GIPK similarity into the model significantly improved the accuracy of predicting SM–miRNA associations.
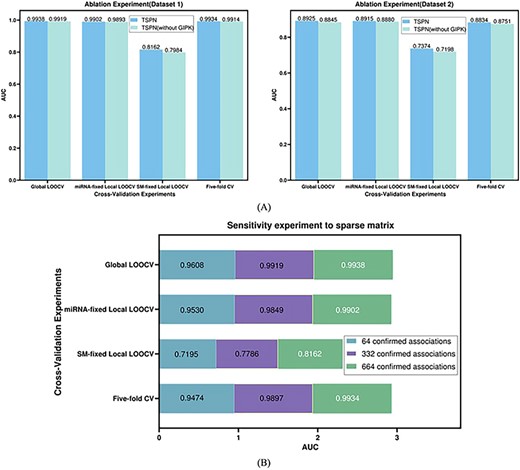
(A) Performance comparison with and without GIPK similarity based under four cross-validations on the dataset 1 and dataset 2. (B) The sensitivity of TSPN to the sparse matrix is evaluated under four cross-validations on dataset 1.
Sensitivity experiment to sparse matrix
For the SM–miRNA associations in dataset 1, we randomly sampled one-tenth and half to assess the sensitivity of TSPN to association matrix sparsity. We performed three LOOCVs and 5-fold CV, repeating the procedure 100 times to reduce bias. Figure 3B shows that TSPN’s performance was positively correlated with the number of known associations. This suggested that with the confirmation of more SM–miRNA associations, the predictive power of TSPN will correspondingly increase. However, even with only 64 known associations, TSPN achieved AUCs of 0.9608, 0.9530, 0.7195 and 0.9474|$ \pm $| 0.0119 (Figure 3B), demonstrating that TSPN was capable of delivering reliable predictions even when working with a sparse known correlation matrix.
Hypothesis testing
To enable a more thorough performance comparison between TSPN and the other tested methods, we conducted hypothesis testing. We first assumed that the LOOCV results of TSPN were the same as the other tested methods, and then we performed t-tests on the results of LOOCV of TSPN and other methods separately to evaluate the significance of the hypothesis tests. Table 5 displays the P-values corresponding to the LOOCV results of TSPN and the other tested methods. A P-value below 0.05 signifies a statistically significant disparity between the LOOCV results of TSPN and the corresponding tested method, implying that TSPN’s LOOCV result outperforms that of the tested method. The results show significant differences between TSPN and other methods in LOOCV of two datasets.
The significance of the differences in model performance between TSPN and the other tested methods in the two datasets was determined by the P-value of the t-test on the LOOCV results
| Dataset | Methods | Global LOOCV | miRNA-fixed Local LOOCV | SM-fixed Local LOOCV |
|---|---|---|---|---|
| Dataset 1 | DCMF [21] | 2.13386e-11 | 0.000247154 | 0.003388714 |
| EKRRSMMA [22] | 8.89520e-40 | 1.23688e-18 | 0.215804585 | |
| BNNRSMMA [23] | 3.49547e-27 | 9.08796e-09 | 0.212840278 | |
| TLHNSMMA [24] | 5.29681e-14 | 0.002424084 | 4.27869e-12 | |
| GISMMA [25] | 3.3959e-282 | 1.45961e-76 | 6.15800e-10 | |
| SLHGISMMA [26] | 5.3850e-289 | 2.9803e-118 | 6.68980e-10 | |
| Dataset 2 | DCMF [21] | 0.014040820 | 0.242448923 | 0.035957174 |
| EKRRSMMA [22] | 0.392176275 | 1.27522e-06 | 0.001417687 | |
| BNNRSMMA [23] | 2.03828e-14 | 0.351708878 | 0.818349860 | |
| TLHNSMMA [24] | 1.21646e-31 | 6.23970e-22 | 2.10193e-33 | |
| GISMMA [25] | 5.88546e-28 | 4.93924e-05 | 1.23363e-13 | |
| SLHGISMMA [26] | 6.84320e-61 | 3.09417e-39 | 1.07241e-14 |
CASE STUDY
To provide a more intuitive assessment of TSPN’s predictive performance, we performed two types of case studies based on dataset 1.
For the first type, we counted the number of the top 10 SM–miRNA associations, which were validated by literature published in PubMed. The results are shown in Table 6, and six of the 10 were confirmed. For example, the first and second evidence of associations in the prediction list were that miR125b overexpression is involved in colorectal cancer invasion and chemoresistance, and that miR-125b confers 5-FU resistance in CRC, possibly by promoting autophagy in vitro and in vivo [48]. The third evidence of association in the prediction list was that by targeting BIRC6, miR-181a increases transcriptional activity and p53 protein expression, promoting 5-FU-induced apoptosis in thylakoid cells [49]. The fourth evidence of association in the prediction list was that downregulation of AEG-1 targeting may improve miR-181a-2 expression [50]. The fifth association in the prediction list was confirmed by SM2miR [19], and the sixth evidence of association in the prediction list was that 4-AAQB facilitates the suppression of SOD2-induced tumorigenicity by triggering the re-expression of SOD2-repressed has-miR-324 [39]. In addition, we performed a first-class case study on BNNRSMMA [23] and DCMF [21]. Table 7 demonstrates that TSPN realizes the best predictive capability.
Based on dataset 1, the top 10 SM–miRNA associations were predicted by TSPN
| Rank | SM | MiRNA | Evidence |
|---|---|---|---|
| 1 | 3385 | hsa-mir-125b-1 | 28176874 |
| 2 | 3385 | hsa-mir-125b-2 | 28176874 |
| 3 | 3385 | hsa-mir-181a-1 | 29795190 |
| 4 | 3385 | hsa-mir-181a-2 | 24462870 |
| 5 | 3385 | hsa-mir-181b-1 | 26198104 |
| 6 | 3385 | hsa-mir-324 | 30103475 |
| 7 | 3385 | hsa-mir-219-a | unconfirmed |
| 8 | 5311 | hsa-mir-324 | unconfirmed |
| 9 | 5311 | hsa-mir-219-a | unconfirmed |
| 10 | 60753 | hsa-mir-23a | unconfirmed |
Notes: (1) CID represents the compound identifier assigned by the Pubchem database. (2) The experimental literature’s PubMed ID is included in the evidence.
To evaluate TSPN’s effectiveness in predicting potential miRNAs associated with new SM, we performed another class of case studies on three common SMs, that is, 5-FU, 5-Aza-CdR, and Etoposide. We listed the top 50 and observed how many were confirmed by the literature published in PubMed. 5-FU is an extensively used chemotherapy drug for the treatment of cancer, and its use is still increasing significantly. It is recognized as the primary medication for the treatment of oral and breast cancers, while also serving as the standard drug for colon cancer treatment [51]. However, its use is subject to cellular resistance leading to poor therapeutic outcomes, and it is possible that miRNAs associated with this play an important role [52]. We used TSPN to infer potentially relevant miRNAs for 5-FU, which are listed in Table 8. Therefore, 14 (29) of the top 20 (50) miRNAs were successfully predicted. For example, the reinstatement of miR-874 suppressed proliferation, diminished colony formation, facilitated apoptosis, and reduced resistance to 5-FU in colorectal cancer cells [53]. Furthermore, the suppression of mir-181a demonstrated amelioration in 5-FU-induced nephrotoxicity, indicating its promising prospects as a fresh therapeutic target for managing nephrotoxicity [54]. In addition, functional assays showed that upregulation of endogenous miR-137 expression increased sensitivity to the chemotherapeutic agent 5-FU and inhibited cancer cell invasion [55].
Based on dataset 1, the top 50 miRNAs predictions for 5-FU
| miRNA (1-25) | Evidence | miRNA (26-50) | Evidence |
|---|---|---|---|
| hsa-mir-1226 | 26198104 | hsa-mir-329-2 | 30127965 |
| hsa-mir-324 | 30103475 | hsa-mir-409 | unconfirmed |
| hsa-mir-500a | unconfirmed | hsa-mir-217 | unconfirmed |
| hsa-mir-501 | 26198104 | hsa-mir-181a-2 | 24462870 |
| hsa-mir-874 | 27221209 | hsa-mir-34b | unconfirmed |
| hsa-mir-24-1 | 26198104 | hsa-mir-379 | 28051262 |
| hsa-mir-650 | unconfirmed | hsa-mir-181a-1 | 29795190 |
| hsa-mir-24-2 | 26198104 | hsa-mir-137 | 25550779 |
| hsa-mir-23a | 26198104 | hsa-mir-412 | unconfirmed |
| hsa-mir-455 | 21743970 | hsa-mir-518c | unconfirmed |
| hsa-mir-27a | 26198104 | hsa-mir-142 | 23619912 |
| hsa-mir-125b-1 | 28176874 | hsa-mir-155 | 28347920 |
| hsa-mir-328 | unconfirmed | hsa-mir-27b | 26198104 |
| hsa-mir-125b-2 | 28176874 | hsa-mir-431 | unconfirmed |
| hsa-mir-346 | unconfirmed | hsa-mir-181b-1 | unconfirmed |
| hsa-mir-133a-1 | 26198104 | hsa-mir-342 | 26198104 |
| hsa-mir-329-1 | 30127965 | hsa-mir-199a-2 | 26198104 |
| hsa-mir-663a | 26198104 | hsa-mir-19a | 26198104 |
| hsa-mir-711 | unconfirmed | hsa-mir-212 | unconfirmed |
| hsa-mir-548o | unconfirmed | hsa-mir-550a-2 | unconfirmed |
| hsa-mir-1307 | 29088787 | hsa-mir-550a-1 | unconfirmed |
| hsa-mir-18a | 32884453 | hsa-mir-202 | unconfirmed |
| hsa-mir-564 | unconfirmed | hsa-let-7c | 25913903 |
| hsa-mir-299 | unconfirmed | hsa-let-7b | 25789066 |
| hsa-mir-3151 | unconfirmed | hsa-mir-372 | unconfirmed |
5-Aza-CDR, a widely employed epigenetic drug, effectively restrains DNA methylation, making it a valuable anticancer agent utilized in the treatment of leukemia and solid tumors [56, 57]. With various biological effects related to DNA methylation [58]. We used TSPN to infer potentially relevant miRNAs for 5-Aza-CdR, which are listed in Table 9. According to available literature, 15 (28) of the top 20 (50) miRNAs were successfully predicted. For example, LY2 cells subjected to a combination treatment of 5-Aza-CdR and trigonelline A (TSA), which is a histone deacetylase inhibitor, elevated levels of miR-200b and miR-200c were observed [59]. In addition, the increased expression of miR-203a and miR-203b in esophageal cancer cells treated with the demethylating agent 5-Aza-CdR indicates that both miRNAs are epigenetically regulated [60]. Furthermore, the expression of miR-375 demonstrated a progressive rise subsequent to the administration of 5-Aza-CdR [61]. In addition, 5-Aza-CdR inhibited CpG methylation and increased miR-29c expression in basal-like breast cancer cells [62].
Based on dataset 1, the top 50 miRNAs predictions for 5-Aza-dC
| miRNA (1–25) | Evidence | miRNA (26–50) | Evidence |
|---|---|---|---|
| hsa-mir-125b-1 | 26198104 | hsa-mir-324 | unconfirmed |
| hsa-mir-125b-2 | 26198104 | hsa-let-7d | 26802971 |
| hsa-mir-18a | unconfirmed | hsa-mir-143 | 28391715 |
| hsa-mir-19a | 26198104 | hsa-mir-155 | 26198104 |
| hsa-mir-145 | 26198104 | hsa-mir-29b-1 | unconfirmed |
| hsa-mir-17 | 26198104 | hsa-mir-16-1 | 26198104 |
| hsa-mir-20a | 26198104 | hsa-mir-194-1 | unconfirmed |
| hsa-mir-19b-1 | unconfirmed | hsa-mir-92a-1 | unconfirmed |
| hsa-mir-24-1 | 26198104 | hsa-mir-148a | 24920927 |
| hsa-mir-203a | 26577858 | hsa-mir-106b | 26198104 |
| hsa-mir-137 | unconfirmed | hsa-mir-346 | unconfirmed |
| hsa-mir-27a | 26198104 | hsa-let-7a-1 | unconfirmed |
| hsa-mir-328 | 23991164 | hsa-mir-29b-2 | unconfirmed |
| hsa-mir-27b | 26198104 | hsa-let-7b | 26708866 |
| hsa-mir-200c | 23626803 | hsa-mir-342 | unconfirmed |
| hsa-mir-21 | 26198104 | hsa-mir-150 | unconfirmed |
| hsa-mir-23a | unconfirmed | hsa-mir-30a | unconfirmed |
| hsa-mir-181a-1 | 26198104 | hsa-mir-26a-1 | unconfirmed |
| hsa-mir-24-2 | 26198104 | hsa-mir-29c | 26539832 |
| hsa-mir-221 | unconfirmed | hsa-mir-200b | 23626803 |
| hsa-mir-126 | 26198104 | hsa-mir-29a | 26198104 |
| hsa-mir-133a-1 | unconfirmed | hsa-mir-124-1 | unconfirmed |
| hsa-mir-181a-2 | 26198104 | hsa-mir-142 | unconfirmed |
| hsa-mir-181b-1 | unconfirmed | hsa-mir-132 | unconfirmed |
| hsa-mir-141 | unconfirmed | hsa-mir-375 | 31949614 |
Etoposide, derived from podophyllotoxin, has exhibited remarkable antitumor effectiveness in various human malignancies, such as lymphomas, germinal tumors, and lung cancer [63]. We used TSPN to infer potentially relevant miRNAs for Etoposide, which are listed in Table 10. Therefore, 13 (25) of the top 20 (50) miRNAs were successfully predicted. For example, the overexpression of miR-18a was involved in the repair process of etoposide-induced DNA damage with significant effects. Specifically, the elevated levels of miR-18a hindered the efficient repair of DNA lesions, resulting in a notable increase in apoptosis [64]. Furthermore, in an etoposide-induced apoptosis model of main cortical neurons in vitro, miR-23a and miR-27a were significantly downregulated, leading to upregulation of pro-apoptotic Bcl-2 family molecules [65]. In addition, in examining the relationship between drug response and microRNA expression, the cell lines most sensitive to etoposide and topotecan were found to exhibit reduced levels of miR-140-5p and miR-9-5p, while simultaneously showing elevated expression of miR-200c-3p [66].
Based on dataset 1, the top 50 miRNAs predictions for Etoposide
| miRNA (1–25) | Evidence | miRNA (26–50) | Evidence |
|---|---|---|---|
| hsa-let-7a-1 | 26198104 | hsa-mir-27a | 25057207 |
| hsa-mir-21 | 26198104 | hsa-mir-124-1 | unconfirmed |
| hsa-let-7e | 26198104 | hsa-mir-638 | 26198104 |
| hsa-let-7a-2 | 26198104 | hsa-mir-124-3 | unconfirmed |
| hsa-let-7a-3 | 26198104 | hsa-mir-124-2 | unconfirmed |
| hsa-let-7b | 26198104 | hsa-mir-125a | 27880721 |
| hsa-let-7i | 26198104 | hsa-mir-16-1 | unconfirmed |
| hsa-let-7g | 26198104 | hsa-mir-146a | unconfirmed |
| hsa-mir-125b-1 | 26198104 | hsa-let-7f-1 | unconfirmed |
| hsa-mir-125b-2 | 26198104 | hsa-mir-155 | 21731696 |
| hsa-mir-222 | 26198104 | hsa-mir-23a | 25057207 |
| hsa-mir-181a-1 | unconfirmed | hsa-mir-26a-1 | unconfirmed |
| hsa-mir-27b | unconfirmed | hsa-mir-99b | unconfirmed |
| hsa-mir-126 | unconfirmed | hsa-mir-24-1 | unconfirmed |
| hsa-mir-181b-1 | 26198104 | hsa-mir-200c | 27247353 |
| hsa-let-7d | unconfirmed | hsa-mir-17 | unconfirmed |
| hsa-mir-145 | unconfirmed | hsa-mir-16-2 | unconfirmed |
| hsa-mir-181a-2 | unconfirmed | hsa-mir-324 | unconfirmed |
| hsa-mir-18a | 23437304 | hsa-mir-31 | unconfirmed |
| hsa-mir-143 | unconfirmed | hsa-mir-30a | 28977798 |
| hsa-mir-221 | 26198104 | hsa-mir-34b | 25639871 |
| hsa-mir-15b | unconfirmed | hsa-mir-29b-1 | unconfirmed |
| hsa-let-7c | unconfirmed | hsa-mir-200b | 36879084 |
| hsa-mir-181b-2 | 26198104 | hsa-mir-663a | unconfirmed |
| hsa-mir-26b | 26198104 | hsa-mir-20a | unconfirmed |
DISCUSSION AND CONCLUSION
Many studies have showcased the potential of combining SM and miRNA drug targets to guide clinical treatments. Since the computational methods applied to SM–miRNA association prediction are low cost and informative, they can be an effective tool for discovering new associations. In this work, we proposed TSPN to predict potential SM–miRNA associations by minimizing the non-convex truncated schatten p-norm. First, we preprocessed SM/miRNA similarity using the GIPK similarity method. We then constructed a heterogeneous SM–miRNA network by combining biological information from three matrices and represented the network with its adjacency matrix. Finally, we constructed the prediction model by minimizing the truncated schatten p-norm of this adjacency matrix and we developed a framework that uses the ADMM to solve the model. TSPN has the following advantages. First, the Gaussian kernel was used to calculate the SM/miRNA similarity separately, which fully exploited the SM/miRNA similarity and significantly improved the association prediction accuracy. Second, the truncated schatten p-norm provides a closer approximation to the rank function compared to the nuclear norm, resulting in improved prediction scores. Third, we improved the optimization algorithm by assigning different weights to the soft threshold shrinkage operation based on the size of the singular values, avoiding the problem of excessive shrinkage of singular values. Finally, TSPN can be used to study SMs or miRNAs that have no known association.
We performed four different cross-validation experiments on two separate datasets, and TSPN achieved the highest AUCs compared with other advanced methods in 5-fold CV, Global LOOCV and miRNA-fixed Local LOOCV. The standard deviation was only 0.0004 in 100 times 5-fold CV experiments on dataset 1, demonstrating the high stability of TSPN. We performed an independent test using a new set of 132 SM–miRNA associations. TSPN obtained an AUC value of 0.9970, reflecting the excellent performance of TSPN on the new known SM–miRNA association test set.
Despite the good performance of TSPN, it still has some limitations. First, the parameters in our model may not be optimal. Second, the existing known associations are still relatively few, which limits the prediction accuracy of the model. In the future, TSPN’s prediction performance can be further enhanced by incorporating additional reliable biological datasets, and we can explore the mechanisms of action between SMs, miRNAs and diseases to propel the progress of drug treatment for diseases. In addition, inspired by some literature [67], we plan to explore a deep learning-based approach to decrease the time cost brought by singular value decomposition algorithms in our future research.
The Gaussian kernel was used to calculate the SM/miRNA similarity separately, which identified more SM/miRNA similarities and significantly improved the SM–miRNA prediction accuracy.
The truncated schatten p-norm provides a closer approximation to the rank function compared to the nuclear norm, resulting in improved prediction scores.
We improved the optimization algorithm by assigning different weights to the soft threshold shrinkage operation based on the size of the singular values, avoiding the problem of excessive shrinkage of singular values.
TSPN could be used to study new SMs or miRNAs with no confirmed association information.
ACKNOWLEDGMENTS
The authors would like to extend their heartfelt appreciation to the anonymous reviewers for their invaluable and constructive feedback.
FUNDING
The research described in this work was supported by the National Key Research and Development Project of China (2021YF A1000102, 2021YF A1000103).
AUTHORS’ CONTRIBUTION
This manuscript was produced by Shudong Wang, Tiyao Liu, Chuanru Ren, Wenhao Wu, Zhiyuan Zhao, Shanchen Pang and Yuanyuan Zhang.
DATA AVAILABILITY
The authors declare that all miRNAs present in the dataset are human-related miRNAs. The Python code and datasets for TSPN can be accessed publicly at https://github.com/Skyrocket-lty/TSPN.git.
Author Biographies
Shu-Dong Wang received the PhD degree in control science and control engineering from Huazhong University of Science and Technology in 2004. She has been teaching in China University of Petroleum (East China) since 2014. Current research interests include biometrics, systems biology, theory and application of DNA computational model.
Ti-Yao Liu is a Master student of College of Computer Science and Technology, Qingdao Institute of Software, China University of Petroleum (East China), Qingdao, China. His research interests include bioinformatics and machine learning.
Chuan-Ru Ren is a Master student of College of Computer Science and Technology, Qingdao Institute of Software, China University of Petroleum (East China), Qingdao, China. His research interests include bioinformatics and machine learning.
Wen-Hao Wu is a Master student of College of Computer Science and Technology, Qingdao Institute of Software, China University of Petroleum (East China), Qingdao, China. His research interests include bioinformatics and machine learning.
Zhi-Yuan Zhao is a Master student of College of Computer Science and Technology, Qingdao Institute of Software, China University of Petroleum (East China), Qingdao, China. His research interests include bioinformatics and machine learning.
Shan-Chen Pang received the PhD degree in computer software and theory from the Tongji University, Shanghai, China, in 2008. He is currently a professor and PhD supervisor with the China University of Petroleum (East China), Qingdao, China. His research interests include bioinformatics and machine learning.
Yuan-Yuan Zhang is currently an associate professor at Qingdao University of Technology, focusing on the application of machine learning in biomics data and complex diseases, and intelligent medical care based on artificial intelligence.
REFERENCES
