


Abstract
Effective classification methods and prognostic models enable more accurate classification and treatment of hepatocellular carcinoma (HCC) patients. However, the weak correlation between RNA and protein data has limited the clinical utility of previous RNA-based prognostic models for HCC. In this work, we constructed a novel prognostic framework for HCC patients using seven differentially expressed proteins associated with ferroptosis and iron metabolism. Furthermore, this prognostic model robustly classifies HCC patients into three clinically relevant risk groups. Significant differences in overall survival, age, tumor differentiation, microvascular invasion, distant metastasis, and alpha-fetoprotein levels were observed among the risk groups. Based on the prognostic model and known biological pathways, we explored the potential mechanisms underlying the inconsistent differential expression patterns of FTH1 (Ferritin heavy chain 1) mRNA and protein. Our findings demonstrated that tumor tissues in HCC patients promote liver cancer progression by downregulating FTH1 protein expression, rather than upregulating FTH1 mRNA expression, ultimately leading to poor prognosis. Subsequently, based on risk score and tumor size, we developed a nomogram for predicting the prognosis of HCC patients, which demonstrated superior predictive performance in both the training and validation cohorts (C-index: 0.774; AUC for 1–5 years: 0.783–0.964). Additionally, our findings demonstrated that the adverse prognosis of high-risk HCC patients was closely correlated with ferroptosis in liver cancer tissues, alterations in iron metabolism, and changes in the tumor immune microenvironment. In conclusion, our prognostic model and predictive nomogram offer novel insights and tools for the effective classification of HCC patients, potentially enhancing clinical decision-making and outcomes.
Introduction
Cancer remains one of the most significant global health challenges, accounting for millions of annual fatalities worldwide [1]. Hepatocellular carcinoma (HCC), the predominant form of liver cancer, ranks as the sixth most frequently diagnosed malignancy and represents the third leading cause of cancer-associated mortality globally, surpassed only by lung and colorectal cancers [1–3]. Clinical studies have shown that surveillance for liver cancer is essential for early detection and intervention, but the clinical outcomes of HCC patients at the same clinical stage can be extremely different [3, 4]. Moreover, the 5-year survival outcomes for HCC patients have seen limited improvement over the past two decades [5]. This clinical challenge stems from HCC's complex molecular heterogeneity, characterized by dysregulation of multiple transcriptional programs and signaling pathways [6–8], underscoring the urgent need for improved classification systems and prognostic biomarkers. Therefore, effective classification methods and prognostic models will provide the possibility for more accurate classification and treatment of HCC patients.
Recently, the generation of multi-omics data for HCC patients has provided the possibility to comprehensively understand the molecular characteristics of HCC and achieve accurate classification of HCC [4, 7–9]. Notably, proteomic data resources from HCC patients have opened a new avenue for robust classification of HCC [6, 9]. These proteomic studies of HCC demonstrated the clinical utility of protein-based stratification, identifying three distinct subtypes [4, 8, 9]. These findings align with growing evidence that proteomic analyses surpass RNA-based approaches for tumor subtyping [10, 11], particularly given the limited correlation between RNA expression and protein abundance [12–15]. Our work revealed striking discordance in mRNA-protein expression patterns for key genes, notably FTH1, which shows elevated mRNA but reduced protein levels in HCC tissues. This paradox highlights critical post-transcriptional regulatory mechanisms in HCC pathogenesis and positions FTH1 as a compelling candidate for mechanistic investigation. While several published studies have consistently identified elevated FTH1 mRNA expression as a prognostic biomarker correlated with adverse survival outcomes in HCC patients [16–19], our comprehensive iron metabolism proteomics analysis revealed a contrasting trend, suggesting a more complex regulatory network underlying FTH1's role in HCC progression. However, the association between the alterations in the expression pattern of FTH1 (both mRNA and protein) and the occurrence, progression, and survival prognosis of HCC remains unclear.
Nusinow et al. found that while RNA abundance can influence protein abundance, they are not the organizers of the primary component of variation of the steady-state proteome. Instead, biological pathways determine the expression of related proteins [15]. Building on this finding, we further investigated the biological context as well as the pathways in which FTH1 is involved. In the human body, ferritin (FTH1 and FTL) not only serves as an iron storage protein but also protects cells from the harmful effects of free iron, while simultaneously playing a role in a variety of crucial functions, such as immune regulation [20–22]. Research indicates that ferritin is essential for maintaining iron homeostasis [22, 23]. Disruption of iron homeostasis leads to ferroptosis, which is critically involved in the progression of liver diseases [24]. Further evidence shows that cancer cell proliferation, particularly in cancer stem cells, is highly reliant on iron availability, and tumor cells can obtain more iron through the modulation of iron-regulatory protein expression [24, 25], a mechanism believed to be crucial in HCC and other tumors.
Given these observations, the inconsistency between FTH1 mRNA and protein expression patterns may be closely related to ferroptosis and iron metabolism dysregulation in liver cancer tissues. This suggests that RNA-based prognostic models for HCC [26–28] may have limited clinical utility due to the complex regulatory mechanisms underlying protein expression. In contrast, proteomic data demonstrates superior predictive capacity for patient survival outcomes than other omics data [10, 11, 29]. Therefore, the present work aims to establish a risk stratification framework for HCC prognosis, leveraging dysregulated differentially expressed proteins (DEPs) in iron homeostasis and ferroptosis regulation. Additionally, based on the constructed prognostic model, we will try to summarize the possible processes underlying the inconsistent differential expression patterns of FTH1 mRNA and protein, which could provide further insight into the molecular processes affecting HCC prognosis.
Methodology
Data collection
In this study, training data were derived from 158 patients in the CHCC-HBV cohort [8], which included transcriptomic and proteomic data, as well as patient clinical information. In order to retain more survival information, 147 HCC samples were ultimately selected for prognostic model construction. For independent external validation of the prognostic model, we subsequently obtained data from 252 HCC patients, including individuals from the early-stage HBV-HCC cohort [4] and the Xing et al. HCC cohort [9]. Subsequently, we selected 122 genes associated with ferroptosis and iron metabolism from existing literature [24, 27, 28, 30] (Table S1). These genes were mainly involved in iron absorption, transport and storage (e.g., FTH1, FTL, TFRC, TF, LTF, etc.); ferritinophagy (e.g., ATG3, SQSTM1, NCOA4, etc.); lipid peroxidation (e.g., ACSL4, ALOX5, etc.); antioxidant defense (GPX4); and iron regulation (e.g., ISCU, ACO1, etc.). The technical workflow of this study is illustrated in Fig. 1A, and the clinical information and data availability of different HCC cohorts are provided in Table 1.
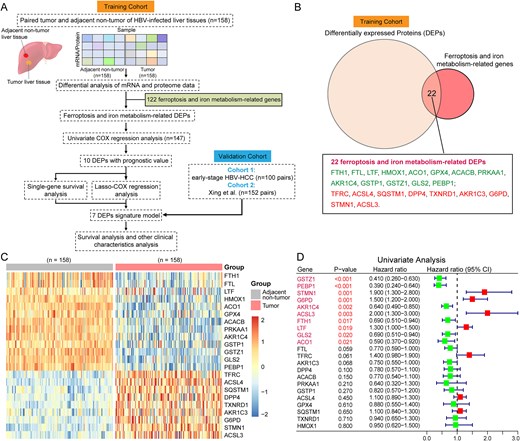
Technical workflow and identification of DEPs related to ferroptosis and iron metabolism. (A) the technical workflow of this study. (B) Identification of DEPs related to ferroptosis and iron metabolism. (C) Heatmap of 22 Ferroptosis and iron metabolism related DEPs (CHCC-HBV cohort). Each column represented a patient sample and rows indicated proteins. Color of each cell showed Z-score of the protein abundance in that sample. (D) Univariate Cox regression analysis of 22 ferroptosis and iron metabolism related DEPs. The forest plots showing the results of the univariate Cox regression analysis between DEP’s expression and overall survival (OS). Statistical significance was determined by the likelihood ratio test.
Clinical characteristics and data availability across different HCC cohorts.
| Cohort Information | Training cohort (CHCC-HBV) | Validation cohort 1 (Early-stage HBV-HCC) | Validation cohort 2 (Xing et al. HCC) |
|---|---|---|---|
| RNA data | |||
| Non-Tumor | 158 | 35 | 0 |
| Tumor | 158 | 35 | 57 |
| Protein data | |||
| Non-Tumor | 158 | 97 | 152 |
| Tumor | 158 | 100 | 152 |
| BCLC stage | |||
| 0/A | 68 | 100 | 64 |
| B/C | 90 | 0 | 88 |
| Gender | |||
| Male | 127 | 84 | 113 |
| Female | 31 | 16 | 39 |
| Age | |||
| < 60 | 106 | 59 | 105 |
| ≥ 60 | 52 | 41 | 57 |
| Viral status | |||
| HBV | 158 | 100 | 142 |
| Tumor size (cm) | |||
| ≤ 5 | 76 | 97 | 60 |
| > 5 | 82 | 3 | 92 |
| AFP level (ng/ml) | |||
| ≤ 300 | 98 | 70 | 90 |
| > 300 | 60 | 30 | 62 |
Identification of DEPs related to ferroptosis and iron metabolism
We performed differential expression analysis of mRNAs and proteins between tumor and adjacent non-tumor liver tissues using the “limma” R package (v3.44.3) [31]. Statistically significant differentially expressed mRNAs or proteins were defined by thresholds of |fold-change| ≥ 1.5 and Benjamini-Hochberg adjusted P-value <0.05 [32]. To identify ferroptosis-related DEPs, we compared the training cohort DEPs against 122 genes functionally linked to ferroptosis and iron metabolism, retaining only overlapping candidates (Fig. 1B).
Feature protein screening and prognostic model construction
Using the ferroptosis and iron metabolism-related DEPs that were previously screened, we conducted univariate Cox regression analysis to identify those significantly associated with overall survival (OS) in HCC patients. DEPs demonstrating a statistically significant association with OS (P-value <0.05) were subsequently subjected to LASSO-penalized Cox regression for further variable selection and shrinkage using the “glmnet” R package (version 4.1-6). The regression incorporated a normalized Z-score matrix of DEP expression levels as the independent variable, with patient survival status and OS duration serving as response variables. The optimal penalty parameter (λ) was determined through ten-fold cross-validation, selecting the largest λ value within one standard error of the minimum cross-validated mean squared error. Meanwhile, the single-gene survival analysis of candidate DEPs was conducted using “survival” (version 3.2–11) [33] and “survminer” R packages (version 0.4.9) [34]. HCC patients were stratified into high- and low-expression groups based on median protein levels, with Kaplan–Meier (KM) survival curves generated and compared via log-rank tests (significance threshold: P-value <0.05). Based on the above analyses, seven DEPs were finally selected to construct a multivariate Cox regression model. Moreover, each patient's risk score was computed by multiplying the Z-score of each DEP by its corresponding regression coefficient, as follows: Risk score = β1X1 + β2X2 + … + β7X7.
Subsequently, we used the minimum P-value method in the “cutoff ” R package (version 1.3) to calculate the optimal cutoff value for grouping, which allowed us to classify patients into high-risk and low-risk groups. Then, KM survival curves and time-dependent ROC (receiver operating characteristic) curves were plotted to evaluate the predictive performance of the risk score for OS in HCC patients.
Clinical characteristics and prognostic independence of different risk groups
To evaluate associations between different risk groups and clinical characteristics, statistical analyses were conducted using Pearson’s chi-squared test, Fisher’s exact test, and the Kruskal–Wallis test [6].
Additionally, to determine whether the risk score was independent of other traditional clinical features, including age, Edmondson grade, gender, history of hepatitis, tumor size, tumor thrombus, alanine aminotransferase (ALT), plasma albumin (ALB), alpha-fetoprotein (AFP), etc., univariate and multivariate Cox regression analyses were performed. Then, for each characteristic variable, the hazard ratio (HR) with its corresponding 95% confidence interval (CI) was calculated, defining statistical significance as P-value <0.05.
Prediction of drug response in HCC patients across different risk groups
Here, we used the “oncoPredict” R package (version 1.2) to predict clinical drug responses in HCC patients. OncoPredict, a computational tool developed by Maeser et al. [35], predicts in vivo drug responses in patients by correlating tissue RNA expression profiles with the IC50 (half-maximal inhibitory concentration) values of cancer cell lines. In this study, we analyzed 198 drugs and compared their predicted sensitivities across different subgroups using the Kruskal–Wallis test, using a significance threshold of P-value <0.05.
Construction and validation of a prognosis predictive nomogram
A nomogram is an intuitive visual tool widely used to predict cancer prognosis, which can help patients and managers understand disease risk more easily [28]. By integrating risk scores and tumor size, we developed predictive nomograms and their corresponding calibration plots using the “rms” R package (version 6.5-0). Prior studies indicate that better prognostic performance of a nomogram is reflected by a calibration curve closely approximating the 45° line (representing optimal prediction) [30]. Using the optimal cutoff value of the nomogram score (determined by the minimum P-value method via the “cutoff” R package), we stratified HCC patients into high- and low-risk groups. Then, the predictive accuracy of the nomogram was evaluated using the concordance index (C-index) and ROC curve analysis. Additionally, ROC curve analysis was employed to compare the sensitivity and specificity of the nomogram with those of individual predictors in predicting the prognosis of HCC patients.
Immune characteristics of HCC patients in different risk groups
To evaluate the immune characteristics of different risk groups, stromal and immune scores were calculated using the “estimate” R package (version 1.0.13). These scores serve as indicators of the abundance of stromal and immune cell signatures within the tumor microenvironment [36]. Furthermore, the proportions of various immune cells (e.g., resting memory CD4 T cells, regulatory T cells (Tregs), M0 Macrophages, resting mast cells) was calculated using CIBERSORTx (https://cibersortx.stanford.edu/). This algorithm deconvolutes bulk RNA-seq data to estimate the relative proportions of distinct immune cell populations within heterogeneous tissue samples [37]. Differences in immune cell abundance between subgroups were then assessed for statistical significance using the Kruskal–Wallis test [6].
Results
Identification of iron metabolism-related DEPs and their association with prognosis
The 1273 DEPs identified in the CHCC-HBV cohort were matched with 122 genes associated with ferroptosis and iron metabolism, and a total of 22 DEPs were screened out (Fig. 1B~C, Table S2). Compared with adjacent non-tumor liver tissues (ANLT), nine DEPs (e.g., TFRC, ACSL4, SQSTM1, etc.) were significantly up-regulated, while 13 DEPs (e.g., FTH1, FTL, LTF, etc.) were significantly down-regulated.
Based on the univariate Cox regression analysis (Fig. 1D), we selected ten DEPs with P-value < 0.05 for subsequent LASSO-penalized Cox regression analysis for further variable selection (Fig. 2A). Through 10-fold cross-validation, eight DEPs achieved the lowest partial-likelihood deviance (Fig. 2B). Meanwhile, since no significant prognostic difference was observed between the high- and low-expression groups of the LTF protein, LTF was excluded from further prognostic model construction. Ultimately, seven ferroptosis and iron metabolism-related DEPs (GSTZ1, PEBP1, STMN1, AKR1C4, FTH1, ACSL3, and G6PD) were identified as significantly correlated with the survival outcomes in patients (Fig. 2C~I).
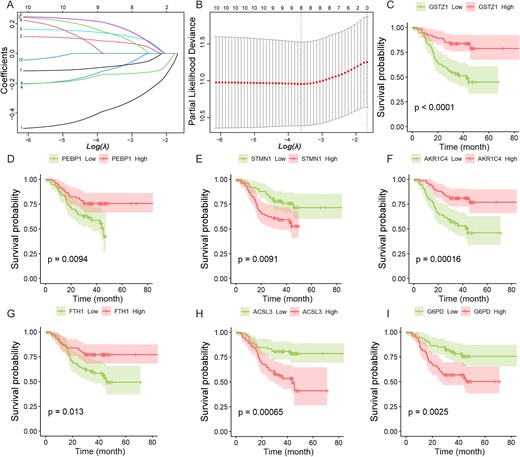
LASSO-penalized Cox regression analysis and single-gene survival analysis based on protein expression.(A) LASSO coefficient profiles of the 10 prognostic DEPs. Each curve represents a coefficient, and the x-axis represents the regularization penalty parameter. As log(λ) (a tuning parameter) changed, the corresponding coefficients of certain DEPs were reduced to zero, indicating that their effects on the model could be omitted. (B) 10-fold cross-validation to select the optimal tuning parameter (λ). Two black vertical lines were plotted at the minimum partial likelihood deviance and minimum 1 standard error, respectively. (C) ~ (I) Kaplan–Meier survival curves of seven DEPs related to ferroptosis and iron metabolism (CHCC-HBV cohort). The statistical significance of survival differences was determined by the log-rank test.
Risk stratification model construction in the CHCC-HBV cohort
Based on multivariate Cox regression analysis of seven DEPs, we first constructed a prognostic model with a C-index of 0.723 and then estimated the regression coefficients of each protein. For each HCC patient, the risk score was computed as the sum of (coefficient × Z-score-normalized expression value) across all DEPs, defined by:
Then, using the minimum p-value method, the optimal cutoff value for risk stratification was determined to be 0.39, which classified 147 HCC patients in the CHCC-HBV cohort into high-risk (n = 53) and low-risk (n = 94) groups (Fig. 3A). The KM survival curve demonstrated that the high-risk group had a significantly worse survival prognosis than the low-risk group (P-value =1.389E-07, HR = 4.22, 95% CI: 2.36–7.54; Fig. 3B). Time-dependent ROC analysis revealed AUC (area under the curve) values of 0.722, 0.780, and 0.749 for 1-, 2-, and 3-year survival prediction, respectively (Fig. 3C).
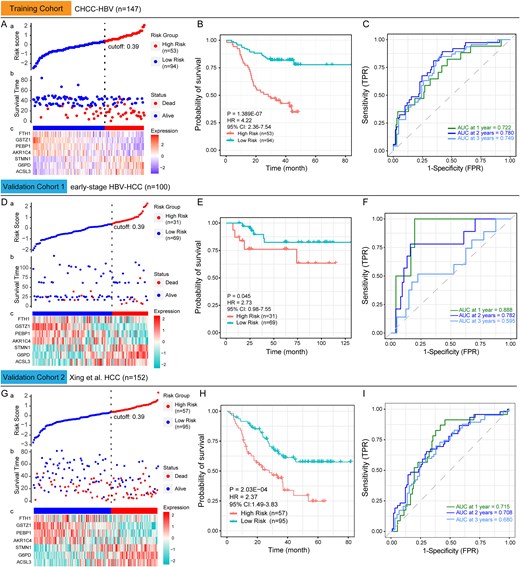
Construction and validation of a prognostic model based on seven ferroptosis and iron metabolism-related DEPs. (A) The distribution of risk scores across different protein expression characteristics in the training cohort. The dotted vertical line divides HCC patients into low-risk and high-risk groups according to the optimal cutoff value of 0.39. (B) Kaplan–Meier survival curves of low-risk and high-risk group in the training cohort. (C) Time-dependent ROC curves for predicting 1-year to 3-year survival in the training cohort. (D) and (G) The distribution of risk scores across different protein expression characteristics in the validation cohort. (E) and (H) Kaplan–Meier survival curves of low-risk and high-risk group in the validation cohort. (F) and (I) Time-dependent ROC curves for predicting 1-year to 3-year survival in the validation cohort. The statistical significance of survival differences was determined by the log-rank test.
Validation of the prognostic model's predictive performance in the external HCC cohorts
In the external cohorts (early-stage HBV-HCC and the Xing et al. HCC cohorts), the differential expression patterns of the seven DEPs were consistent with those observed in the CHCC-HBV cohort (Table S2). This demonstrates that the differential characteristics of these proteins between tumor and non-tumor liver tissues in HCC patients are reproducible, providing a foundation for validating the performance of our model.
Subsequently, the same normalization method was applied to scale the expression levels of these DEPs in the validation cohorts. For HCC patients in the external cohorts, risk scores were calculated by applying the formula developed in the training cohort. Additionally, the optimal cutoff value (0.39) from the training cohort was used to classify HCC patients in the validation cohorts. Analysis revealed that the protein expression of the seven DEPs across risk subgroups (low/high) in the validation cohorts was generally consistent with the findings from the training cohort (Fig. 3D & G). Although the early-stage HBV-HCC cohort has fewer deaths and longer overall survival (Fig. 3D-b), the high-risk group (n = 31) still demonstrated markedly reduced survival compared to the low-risk group (n = 69), as evidenced by KM survival curves (P-value = 0.045, HR = 2.73, 95% CI: 0.98–7.55; Fig. 3E). The AUC values for years 1, 2, and 3 in validation cohort 1 were 0.888, 0.782, and 0.595, respectively (Fig. 3F). The prognostic model's predictive performance was further validated in validation cohort 2 (Fig. 3G~I, P-value = 2.03E-04, HR = 2.37, 95% CI: 1.49–3.83, the AUC values for years 1–3 ranged from 0.680 to 0.715). These findings confirm that the training cohort-derived prognostic model maintains high specificity and sensitivity for predicting HCC patient prognosis in independent validation cohorts.
Differences in ferroptosis and iron metabolism-related DEPs across risk-stratified groups
Using the identified risk groups, we analyzed the expression of 22 ferroptosis and iron metabolism-related DEPs in HCC tumor tissues. Figure S1A illustrates significant differential expression of 15 DEPs between the two risk groups (Training cohort, P-value <0.05). Among these, six DEPs (STMN1, G6PD, ACSL3, TFRC, LTF, and ACSL4) were up-regulated in high-risk patients, while nine DEPs (GSTZ1, PEBP1, AKR1C4, ACO1, GLS2, FTH1, FTL, DPP4, and PRKAA1) were down-regulated compared to the low-risk group. These findings were consistently validated in independent cohorts (Fig. S1B and S1C), confirming reproducible expression patterns across risk-stratified HCC samples.
Interestingly, although LTF (Lactotransferrin) was reduced in tumors compared to ANLT (Fig. 1C), its abundance remained significantly higher in high-risk versus low-risk patients' tumors (Fig. S1A~C). This suggests that liver cancer cells in high-risk HCC patients may absorb more Fe2+ through LTF, thereby altering the iron load and further impacting iron metabolism in these cells.
Quartile-based stratification effectively classifies HCC patients into three clinically relevant risk groups
Most studies constructing prognostic models for HCC patients typically classify them into two risk groups (high and low) [27, 28, 30]. However, previous molecular classification studies have demonstrated that unsupervised clustering analysis can classify HCC patients into three subtypes, which has been well validated in various cohorts [4, 6–8]. Therefore, a binary classification based on risk score may not be the most optimal classification approach.
Accordingly, we employed a quartile-based stratification approach to establish risk score cutoffs for HCC patient classification. Specifically, we ranked the risk scores of HCC patients in the CHCC-HBV cohort from highest to lowest, and used the values at the 25% and 75% positions as the critical values for grouping (0.60 and − 0.59, respectively). Then, risk stratification of the training cohort yielded three groups: High-risk (n = 37), Medium-risk (n = 73), and Low-risk (n = 37) (Fig. 4A). KM survival curves (Fig. 4B) revealed significant survival differences among the three risk groups (P-value = 1.09E-06). Furthermore, significant differences in age, tumor differentiation, AFP levels, and tumor thrombus were observed among the groups (P-value <0.05). Differential expression analysis identified 993 DEPs between high- and low-risk groups (Fig. S2A, Table S3). Gene Ontology (GO) annotation showed that the significantly up-regulated proteins in high-risk patients were primarily enriched in cellular responses to stress, cell cycle, DNA repair, while the down-regulated DEPs were associated with catabolic and biosynthetic process (Fig. S2B). These results indicate that tumors from high-risk patients exhibit higher proliferative activity, potentially contributing to their poor prognosis through accelerated tumor progression.
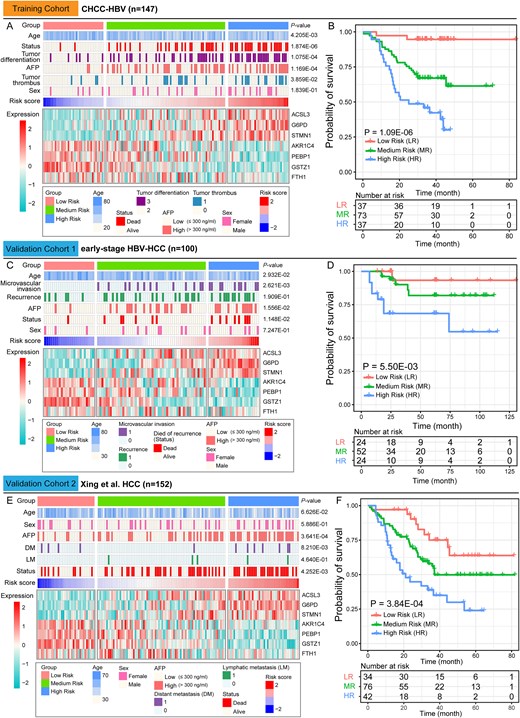
Clinical characteristics of the three HCC risk groups.(A) The clinical characteristics, and the expression abundance of seven DEPs of the three risk groups in the training cohort. (B) Kaplan–Meier survival curves for the low-risk (LR), medium-risk (MR) and high-risk (HR) groups in the training cohort. (C) and (E) The clinical characteristics, and the expression abundance of seven DEPs of the three risk groups in the validation cohort. (D) and (F) Kaplan–Meier survival curves for the low-risk (LR), medium-risk (MR) and high-risk (HR) groups in the validation cohort. Contingency table variables were performed by Pearson's chi-squared test or Fisher's exact test or Kruskal–Wallis test. The statistical significance of survival differences was determined by the log-rank test.
Using the same cutoff values from the training cohort, the early-stage HBV-HCC cohort can also be stratified into High-risk (n = 24), Medium-risk (n = 52) and Low-risk (n = 24) groups (Fig. 4C). Similarly, the Xing et al. HCC cohort were stratified into High-risk (n = 42), Medium-risk (n = 76) and Low-risk (n = 34) groups (Fig. 4E). KM survival analysis confirmed significant survival differences among the three groups in both validation cohorts (Validation cohort 1: P-value = 5.50E-03, validation cohort 2: P-value = 3.84E-04) (Fig. 4D&F). Additionally, significant differences in age, microvascular invasion, distant metastasis (DM), and AFP levels were observed among the groups (P-value <0.05). These findings demonstrate that our prognostic model for HCC patients exhibits strong stability and robust predictive performance.
Comparison of risk groups with the existing HCC molecular subtypes
Here, we compared our risk groups with the protein-based molecular subtypes from the respective original cohorts. In the CHCC-HBV cohort, 67.57% of high-risk patients belonged to the S-Pf subtype, whereas 89.19% of low-risk patients fell into the S-Mb subtype (Fig. 5A-a). In the early-stage HBV-HCC cohort, 75% of high-risk patients were of the S-III subtype, while 87.50% of low-risk patients belonged to the S-I subtype (Fig. 5A-b). Similarly, in the Xing et al. HCC cohort, 76.19% of high-risk patients were from the SIII subtype, compared to 91.18% of low-risk patients from the SI subtype (Fig. 5A-c). Collectively, our analysis reveals that risk-score-stratified subgroups maintain good concordance with the original protein-based molecular subtypes. Moreover, we also compared our findings with the protein-based molecular subtypes identified by Cheng et al. and observed consistent results.
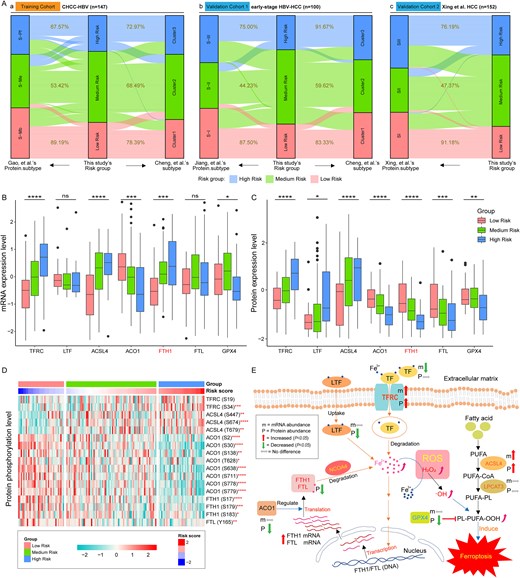
Regulatory pathway and expression levels of ferroptosis and iron metabolism-related proteins in tumor tissues of HCC patients. (A) Association between risk groups with the established HCC molecular subtypes. (B) and (C) Expression levels of seven ferroptosis and iron metabolism-related genes in CHCC-HBV cohort. (D) Phosphorylation levels of ferroptosis and iron metabolism-related proteins in CHCC-HBV cohort. (E) The pathway of ferroptosis and iron metabolism in tumor tissues of HCC patients. ROS means reactive oxygen species (such as H2O2, ·OH, etc.). Then, P-values were labeled above each boxplot with asterisks (*P < .05, **P < .01, ***P < .001, ****P < .0001). The statistical significance of differences was determined by the Kruskal–Wallis test.
Altered FTH1 gene expression patterns are associated with iron metabolism changes in HCC
Combined with our previous findings, we observed completely opposite differential expression patterns of FTH1 mRNA and protein in tumor and ANLT in multiple datasets (Fig. S3). Based on the prognostic framework and known biological pathways, we summarized the possible regulatory processes behind the inconsistent expression patterns of FTH1 mRNA and protein in HCC. First, we detected that the expression and phosphorylation levels of TFRC (Transferrin receptor) were significantly up-regulated in tumor tissues, particularly in the high-risk patient (Fig. 5B~D, Table S2). Previous studies have shown that TFRC can mediate the entry of iron-loaded serotransferrin (TF) into cells and release Fe2+ into the cytoplasm (Fig. 5E) [24]. Meanwhile, tumor tissues from high-risk patients exhibited substantially greater LTF levels than those from low-risk patients (Fig. 5C). These results suggest that liver cancer cells in high-risk patient may absorb more Fe2+ through LTF. The above two uptake pathways will lead to excessive Fe2+ loading in hepatocytes, thereby stimulating the transcription of FTH1 gene, and ultimately causing the up-regulation of FTH1 mRNA abundance in tumor tissues of HCC patients (Fig. 5B and Fig. S3, Table S2).
Then, we also found that the expression and phosphorylation levels of ACO1 (also known as IRP1, iron regulatory protein 1) were significantly reduced in tumor tissues, particularly in the high-risk group (Fig. 5B~D, Table S2). As an RNA-binding protein, ACO1 modulates ferritin mRNA translation efficiency and transcript stability [24, 38]. Thus, low expression of ACO1 protein may significantly affect the translation of FTH1 mRNA into FTH1 protein. In addition, NCOA4 (Nuclear receptor co-activator 4) can mediate the autophagy of FTH1 and FTL, thereby promoting the degradation of intracellular ferritin and leading to Fe2+ release, which is essential for ferroptosis induction mediated by lipid peroxidation [24]. These processes may jointly cause the down-regulated expression of FTH1 (and FTL) protein levels in tumor tissues, ultimately showing inconsistent differential expression patterns of FTH1 mRNA and protein (Fig. 5B&C and Fig. S3, Table S2).
Excessive Fe2+ accumulation is then oxidized to Fe3+ by reactive oxygen species (ROS), generating hydroxyl radicals (·OH). These radicals convert polyunsaturated fatty acid-containing phospholipids (PUFA-PL) into toxic lipid hydroperoxides (PL-PUFA-OOH), which induce oxidative damage to cell membranes and initiate ferroptosis [24, 39, 40]. In this process, the expression of GPX4 (glutathione peroxidase 4) is down-regulated (Fig. 5B&C, Table S2), and the up-regulated expression of the ACSL4 (long-chain fatty acid-CoA ligase 4) can further prove the reliability of this metabolic pathway (Fig. 5B&C, Table S2). The reason is that GPX4 can reduce PL-PUFA-OOH to non-toxic lipid alcohols by using glutathione (GSH) as a reducing cofactor, thereby preventing ferroptosis [41, 42]. However, the significant down-regulation of GPX4 in the high-risk HCC group weakens this anti-ferroptosis pathway. It can be seen that altered FTH1 gene expression patterns are indeed related to changes in ferroptosis and iron metabolism pathways in tumor tissues of HCC patients.
Comparative analysis of clinical drug response in different risk groups
To evaluate clinical drug response in HCC patients, we calculated the predicted drug sensitivity scores for 198 drugs. Statistical analysis revealed significant differences in the sensitivity scores of 67 drugs across the three risk groups (P-value <0.05; Tables S4 and S5). Furthermore, the heatmap revealed that high-risk HCC patients exhibited resistance to 42 drugs and sensitivity to 24 drugs (Fig. S4A). Subsequent correlation analysis between these 67 drugs and HCC patient risk scores identified 25 drugs with significant negative correlations and 19 drugs with significant positive correlations between sensitivity scores and risk scores (Table S6, P-value <0.05). Figure 6A displayed the Pearson correlation coefficients (|r| > 0.2) between sensitivity scores and risk scores for selected drugs. Among these, five drugs showed significant positive correlations with the risk score and additionally demonstrated stronger drug resistance in high-risk HCC patients (Fig. S4B), namely Doramapimod, JAK1_8709, AZD6482, NU7441, and AZD2014. Among the drugs showing sensitivity in high-risk HCC patients, eight drugs exhibited strong negative correlations with risk scores (r < −0.35, Table S6), including seven targeted drugs: Sepantronium bromide (Surviving inhibitor), MK-1775 (Wee1 inhibitor), ULK1_4989 (ULK1 inhibitor), ML323 (USP1/UAF1 inhibitor), WEHI-539 (BCL-XL inhibitor), UMI-77 (Bcl-2 inhibitor), and AZD6738 (ATR inhibitor); along with one chemotherapy drug (Paclitaxel). Notably, these eight drugs exhibited pronounced variations in sensitivity scores across the three risk-stratified groups (Fig. 6B). These findings may provide valuable guidance for optimizing chemotherapy or targeted therapy strategies in high-risk HCC patients.

Predicted clinical drug response in different risk groups. (A) The Pearson correlation coefficients (|r| > 0.2) between predicted drug sensitivity scores and risk scores for selected drugs. (B) Eight anti-cancer drugs showing high sensitivity in high-risk HCC patients. The statistical significance of differences was determined by the Kruskal–Wallis test.
Development and external validation of a prognostic nomogram for HCC patients
To further investigate whether the risk score independently predicts overall survival in HCC patients, we performed univariate and multivariate Cox regression analysis on various clinical features in the CHCC-HBV cohort. The results showed that the risk score (P-value <0.001, HR = 2.0) and tumor size (P-value <0.001, HR = 1.1) were identified as independent prognostic factors (Fig. 7A). Based on these variables, we constructed a nomogram (Fig. 7B) to predict HCC patient survival, which achieved a C-index of 0.774. The calibration curves at 1-, 2-, and 3-year intervals showed strong concordance between model-predicted and actual overall survival outcomes (Fig. 7C), indicating that the nomogram exhibited high predictive accuracy.
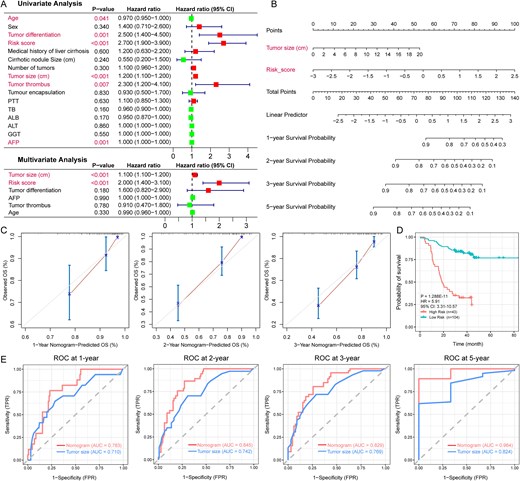
Construction and validation of a prognosis predictive nomogram (CHCC-HBV cohort). (A) Univariate and multivariate Cox regression confirmed that the risk score and tumor size were independent prognostic predictors. (B) The nomogram for predicting the overall survival of HCC patients at 1, 2, 3, and 5 years. (C) Calibration curves of the nomogram for overall survival prediction at 1, 2, and 3 years. (D) Kaplan–Meier survival curves for the low-risk, and high-risk groups in the training cohort (based on predictive nomogram). (E) The ROC curves of the nomogram and tumor size for the survival prediction of HCC patients at 1, 2, 3, and 5 years. The statistical significance of prognosis differences was determined by the log-rank test.
Using the nomogram and the minimum P-value method, the training cohort could be classified into low- (n = 104) and high- (n = 43) risk groups, with an optimal cutoff value of 0.52. KM analysis revealed a significant survival difference between the two subgroups (P-value = 1.288E-11, HR = 5.91, 95%CI: 3.31-10.57; Fig. 7D). The ROC analysis further demonstrated the nomogram's robust predictive ability, with AUCs of 0.783 (1 year), 0.845 (2 years), 0.829 (3 years), and 0.964 (5 years). (Fig. 7E). The results indicate that the nomogram provides higher specificity for predicting HCC patient survival than tumor size alone. To further validate the nomogram’s performance, scores for HCC patients were calculated in the validation cohorts. In the early-stage HBV-HCC cohort, significantly worse survival outcomes were observed in the high-risk group (P-value = 4.039E-03, HR = 4.32, 95% CI: 1.46–12.73; Fig. S5A), with AUC values of 0.901, 0.783, and 0.616 at 1, 2, and 3 years, respectively (Fig. S5B). This prognostic stratification was further validated in external cohort 2, where high-risk patients showed a consistent survival disadvantage (P-value = 5.773E-07, HR = 3.17, 95% CI: 1.967–5.097; Fig. S5C) and maintained robust time-dependent AUCs (0.786, 0.744, 0.718 at 1/2/3 years; Fig. S5D). These findings confirm that the nomogram constructed in the training cohort maintains strong predictive performance in the validation cohorts.
Immune characteristics of HCC patients stratified by risk
We evaluated the immune characteristics of tumors across different risk groups by calculating stromal and immune scores in the CHCC-HBV cohort. Compared to the low-risk group, the high-risk group exhibited significantly reduced stromal and immune scores (P-value <0.05, Fig. 8A). Additionally, we observed significantly lower expression levels of CD81 and CD82 in the high-risk group (P-value <0.001) (Fig. 8B). CD81 and CD82 are known tumor suppressors in several cancers [43–45]. Their downregulation may lead to the loss of important growth control mechanisms, contributing to uncontrolled tumor growth and progression. Furthermore, analysis revealed that the expression of CD276 (an immune checkpoint protein) was substantially higher in the medium- and high-risk groups than in the low-risk group (P-value <0.01, Fig. 8B). CD276 has been shown to inhibit adaptive immunity and T cell activation and proliferation [46]. CD276 levels in cancerous tissues is associated with aggressive growth, low density of CD8+ tumor-infiltrating lymphocyte, and poor prognosis [47].
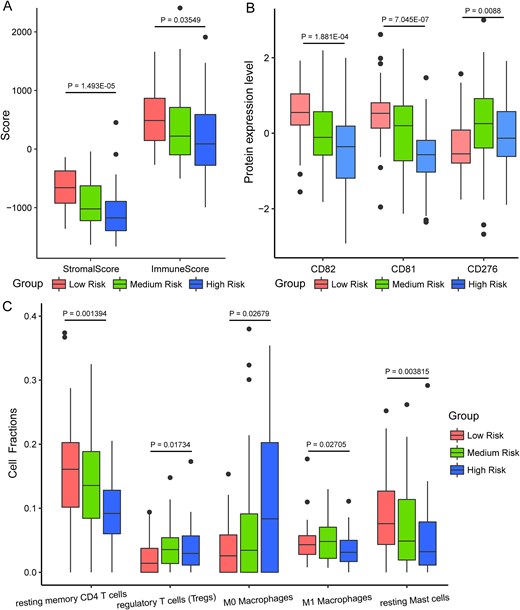
Immune infiltration and microenvironment characteristics of HCC patients in different risk groups (CHCC-HBV cohort). (A) Boxplot of stromal score and immune score of different risk groups. (B) Expression levels of three immune-related proteins across different risk groups. (C) The abundance of five immune-related cell fraction was calculated by using CIBERSORTx algorithm. The statistical significance of differences was determined by the Kruskal–Wallis test.
Meanwhile, the abundances of resting memory CD4 T cells and resting mast cells were significantly lower in the high-risk HCC patients (P-value <0.01), whereas Tregs and M0 macrophages were markedly elevated (P-value <0.05, Fig. 8C). Related studies have reported that memory CD4 T cells play a critical role in protecting tissues from reinfection and cancer [48]. A reduction in resting memory CD4 T cells may indicate a weakened immune response to the tumor. Previous findings reported that Tregs are the most abundant contributors to immune suppression in the tumor microenvironment, not only correlate with tumor progression, invasiveness, and metastasis but also drive immune dysfunction in HCC via several pathways [49, 50]. In addition, the significant decrease in resting mast cell could also contribute to the immunosuppressive tumor microenvironment. These results indicate that high-risk HCC patients exhibit a poor immune microenvironment within tumor tissues, which may contribute to their poor prognosis.
Discussion
Given the limited concordance between transcriptomic and proteomic profiles [12–15], previous prognostic models of HCC based on RNA expression data may have limited clinical impact. Recently, proteomic data from HCC patients have paved the way for more reliable classification of HCC. The reason is that proteins serve as the primary determinants of biological functions and phenotypes [10]. Importantly, post-translational modifications, along with protein expression, reflect the functional condition of the tumor cells [51], which can directly or indirectly reflect the patient's physiological or pathological status. Multiple studies have demonstrated that proteomic data enable more accurate survival prediction compared to other omics data [10, 11].
Interestingly, we observed that the differential expression patterns of FTH1 mRNA and protein in tumor and non-tumor liver tissues were strikingly opposite (Fig. S3). To investigate the underlying causes and their relationship with clinical outcomes in HCC patients, we performed a bioinformatics analysis of biological pathways associated with the FTH1 gene and identified 22 DEPs related to ferroptosis and iron metabolism. Among these, we found seven DEPs whose expression was significantly associated with HCC survival prognosis. Based on multivariable Cox regression of the seven DEPs, we developed a novel prognostic framework for HCC patients. This model robustly classified patients into three clinically relevant risk groups, showing good stability and predictive performance in both the training and external cohorts (Fig. 4). The poor prognosis of the high-risk patients may be closely linked to ferroptosis in tumor tissues, iron metabolism alterations, and changes in the tumor immune microenvironment. Our analysis revealed that FTH1 and FTL proteins were expressed at significantly lower levels in high-risk patients compared to low-risk individuals (Fig. 5C). Ferritin (FTH1 and FTL) functions to shield cells from iron-mediated oxidative damage and also plays a role in immune regulation [20–22]. Low expression of FTH1 and FTL proteins indicates an imbalance in iron homeostasis in liver cancer tissues, which may lead to ferroptosis. Furthermore, cancer cells heavily rely on the trace element iron, and they can increase iron uptake by modulating iron metabolism-related proteins [24, 25]. In our study, the overexpression of TFRC protein in high-risk HCC patients supports this view. The reason is that TFRC can mediate the entry of iron-loaded serotransferrin into cells and release Fe2+ into the cytoplasm [24]. Therefore, based on our constructed prognostic model and known biological pathways, we summarized the possible regulatory processes behind the inconsistent expression patterns of FTH1 mRNA and protein in HCC (Fig. 5E). Our results indicate that tumor tissues in HCC patients promote the progression of liver cancer by downregulating the expression of FTH1 protein, rather than upregulating FTH1 mRNA expression, leading to poor prognosis. With the rapid advancement of AI technologies, such discoveries are expected to be achieved through self-evolving autonomous research systems in the future, enabling automated exploration of clinical information and omics data [52].
Next, we constructed a nomogram incorporating risk score and tumor size to predict HCC prognosis, which demonstrated superior predictive performance in both the training and validation datasets (Fig. 7 and Fig. S5). Compared with previous prognostic models [19, 27, 28, 30], the nomogram developed in this study demonstrated superior predictive performance, exhibiting a higher C-index (0.774) and AUC values (1-year: 0.783, 2-year: 0.845, 3-year: 0.829, 5-year: 0.964). Using this predictive model, we analyzed the immune characteristics of different groups. The analysis revealed significantly lower immune infiltration levels in high-risk patients compared to those in the low-risk group. Specifically, the stromal and immune scores, expression levels of CD81 and CD82 proteins, and abundance of resting memory CD4 T cells and resting mast cells were significantly lower in the high-risk patients (Fig. 8). This suggests that the immune reaction in the high-risk patients is weaker, potentially leading to reduced effectiveness in combating the tumor, which may contribute to the poor prognosis observed in HCC patients in this group.
In the nonsurgical treatment of HCC, sorafenib remains the internationally recognized first-line therapeutic option; however, its clinical benefits are significantly compromised by the development of resistance [53, 54]. In two retrospective studies, metronomic capecitabine (MC), used as a second-line therapy after sorafenib failure in HCC patients, proved to be a well-tolerated systemic treatment with promising results [55, 56]. Our analysis demonstrated that high-risk HCC patients exhibited heightened sensitivity to eight drugs, including Sepantronium bromide (YM-155), ULK1_4989, ML323, and UMI-77 (Fig. 6B). Among these, YM-155 was identified as the most potential drug, aligning with findings reported by Zhao et al. [57]. Xue and colleagues reported that genetic suppression of ULK1 - through either knockdown or knockout approaches - significantly attenuated HCC cell proliferation and invasiveness, while complete ULK1 deletion abolished tumorigenesis in xenograft mouse models [58]. Therefore, ULK1_4989, a ULK1 inhibitor, may inhibit HCC proliferation and invasion by inhibiting ULK1-mediated autophagy activation. These discoveries provide critical insights for refining chemotherapy or targeted therapeutic strategies in HCC patients.
This study has several limitations. For instance, mutational signatures across different risk groups were not analyzed. While genetic variations in known genes are well-established as crucial factors in clinical diagnostics and disease research (particularly in human malignancies) [59], potential genomic alterations in the FTH1 gene remain unclear. We anticipate further exploring these aspects in future research.
Conclusion
In summary, we developed a novel risk stratification framework for HCC patients based on the DEPs related to ferroptosis and iron metabolism. The proposed strategy reliably classified HCC patients into three clinically meaningful risk subgroups and exhibited good generalizability in external validation. Further analysis of the model and known biological pathways allowed us to explore the potential reasons for the inconsistent differential expression patterns of FTH1 mRNA and protein. Our results indicate that tumor tissues in HCC patients promote liver cancer progression by downregulating FTH1 protein expression, rather than upregulating FTH1 mRNA expression, ultimately leading to poor prognosis. Subsequently, the risk score and tumor size were identified as independent prognostic factors for HCC survival, as demonstrated by both univariate and multivariate Cox regression analyses. Finally, we demonstrated that unfavorable survival in high-risk HCC patients is intimately associated with ferroptosis, iron metabolism alterations, and changes in the tumor immune microenvironment. In general, our prognostic model and nomogram provide novel insights for HCC patient stratification, enhancing survival prediction and informing personalized therapeutic strategies.
We developed a novel risk stratification framework for hepatocellular carcinoma (HCC) patients using seven differentially expressed proteins associated with ferroptosis and iron metabolism, which can robustly classify patients into three clinically relevant risk groups.
Significant differences in overall survival, age, tumor differentiation, microvascular invasion, distant metastasis, and AFP levels were observed among the three risk groups in both the training and external datasets.
Tumor tissues in HCC patients promote liver cancer progression by downregulating FTH1 protein expression, rather than upregulating FTH1 mRNA expression, leading to poor prognosis.
The nomogram developed based on risk score and tumor size demonstrated superior predictive performance in both the training and validation cohorts (C-index: 0.774; AUC for 1–5 years: 0.783–0.964).
Author contributions
Z.C. and H.L. conceived and designed the study. Z.C., Y.R., X.W., Y.Z., and performed the experiments and data analysis. Y.R. and Y.H helped in project design. Z.C. drafted the manuscript. All authors (Z.C., Y.R., X.W., Y.Z., Y.H., H.Z., and H.L.) contributed to manuscript revision. Y.H., H.Z., and H.L. supervised the project. All authors have read and approved the final manuscript.
Conflict of interest: The authors declare no conflict of interest.
Funding
This work was supported by the Science and Technology Commission of Shanghai Municipality (STCSM) (Grant number. 23JS1400700); the Neil Shen’s SJTU Medical Research Fund; the Science and Technology Innovation Key R&D Program of Chongqing (Grant number. CSTB2024TIAD-STX0006); and the Computational Biology Program of Science and Technology Commission of Shanghai Municipality (STCSM) (Grant number. 24JS2840300).
Data availability
The datasets can be accessed via the references cited in the Methodology section. All relevant data are contained within the manuscript and its electronic supplementary materials.
References
Author notes
Zhiwei Cheng and Yongyong Ren are co-first authors of this work.
