


Abstract
Untargeted metabolomics is gaining widespread applications. The key aspects of the data analysis include modeling complex activities of the metabolic network, selecting metabolites associated with clinical outcome and finding critical metabolic pathways to reveal biological mechanisms. One of the key roadblocks in data analysis is not well-addressed, which is the problem of matching uncertainty between data features and known metabolites. Given the limitations of the experimental technology, the identities of data features cannot be directly revealed in the data. The predominant approach for mapping features to metabolites is to match the mass-to-charge ratio (m/z) of data features to those derived from theoretical values of known metabolites. The relationship between features and metabolites is not one-to-one since some metabolites share molecular composition, and various adduct ions can be derived from the same metabolite. This matching uncertainty causes unreliable metabolite selection and functional analysis results. Here we introduce an integrated deep learning framework for metabolomics data that take matching uncertainty into consideration. The model is devised with a gradual sparsification neural network based on the known metabolic network and the annotation relationship between features and metabolites. This architecture characterizes metabolomics data and reflects the modular structure of biological system. Three goals can be achieved simultaneously without requiring much complex inference and additional assumptions: (1) evaluate metabolite importance, (2) infer feature-metabolite matching likelihood and (3) select disease sub-networks. When applied to a COVID metabolomics dataset and an aging mouse brain dataset, our method found metabolic sub-networks that were easily interpretable.
INTRODUCTION
In recent years, more and more studies try to probe the metabolome in order to reveal disease pathology and search for early intervention strategy [1]. Untargeted metabolomics data, which are obtained by measuring small molecules in biological specimens in an unbiased manner, can reflect functional changes of regulatory and metabolic pathways. When analyzing disease samples, the metabolome directly reflects the pathological state of the body, leading to discoveries that complement other forms of omics measurements [2, 3].
Currently, the predominant approach for collecting untargeted metabolomics data is by using liquid chromatography–mass spectrometry (LC/MS). LC/MS data are highly noisy, and the preprocessing involves several steps, including peak detection, alignment, retention time correction, weak signal recovery, etc. [4–6]. After pre-processing of LC/MS data, each feature is characterized by mass-to-charge ratio (m/z), retention time (RT) and intensities in the samples. To determine the molecular identities of the features, the common approach is to match features to known metabolites based on mass-to-charge ratio (m/z). Since some metabolites share molecular composition, and various adduct ions can be derived from the same metabolite, a feature can be matched to multiple known metabolites, and a metabolite can also be matched to more than one features [7]. Recent advances in data-independent acquisition (DIA) hold the promise of making metabolite annotation more accurate. However, at the current stage, DIA is still less applicable to large-scale studies [8]. Several methods for LC/MS data have been developed for metabolite annotation by using known metabolites as reference, which incorporate the reaction similarity between metabolites [9].
Three major tasks are involved in the analysis of LC/MS metabolomics data. The first is selecting which features are associated with the clinical outcome under study. The second is to find the corresponding metabolites of the significant features. The third is to find which metabolic pathways are impacted by the biological condition.
Metabolites associated with a specific clinical outcome usually account for a small portion of all metabolites. Determining effective metabolites is essential to understand the underlying biological mechanisms. Many methods are available for high-dimensional feature selection [10, 11]. However, given the matching uncertainty in metabolomics data, selected features do not have a one-to-one correspondence to metabolites, making it difficult to definitively pinpoint the important metabolites.
Besides metabolite selection, metabolic network or pathway analysis is a critical part of the analysis of metabolomics data [12]. Integration of network knowledge makes biomarker signature discovery more robust, stable and interpretable [13]. A number of methods were developed for subnetwork selection using gene expression data [14–16]. Again in metabolomics data analysis, feature-metabolite matching introduces an extra layer of uncertainty that the afore-mentioned methods cannot address.
Among the methods developed specifically for metabolomics data, some pathway analysis methods ignore the matching uncertainty problem [17, 18]. Considering the fact that only one matching can be true for each feature, some recent works have attempted to remove/reduce uncertainty by conducting statistical inference of the matching. Between-feature relations, such as m/z difference conforming to theoretical difference of common adduct ions, and similar retention time, can help determine whether two features are likely to be derived from the same metabolite [7, 19]. Cai et al. [20] tried to combine optimal match selection with feature selection in predictive models, but the selection was binary and lacks proper inference. Shen et al. [21] utilized the similarity of |$MS^2$|, which is not usually available for most features, in reaction-paired neighborhood to infer true matching. These works do not provide a integrated flow for metabolomics data analysis, as they do not systematically calculate the likelihood of the potential feature-metabolite matches, and they do not evaluate the importance of individual metabolites for prediction, both of which are the basis for downstream analysis. In addition, current methods do not allow flexible modeling between metabolite abundance and disease status, which often involve nonlinear relations. To fill the gap, we propose a unified framework to achieve three goals at the same time: (1) evaluate metabolite importance, (2) infer feature-metabolite matching likelihood and (3) select disease sub-networks from the overall metabolic network.
To achieve the goal, we employ the deep neural network approach, which has gained plenty of application in many omics fields with good performance [22–25]. We also drew inspiration from recent research on incorporating domain knowledge into neural networks through the addition of specific architectures or loss functions [26]. We devised a novel deep learning model that contained a gradual sparsification structure based on feature-metabolite matching and the known metabolic network, and designed new measures for intermediate variable importance and edge importance, in order to find important metabolites and most likely feature-metabolite matches. On the technical front, the method can be seen as a knowledge graph-based structurally sparsified model, as it contains a layer-by-layer gradual sparsification structure to better reflect the modular characteristic of biological systems. On the application side, our newly proposed approach can serve as a convenient tool to analyze untargeted metabolic data. Its sparse structure avoids over-parameterization in the high dimensional data – low sample size |$(N<<p)$| scenario, and tends to select metabolites that fall onto sub-networks. It achieves good metabolite selection results and infers the most likely feature-metabolite matching at the same time.
METHODS
Method overview
We propose a unified deep learning framework for analyzing untargeted metabolomics data (Figure 1). It utilizes feature-metabolite annotation relationship and known metabolic network to build up a layer-by-layer gradual sparse neural network. The model analyzes untargeted metabolomics data in a comprehensive way, which supports tasks like classification, metabolite/subnetwork selection and inferring likely matching between feature and metabolite.
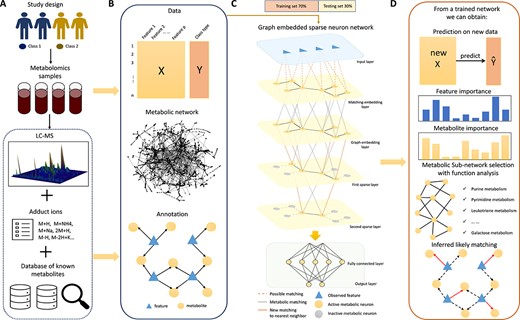
Overview of the integrated deep learning framework. (A) Illustration of data source, which includes analyzing LC–MS data to generate data features (aligned peaks across samples), and mapping features to known metabolites. (B) Integrated information including feature abundance matrix along with clinical outcome, the known metabolic network structure and potential feature matching to metabolites. (C) A layer-by-layer gradual sparse neuron network, which takes feature expression data as input and samples classes as output. It comprises three parts: feature-metabolite embedding based on potential feature annotations, metabolic network embedding and layer-by-layer gradual sparsification, and fully connected layers. (D) Results of a trained model. The model can make classification, determine likely feature-metabolite matching, conduct metabolite and metabolic sub-network selection for functional analysis.
The method starts with a feature abundance matrix, and a table of potential matching between features and metabolites obtained by packages such as xMSAnnotator [27]. There is a well-known matching uncertainty problem. Many metabolites share the same molecular composition, thus one feature can be matched to more than one metabolite. At the same time, each metabolite can generate more than one adduct ions (Figure 1A). Our proposed framework embeds two types of existing connections: (1) feature-metabolite potential matching and (2) metabolite connection through a common reaction in the metabolic network, into a sparsified neural network (Figure 1B).
In the neural network, the first hidden layer is named the matching-embedding layer. Its hidden neurons correspond one-to-one to metabolites. The connections between input nodes and these hidden neurons are determined by the annotation relationship between features and metabolites (Figure 1C). In the second hidden layer, we embed the metabolic network structure as a the graph-embedding layer. The layer again contains neurons that correspond one-to-one to metabolites. A neuron in the graph-embedding layer is connected to a neuron in the matching-embedding layer only when the corresponding metabolite pair are connected on the known metabolic network through a reaction. Beyond the graph-embedding layer are several gradual sparsification layers. Each of these layers only contain neurons that have a connection degree |$\geq $| a pre-specified threshold in the known metabolic network. The deeper the layer, the higher the threshold. After achieving sufficient sparsity, traditional fully connected layers and an output layer follows (Figure 1C).
The network is trained on the training dataset by minimizing cross-entropy loss with the Adam optimizer. Based on the trained model, we can achieve four goals: (1) make predictions for new data, (2) evaluate the importance of metabolites and features, (3) conduct metabolite and sub-network selection for functional analysis and (4) infer likely feature-metabolite matching (Figure 1D).
Knowledge graph-based sparse neural network model
Our newly proposed model is a layer-by-layer gradually sparsified neural network that gradually gather signal around neurons that correspond to hub nodes of an input graph. The sparse structure is designed for solving the problem of limited training data and the exploding computational load when a network goes wider with large number of input variables [28]. When no knowledge graph between input variables are available, a general method to obtain a sparse network starts from training a fully connected network and then pruning the connections iteratively. It has been verified that a suitable sparse network can achieve comparable accuracy compared to fully connected network [29].
In the situation of omics data, the number of variables to consider is in the magnitude of thousands, while the sample size is often in the hundreds. A knowledge graph is available that depicts the functional relations between the variables. Utilizing the knowledge graph is beneficial in two aspects: (1) Achieving a sparse model that is more robust in training when the sample size is small and (2) yielding variable selection results that conform to existing knowledge, making the results more interpretable.
With feature-metabolite matching uncertainties, the untargeted metabolomics data is especially challenging. The metabolic network is available to depict the functional relations between metabolites, and the interest is to find which metabolites and metabolic pathways (subnetworks of the whole metabolic network) are most related to the clinical outcome.
We set up our model with the following assumptions. The first assumption is that each feature has its true annotation among all the given potential matchings. The second assumption is that only a small portion of metabolites are true predictors to the disease outcome, and they tend to fall in small subnetworks of the full metabolic network. These assumptions are widely used and acknowledged in previous works.
In order to find effective metabolites from the original feature abundance data, our model addresses the issue of matching uncertainty by incorporating potential matching relations with metabolic network in a unified framework.
To mathematically formulate our model, we first illustrate the framework of a general neural network for classification task with |$p$| features from |$n$| samples as |$\mathbf{X} \in \mathcal{R}^{n \times p}$| and the outcome variable as |$\mathbf{y} \in \mathcal{R}^{n}$|. Then an |$L$| layers deep neuron network has the following architecture
where |$\sigma ^{l}$| is the activation function at layer |$l$|, |$\mathbf{Z}_l, l = 1,2...,L$| are hidden layers with corresponding weight matrix |$\mathbf{W}_l$| and bias |$\mathbf{b}_l$|. The dimensions of |$\mathbf{W}_l$| and |$\mathbf{b}_l$| depend on the size of neurons in layer |$l-1$| and layer |$l$|. A softmax function |$f$| is used here for classification task, it projects the output layer into probability prediction ranging from 0 to 1. The parameters in weight metrics |$\mathbf{W}_l$| and bias |$\mathbf{b}_l$| are estimated and updated by minimizing the cross-entropy loss between predicted probability |$f(\mathbf{X})$| and real label |$\mathbf{y}$|. The minimizing method includes stochastic gradient decent (SGD), momentum, Adagrad and ADAM etc.
Our proposed neural network is based on the idea of capturing information flow from the metabolic feature layer to clinical outcome layer, constrained by (1) potential feature-metabolite matching and (2) known metabolic network structure. To formulate our idea, we establish a deep neural network with its first and second hidden layers having the same number of neurons as the size of metabolites. Each neuron in these two hidden layers has it unique corresponding metabolite. We first define the |$p$| features as |$x_1, x_2,..., x_p$| and the |$m$| metabolites as |$v_1, v_2,..., v_m$|. To represent all potential matchings between features and metabolites, we use a matching matrix |$M \in \mathcal{R}^{p \times m}$| with
Let |$\mathbf{G} = (V, E)$| be the known metabolic network for the |$m$| metabolites, where |$V = (v_1, v_2,..., v_m)$| is the collection of |$m$| nodes and |$E$| is the collection of edges. Given the network |$\mathbf{G}$|, the corresponding adjacent matrix is |$A \in \mathcal{R}^{p \times p}$| with
The connection between input layer and the first hidden layer (matching-embedding layer) is determined by matrix |$\mathbf{M}$|
where |$\odot $| is the element-wise product, |$\sigma $| is the activation function, |$W_1$| is the weight matrix and |$b_1$| is the bias for the first layer. From the first hidden layer on, we embed metabolic network using matrix |$A$|,
For the next sparse layer, we first determine a sparsification factor |$\mu $| |$(0< \mu < 1)$|, and then decide the size for the sparse layer as |$|l_3| = m \times \mu $|. Based on this number, we include nodes with highest degree rankings in |$G$|, which are named active nodes. We name the nodes not chosen for the next sparse layer as inactive nodes. The connections of active nodes are inherited from the metabolic network. Some inactive nodes do not have a connection to the next layer because their first neighbors on the metabolic network are all inactive nodes. For such nodes, new connections are added to by linking the inactive node to one of its nearest neighboring active nodes on the metabolic network.
Specifically, let us denote the selected nodes as |$\tilde{v_1}, \tilde{v_2},..., \tilde{v_{l_3}}$|, then we have
where |$\tilde{A}^{(3)}$| is the modified connection matrix as described above.
Similarly, we construct several sparsely connected layers beyond hidden layer 3, each smaller than the previous one. After the sparse neural network part, we attach fully connected layers and the last layer outputs the probability prediction for different classes.
Evaluation of feature and metabolite importance
Identifying predictive metabolites is essential for downstream analysis and helps reveal the underlying biological mechanism for better understanding of the clinical outcome. We infer the true matching and evaluate the importance for features and metabolites from the trained model. The idea is similar to the graph connection weights (GCWs) method introduced by [23]. In GCW, the importance of a predictor is reflected by its magnitude of associated weights. Our proposition is that the weight for true matchings gain more attention during the procedure of backward propagation training.
First we consider the estimation of metabolite importance. Compared to GCW, we tried to remove the effect of number of linkages which includes number of matchings to features, as well as the degree in the metabolic network. To avoid zero denominator, we added 1 to the metabolite-feature linkage number of each metabolite. For neurons in the first and second hidden layers, each neuron has an one-to-one mapping to a metabolite, so summing over the absolute values of all its associated weights yields an estimation of importance, i.e.
where |$s_{v_j}$| is the importance score for metabolite |$v_j$| which consists of weight in the first hidden layer |$s_{v_j}^{(a)}$| and weight in the second hidden layer |$s_{v_j}^{(b)}$|. |$w_{k j}^{(1)}$| is weight between input layer and the first hidden layer, |$w_{j t}^{(2)}$| is weight between the first hidden layer and the second hidden layer.
Similarly, we can infer importance of features using weights in the first layer. For each feature, we define its importance as the sum of importance of its potentially associated metabolites, i.e.
where |$s_{x_i}$| is importance score for feature |$x_i$|, and |$s_{v_j}$| is importance score estimated for metabolite |$v_j$|. In this way, we are able to rank metabolites and features and choose the top ones for further analysis. To infer likely matching between features and metabolites, we utilize weights between input layer and the first hidden layer which represents the annotation relationship. A matching with larger absolute weight is considered as more likely since it has bigger impact on model result. To exclude the effect of the number of connections to metabolic neurons, we divide by the sum of absolute weights obtained from matching-embedding layer. The importance of the link between feature |$x_i$| and metabolite |$v_j$| is calculated by,
Detailed model settings
In the model, we employed the rectified linear unit (ReLU) with the form |$\sigma (x) = max(x,0)$| as the activation function. The characteristics of ReLU reduces parameter inter-dependency and alleviates problems like gradient disappearance and overfitting [30]. To train the model, we chose cross-entropy loss and used Adam optimizer [31] with mini-batch to minimize the loss. In the training procedure of mini-batch, we reduced the learning rate with a certain decay rate.
The performance of the model is associated with hyperparameters in the model. Specifically, the parameters include the sparsification factor, size of sparse layer, shape of fully connected layer, drop out rate in the fully connected layer, batch size, learning rate in optimizer, etc. Since tuning hyperparameters was not our primary interest, we simply used grid search to determine the parameters in a feasible space.
RESULTS
Analysis of COVID metabolomics data
During the unprecedented global coronavirus disease 2019 (COVID-19) pandemic, metabolomics-based technologies have been adopted to study the metabolic response to COVID infection. It is critical to understand the association between metabolic patterns with disease severity, and identify physiological processes, which could lead to severe disease outcome. The ST001849 dataset on Metabolomics Workbench was collected to find prognostic markers of COVID infection [32]. We applied our model to the subset of plasma metabolomics data collected at patient admission (day 0) to find metabolites and metabolic pathways associated with the outcome of whether the patient was later admitted to intensive care unit (ICU).
We downloaded the raw LC/MS data and pre-processed the data using apLCMS [6, 33], followed by further processing with combat [34] to remove batch effect. We removed features with zero abundance in ¿|$75\%$| of the samples, and conducted |$log(1+x)$| transformation. Min–max normalization and equidistant projection were performed to unify the scale of the data. The annotation of features to metabolites was conducted using xMSannotator [27]. The KEGG metabolic network was used for the analysis [35]. After the filtering, we obtained a dataset with 1351 features matched to 913 metabolites in 263 samples, 123 of which were later admitted to ICU (label 1) and 140 were not (label 0) (Figure 2A). The average matching value for each metabolite is 3.11, with a range of 1–13. In terms of observed features, the average matching value is 2.11.
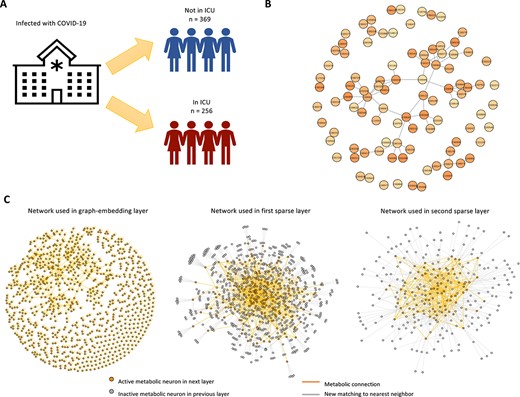
Illustration of COVID metabolomics data and model details. (A) Study setup. Metabolomics data at admission of COVID-19 patients were analyzed for the association with later ICU admission. (B) Selected metabolites and their connections on the KEGG network. (C) Illustration of networks used in graph-embedding layer, first sparse layer and second sparse layers. New matching to nearest neighbor is created for inactive neurons and active connections among active metabolic neurons are inherited from the metabolic network.
The model used a sparsity rate of 0.3 for two sparse layers and a fully connected layer with 20 hidden neurons. The dropout rate in the fully connected layer was 0.3. Seventy percent of samples were chosen as the training set, and the others were used as the testing set. We trained the model with a batch size of 32 for 100 epochs using the Adam optimizer. Ten experiments were conducted, and the final metabolites’ importance scores were averaged over the ten experiments. The average testing accuracy was 0.765. The method output an importance score for each metabolite. To make a selection of important metabolites, we used the local false discovery rate (lfdr) procedure with gamma null distribution proposed in AIME [36]. One hundred and thirteen metabolites were chosen with estimated lfdr |$\leq 0.1$|.
The majority of the 96 important metabolites fell in a relatively compact sub-network shown in Figure 2B. To identify dysregulated metabolic pathways in patients admitted to ICU compared with other patients, we further conducted pathway enrichment analysis based on hypergeometric test, using the metabolic pathway database embedded in the ’metapone’ package [37]. The significant metabolites of several selected metabolic pathways are shown in Figure 3. We observed that central metabolism, including energy, amino acid and nucleic acid metabolism were all correlated with disease severity.
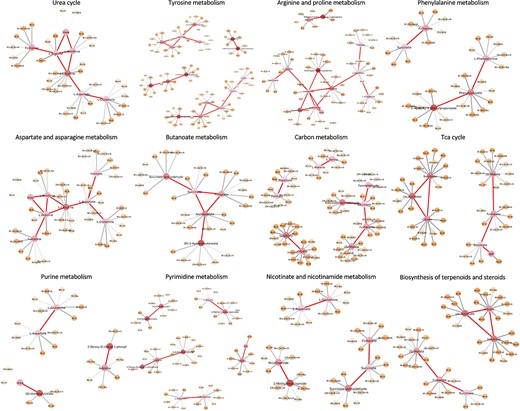
Sub-networks associated with the severity of COVID. Selected metabolic sub-network with metabolite nodes are larger and feature nodes are smaller. The shade of nodes represents metabolite/feature importance. The darker the color, the higher the importance score. The thickness of the edges between features and metabolites represents the confidence of the edge based on the model.
For example, 14 significant metabolites were part of aspartate and asparagine metabolism, 22 were in tyrosine metabolism, 8 were in urea cycle and 7 belonged to arginine and proline metabolism. Other alterations in amino acid metabolism include phenylalanine metabolism etc. It has been found that in the urea cycle, ornithine concentration was higher in critically ill patients. In comparison, arginine concentration was significantly lower, and the conversion of arginine to ornithine in COVID-19 patients was found to dominate in the urea cycle [38]. It is believed that the degradation of arginine exacerbates the inflammatory response. It leads to the accumulation of its downstream metabolites, such as ornithine. These changes ultimately limit the consumption of aspartate and thus increases aspartate concentration. The series of effects have been proved to affect the level of T cell activation [39, 40]. At the same time, the increase of aspartic acid and its downstream product asparagine provides a favorable environment for the translation of viral mRNA. As a result, the body loses its ability to regulate arginine in the development of COVID-19, resulting in an imbalance of the urea cycle and more severe inflammatory damage. Phenylalanine metabolism is enriched in severe and dead groups of COVID patients [41], probably due to severe inflammatory responses that consume large amounts of tetrahydrobiopterin, thus limiting the conversion of phenylalanine to tyrosine in hepatocytes. At the same time, elevated serum phenylalanine further exacerbates the inflammatory process [42].
Pyrimidine and purine metabolism were also top-ranked pathways. Cytosine has been reported as a coordinator of severe acute respiratory syndrome (SARS-CoV-2) cellular metabolism and a key to viral evolution [43]. Studies on inflammatory responses have shown that inhibition of pyrimidine biosynthesis can reduce the release of inflammatory cytokines, while inhibition of purine metabolism enhances inflammatory responses [44, 45]. Dysregulated immune response can cause cytokine storms, leading to severe lung inflammation and even systemic chain reactions such as septic shock and multi-organ failure [46]. IL-2, IL-6, IL-7, IL-10, and macrophage inflammatory protein had higher expression levels in patients who were in ICU [47]. Nicotinamide leads to the inhibition of poly ADP ribose polymerase (PARP) activity, which in turn reduces nitric oxide synthase expression. The procedure reduces free radicals and pro-inflammatory cytokines [48]. Therefore it is thought that pro-inflammatory cytokines can be reduced by supplementation with nicotinamide. This explains our finding of the nicotinate and nicotinamide metabolism pathway.
Other significant pathways included carbon metabolism, biosynthesis of terpenoids and steroids, TCA cycle and butanoate metabolism. Studies have shown that DNA and RNA viruses rewire host cell metabolism by altering central carbon metabolism pathways, including glycolysis, TCA cycle, amino acid synthesis/degradation and others. Elevated levels of glucose and pyruvate have been observed in COVID-19 patients [49] because of a dramatic reduction in energy production and disruption of cellular energy metabolism [50]. At the same time, due to changes in liver dysfunction, the permeability of the gastrointestinal tract is increased, and the digestion and absorption of amino acids and proteins are abnormal [51]. When comparing severe and mildly ill COVID-19 patients, it was found that the development of COVID-19 leads to an increase in lactic acid in the body, possibly due to lack of oxygen inhalation and nutrient intake in the progression of the disease [38].
Overall, our method selected metabolites and metabolic pathways that were plausible from the COVID dataset. At the same time, it was able to simultaneously assign importance scores to features. In Figure 3, yellow nodes represent data features. The darker the color, the higher the importance score. The method also assigned confidence levels to the potential feature-metabolite matching (gray edges in Figure 3). Thicker gray edges meant stronger confidence in the matching.
Application on aging mouse brain data
We applied our method on the aging mouse brain data from the metabolomics workbench [52]. In mammals, the brain change significantly during aging, resulting in cognitive decline, memory loss and change in sleeping mode. A comprehensive understanding of how brain metabolism changes during aging is lacking. We tried to utilize the mouse brain metabolomics data to uncover changes during healthy aging.
The mouse brain dataset contains 16 mice (8 male and 8 female) at three ages: AD (3 weeks), EA (16 weeks, early adulthood) and MA (59 weeks, middle age), collected on 10 regions of the brain. This makes the total sample size 480. We removed features with 75% zero abundance across samples, and selected those matched to metabolites on the KEGG metabolic network [35]. We eventually obtained a dataset with 671 features matching to 713 metabolites. We conducted log transformation and used min–max normalization to scale the data in a range of –500 to 500. We fit our model utilizing samples collected at EA and MA periods to study the effect of healthy aging on the brain, which involved 320 samples. The classification task was to differentiate MA samples from EA samples. We combined the data from all ten brain regions to find the general pattern of metabolic change in the brain’s healthy aging. To incorporate the brain region information, we added 10 neurons with brain regions represented by a one-hot encoding and connected them to the first fully connected layer.
Since the data came from 10 brain regions, the diversity increases the difficulty of training. Therefore, we added a batch normalization layer after the Rectified Linear Unit (ReLU) activation in each layer to stabilize the training process. Seventy percent of samples were used for training, and the remainder served as a testing set. Using the Adam optimizer, we trained the model with a batch size of 64 for 200 epochs. The importance scores of metabolites and features, as well as the confidence in metabolite-feature matching, were averaged over ten repeated experiments. The average classification accuracy on the test set was 0.8750. Using the local fdr procedure with gamma null distribution, metabolites with estimated lfdr |$\leq 0.05$| were regarded as significant. Fifty-six metabolites were selected. Figure 4 shows the selected metabolic sub-networks and their functional annotations.
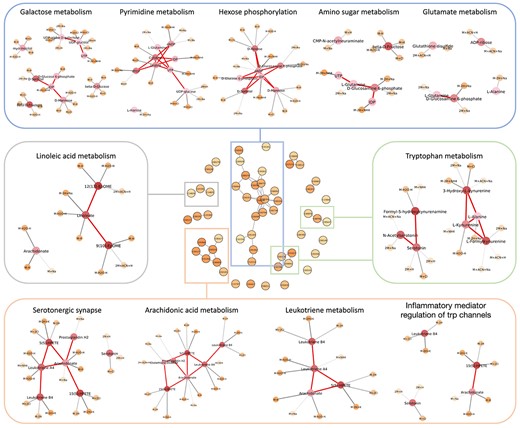
Selected metabolites from the aging mouse brain data. Middle: Selected metabolites and their connection on the KEGG metabolic network. Functional analysis of the local structure in the sub-network are shown in different color boxes. The shades of color on nodes represent the importance score. The darker the color, the higher the importance score. The thicker the edge between features and metabolites, the higher the confidence.
Aging leads to synaptic damage and neural system dysfunction. Existing studies have pointed out neurobiological changes happen in the hippocampus during aging, such as increased oxidative stress, neuroinflammation and alteration of intracellular signaling [53]. This series of changes may lead to the occurrence of neurodegenerative diseases, such as Alzheimer’s disease and amnesia. In the selected metabolic sub-network, the largest component involved sugar metabolism, and the second largest number of sub-networks was mainly related to neural signaling.
Altered neural signaling is a hallmark of aging. Our method found two significant pathways including ’serotonergic synapse’ and ’inflammatory mediator regulation of trp channels.’ Serotonine (5-hydroxytryptamine, 5-HT) is a monoamine neurotransmitter that regulates many physiological targets. Saleem et al. [54] found that decreased levels of 5-HT were detected in the frontal cortex and hippocampus of aged rats. At the same time, 5-HT was also found to be decreased in Alzheimer’s disease and amnesia patients [55], which indicates that 5-HT is involved in innervation-related cognitive decline. Partially overlapping with the serotonergic synapse pathway, the TRP channels pathway play a crucial role in regulating calcium homeostasis related to various cellular functions [56]. Abnormalities in TRP channels may lead to excessive calcium influx, disrupting pH levels and neuronal homeostasis [57], leading to age-related neurodegenerative diseases.
The brain aging process is also closely related to increased inflammation in the body. Pathways including ’galactose metabolism,’ ’linoleic acid metabolism,’ ’arachidonic acid metabolism’ and ’leukotriene metabolism’ are involved in the inflammation process. It has been shown that galactose metabolism is able to induce the accumulation of reactive oxygen species (ROS) in neural progenitor cells in dentate gyrus (DG), and the procedure is related to the decrease of neurogenesis in the DG region [58]. In addition, the concentration of arachidonic acid, a metabolite of linoleic acid, is related to the activity of catalase, which belongs to the antioxidant system of the brain [59]. Supplementation of arachidonic acid can help maintain neuronal membrane fluidity and keep hippocampal plasticity, which benefits the restoration of memory [60]. However, an up-regulation of arachidonic acid and its downstream products may exacerbate brain neuroinflammation and excitotoxicity [61]. From elderly neuritic plaque areas, arachidonic acid was found to be widely elevated [62]. As one of the metabolites of arachidonic acid, leukotriene contribute to the disorder of neuropathology, and it has been recognized as a potential drug target for Alzheimer’s Disease [63].
Aging alters amino acid metabolism. The decrease in glutamic acid levels in hippocampus is associated with age-related neuron density change [64]. Since glutamic acid is a neurotransmitter of most hippocampus neurons, the reduction of glutamic acid in the hippocampus area can explain the loss of neurons [65]. Glutamic acid has been found to participate in several age-related neurodegenerative diseases [66]. Similarly, changes in tryptophan metabolism can impair the balance between neurodegenerative and neuroprotective processes. Specifically, aging may reduce tryptophan levels and shift the balance between kynurenine (KYN) and serotonin (5-HT) pathways to the latter [67]. This phenomenon was found to be more evident in Alzheimer’s disease patients [68]. The 3-hydroxy kynurenine (3-OH KYN) and quinolinic acid (QUIN) in the KYN pathway have neurotoxic effects, whereas kynurenic acid (KYNA) has a protective effect [69]. The disruption of the balance between KYN and 5-HT can therefore damage the nervous system.
Moreover, impaired energy metabolism also significantly affects neuronal activity and plasticity, which explains our finding of the pathways including ’pyrimidine metabolism’ and ’hexose phosphorylation.’ Many studies found significant imbalance of cellular energy metabolism in the aging brain. A metabolic study found pyrimidine accumulation in aging individuals, and another research showed aging hippocampal neurons were more capable of oxidizing glucose in glycolysis [70, 71]. We also found ’nucleotide sugars metabolism’ and ’amino sugar metabolism’ correlated to brain aging, and this finding is consistent with previous research [72].
Overall, with the mouse brain metabolomics dataset, our method overcame the problem of matching uncertainty and could select metabolites and pathways that were easily interpretable. The results pointed out several pathways for better understanding of brain aging. We note that the current study used healthy aging between 16 and 59 weeks, indicating the feasibility of studying brain development based on metabolomics data.
Simulation study
Simulation design
To generate untargeted metabolic data with |$m$| metabolites and |$p$| features, we first generated a scale-free graph between metabolites. We used the Barabási-Albert (BA) model [73], in which a power-law parameter captured the degree distribution of the network. Between features and metabolites, we assumed the true matching was a one-to-one mapping, and the potential matchings for each feature and metabolite were no larger than fifteen. For feature |$x_i$|, we first chose its corresponding true metabolite randomly, denoted as |$v_{\hat{i}}$|. We assumed 50|$\%$| of features have more than one potential matching. We sampled from a Poisson distribution with capped value to determine the exact number of matchings for each feature. Specifically, for feature |$x_i$| with multiple matchings, the possible matched metabolites were randomly chosen from a pool of metabolites within three hops from metabolite |$v_{\hat{i}}$| and possessed less than three matched features so far. After looping through all features, we obtained the true matching matrix |$M_{true}$| and the potential matching matrix |$M_{multi}$|.
To generate the feature abundance matrix with |$n$| samples at the log scale, we used a multivariate normal distribution with a variance–covariance matrix that is dependent on the metabolite network structure. From the metabolic network, we obtained an |$m \times m$| matrix |$D$| recording the shortest distance for all pairs of metabolites. We then determined the covariance matrix of metabolites as |$\Sigma ^{(\text{m})}$|, where
The covariance between features was inherited from their true-matching metabolites using the covariance matrix as
Then a multivariate Gaussian distribution with covariance |$\Sigma ^{(v)}$| was used to generate the feature abundance matrix |$\mathbf{X} = [x_1,..., x_n]^T\in \mathcal{R}^{n \times p}$|.
To simulate the outcome |$\mathbf{y}$| with two classes, we first selected a subset of metabolites as true predictors. With the assumption that only a small portion of metabolites that tend to gather in cliques in the metabolic network are associated with the outcome, we first chose one hub node (degree in the top 1%) randomly as the core metabolite, and then expanded outward by randomly including 50% of its neighboring vertices. This procedure was repeated iteratively until the number of true predictors reached a preset amount. We denoted the true metabolite predictors using a binary vector |$T = [t_1, t_2,...,t_m]^T$|, where |$t_j=1$| indicated metabolite |$v_j$| was the true predictor. Otherwise, the value was set to zero. The true predictive features were found by |$S = M_{true}T \in \mathcal{R}^{p}$|.
To simulate the output class labels |$\mathbf{y} \in \mathcal{R}^{n}$|, we first sampled coefficient parameter |$\beta = (\beta _1, \beta _2,...,\beta _{p})^T$| from a uniform distribution ranging in [0.7, 0.9], and randomly set some of them negative. The output |$\mathbf{y}$| was generated using a generalized linear model as
where |$\odot $| was the element-wise product, |$S \odot x_i$| effectively set non-contributing features to zero and |$\sigma $| was a logistic link function, i.e.
Following the above procedure, we generated a series of experiments with different settings. For all experiments, we set the number of features at 1000 and the ratio of true metabolite predictors at 10% or 20%. In our simulation study, we used different numbers of metabolites and sample size, i.e. 1000, 2000 for metabolites and 2000, 4000, 6000 and 8000 for the sample size. Also, we tested different parameter settings of the Poisson distribution, including |$\lambda =$| 5, 10 and 15, which decided the number of multiple matchings. In all the experiments, we used our proposed graph-embedded sparse neuron network to infer true matching and find out potentially important metabolites and features.
For each simulation setting, 10 experiments were conducted. Each dataset was divided into a training set and a testing set with a ratio of 7:3. The model was trained on the training data and predicted on the testing data. The computation time of each experiment with 100 epochs and batch size equaled 8 was around 40 s on a Linux workstation with a single 5950x CPU, 128 Gb RAM and a GTX 3060 GPU. The true predictors which generated the output |$\mathbf{y}$| were accessible. We evaluated the accuracy of the estimated importance for metabolites and features using the the area under the PR-AUC curve, which was suitable when the proportion of true predictors was small. In addition, the accuracy rate of test data class label prediction, as well as feature-metabolite matching prediction were calculated.
Selection and prediction accuracy
The simulation results are summarized in Figure 5. In each row, the first three plots are the results with the ratio of true predictors equal to 0.10, and the last three plots correspond to the case of true predictor ratio equal to 0.2. Different sub-plots present cases with various Poisson parameters, as noted on top of each sub-plot. Figure 5a and b shows the PR-AUC of metabolite and feature selection under different settings. The PR area under curve (PR-AUC) provides a comprehensive evaluation of a classification model’s performance by measuring its ability to balance precision and recall in identifying positive instances while avoiding false positives. In our study, when the ratio of true metabolic predictors is 10%, and the metabolite size is 1000, the metabolite PR-AUC ranges from 0.2 to 0.4, and the feature PR-AUC ranges from 0.2 to 0.35. Similarly, with a 20% ratio and a metabolite size of 1000, the metabolite PR-AUC ranges from 0.4 to 0.5 and the feature PR-AUC ranges from 0.35 to 0.5. Increasing the number of metabolites to 2000 yields metabolite PR-AUC between 0.1 and 0.2, and feature PR-AUC between 0.17 and 0.3 for a 10% ratio, while a 20% effective ratio results in metabolite PR-AUC between 0.2 and 0.3, and feature PR-AUC between 0.35 and 0.45. In our settings with a significant imbalance among effective and ineffective features, it is challenging for the metric to attain its upper bound of one. To provide a reference point, under purely random conditions, for a fixed number of positive features at 100, the expected PR-AUC values are 0.1 and 0.05 for a total of 1000 and 2000 features, respectively. Similarly, when the number of positive features is fixed at 200, the mean PR-AUC values equal 0.2 and 0.1 for a total of 1000 and 2000 features, respectively. An increase in the size of metabolic network, while holding the number of features constant, leads to worse performance, which is expected as there are more noise metabolites, and the true signal distributed to each true metabolite is lower.
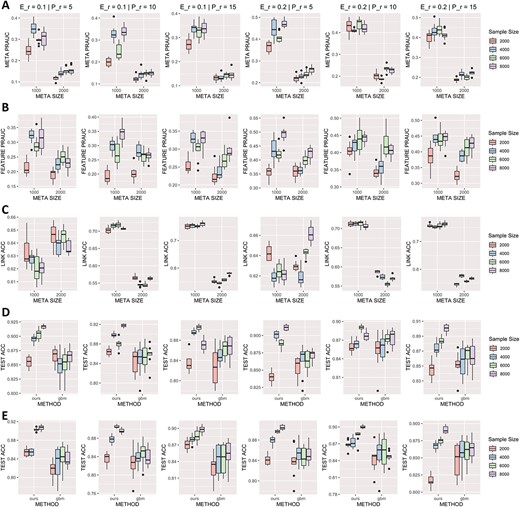
Simulation results with different parameters, including the size of metabolites, sample size, parameters for effective ratio, and multiple matchings. Each column corresponds to the result of various parameters, with ’E_r’ representing the ratio of effective metabolites and ’P_r’ standing for the parameter of Poisson distribution determining the scale of multiple matching between features and metabolites. (A) PR-AUC of precision-recall for metabolic selection. (B) PR-AUC of precision-recall for feature selection. (C) Accuracy of predicting true linkage between features and metabolites. (D) Classification accuracy on testing dataset with metabolite size equals 1000 using our method and GBM. (E) Classification accuracy on testing dataset with metabolite size equals 2000 using our method and GBM.
Figure 5c presents the accuracy of feature-metabolite matches identified by the method. Accuracy of identifying true matchings between metabolites and features ranged between 0.61 and 0.75 across different settings with varying Poisson parameter (P_r). Interestingly, when P_r is small, we observed a reverse trend between the two sizes of the metabolic network. When the Poisson parameter was higher, more potential matches between features and metabolites were established. With a larger metabolic network (2000 metabolites), potential links for each metabolite were smaller, making the feature-metabolite link selection slightly easier compared to the situation where 1000 metabolites were present. Overall, identifying true matches, as well as identifying true contributing metabolites under the multiple matching situation is a challenging task. There is still large room for further improvements.
We then focused on prediction capability of the model. We compared our method with the gradient-boosting machine (GBM), a leading machine learning approach that does not consider feature-metabolite matching and directly uses features in prediction. Figure 5d and e displays the classification accuracy on the testing set with 1000 and 2000 metabolites, respectively. The test accuracy using our method in most experiments ranged from 0.80 to 0.90, indicating the learnability and classification capability of our predictive model. Our method outperformed GBM regarding test accuracy in most cases, suggesting its superior classification ability. Overall, the simulation results showed our method can achieve good classification performance, while addressing the matching uncertainty problem.
Reproducibility of feature selection
Concerning the robustness in reproducibility of feature selection, we were curious about whether the selected metabolites were stable across different repeats of model training. To explore this property, we simulated a dataset with 4000 samples, 1000 features and 1000 metabolites with 100 true metabolites determining the classes |$\mathbf{y}$| by a logistic link function. The Poisson rate used in the experiment was 1, and other parameters were consistent with previous simulation experiments. We repeated the training ten times and recorded the top 100 metabolites each time. Among the 10 sets of the top 100 most important metabolites, 62 metabolites appeared more than seven times, with 40 of them being true predictive metabolites. The number of metabolites selected more than five times was 104, and 64 were true predictive metabolites. The results reflected good reproducibility between different runs of the method.
Ablation study
To verify the effectiveness of our designed graph embedding in the hidden layers, we conducted several experiments using a metabolic network with randomly shuffled edges. We set the metabolite size to 1000, and all other parameters remained consistent with our previous simulation study.
We randomly shuffled the metabolic network by edge swapping, which keeps the degree distribution of the graph unchanged. As shown in Figure 6d, the test accuracy remained similar, while the feature and metabolite selection performance deteriorated substantially when the metabolic network was randomly shuffled (Figure 6a and b). As expected, the model was unable to estimate the true matching between features and metabolites when the metabolic network was randomly shuffled (Figure 6c).
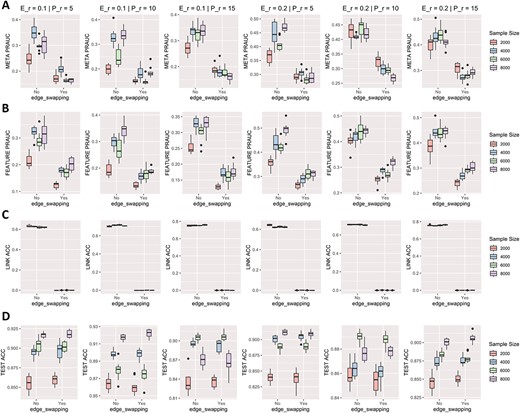
Ablation study to identify the effect of graph embedding on simulation dataset. Each column corresponds to the result of various parameters, with ’E_r’ representing the ratio of effective metabolites and ’P_r’ standing for the parameter of Poisson distribution determining the scale of multiple matching between features and metabolites. (A) PR-AUC of precision-recall for metabolic selection. (B) PR-AUC of precision-recall for feature selection. (C) Accuracy of predicting true linkage between features and metabolites. (D) Classification accuracy on testing dataset.
By comparing with uninformative graph, we showed our designed graph embedding in the hidden layers effectively captures the underlying structure of the metabolic network, resulting in improved feature selection performance. Our results demonstrate the importance of graph embedding in accurately characterizing metabolic networks.
We further investigated the effect of having different structural settings involving the graph embedding layer. The results are summarized in Supplementary material.
Tool and implementation
To facilitate the adoption of our approach, we have developed a Python package named ’meta_matching_tool,’ which can be downloaded from GitHub and installed locally. A comprehensive tutorial on ’meta_matching_tool’ is also available on our GitHub repository https://github.com/tianlq-prog/SPARSENN.
The package comprises two main components: data preprocessing and model training. The model’s input include observed feature abundance matrix, clinical label of each sample, feature-to-metabolite matching matrix (optional) and metabolic network (optional). The outputs comprise prediction accuracy on the testing set, the feature and metabolite importance, and the inferred feature-to-metabolite matching.
For the two optional inputs, we provide matching to the KEGG metabolites and the KEGG metabolic network. However, we note that data preprocessing is crucial for raw untargeted metabolic data. Although users can use the functions in our Python package to execute the annotation procedure, as well as utilize the built-in KEGG network, as different data may necessitate diverse preprocessing processes, we recommend that users tailor the preprocessing to fit their data better.
CONCLUSION
In this study, we presented a unified framework for analyzing untargeted LC/MS metabolic data, which can simultaneously deal with the matching uncertainty problem and conduct feature/metabolite selection. The model embedded the feature-metabolite matching relationship and metabolic network in hidden layers of a sparsified neural network. The method exhibited very good performance in identifying true predictive metabolites and establishing correct metabolite-feature matching. Two real-world applications of our model have yielded biologically relevant selected metabolites and metabolic sub-networks, underscoring the practical value of our approach.
It is important to note that our framework relies on the availability of a known metabolic network, and its interpretability is confined to the scope of the provided metabolic network. Nevertheless, our study is a pioneering attempt, as we are the first to successfully integrate a solution to the matching uncertainty issue and feature/metabolite selection into metabolic network analysis and predictive modeling. By doing so, our framework offers a unified and comprehensive approach to the analysis of untargeted metabolomics data. In addition to the methodological advancements, we have developed a user-friendly Python package called ’meta_matching_tool,’ designed to streamline data preprocessing and model training.
Nonetheless, we acknowledge certain limitations within the current version of our tool. Firstly, the available reference sources during data preprocessing are currently restricted to the KEGG database and KEGG metabolic network. While they provide a solid foundation, other databases covering a broader range of metabolic pathways may be more suitable in specific cases.
Secondly, our model may need careful tuning when handling studies with limited sample size. As the model relies on neural networks, sample size and initial randomization can influence the final performance. Therefore, tailored training techniques based on the specific characteristics of the data might be necessary.
Thirdly, resolving matching uncertainty is intrinsically a hard problem. Addressing it in the computational model only takes into account part of the information that’s potentially available. In addition, the problem is high-dimensional, and the sample size, even in thousands as in simulations, is still very limited. Matching uncertainty is hard to be addressed by modeling the feature behaviors in prediction alone, as in our current approach. Our framework does not yet support the analysis of partially annotated datasets. Combining the current approach with other feature characteristics, as well as partial annotation could improve the performance, as well as provide more comprehensive evaluation to the results. Future work involves extending the framework to encompass partially annotated datasets and incorporating data-dependent acquisition and DIA data.
The first such method in the field, we developed a novel approach to simultaneously conduct prediction, metabolite selection and estimate LC/MS feature – metabolite matching confidence.
The new method integrated the metabolic network to select important sub-networks and achieve high interpretability.
The new method selected informative sub-networks from two real datasets, demonstrating its value for the analysis of untargeted metabolomics data.
ACKNOWLEDGEMENTS
We sincerely thank three anonymous reviewers for their valuable feedback that helped significantly improve the manuscript’s quality.
FUNDING
This work was partially supported by the National Key R&D Program of China (2022ZD0116004), Guangdong Talent Program (2021CX02Y145) and Shenzhen Research Institute of Big Data.
DATA AVAILABILITY
The data analyzed in this study originated from public data. The longitudinal metabolomics of COVID-19 disease severity data is downloaded from metabolomics workbench (https://www.metabolomicsworkbench.org/data/DRCCMetadata.php?Mode=Study&StudyID=ST001849). The metabolome alters of the aging mouse brain is also obtained from metabolomics workbench (https://www.metabolomicsworkbench.org/data/DRCCMetadata.php?Mode=Study&StudyID=ST001888). The code to implement the framework is available on Github (https://github.com/tianlq-prog/SPARSENN).
Author Biographies
Leqi Tian is a PhD student at the School of Data Science, The Chinese University of Hong Kong—Shenzhen and Shenzhen Research Institute of Big Data. Her research interests include the analysis of metabolomics data and applied statistics.
Tianwei Yu is a professor at the School of Data Science, The Chinese University of Hong Kong, Shenzhen Research Institute of Big Data, Guangdong Provincial Key Laboratory of Big Data Computing. His main research interest is focused on algorithms in bioinformatics, applied statistics, and applied machine learning.
REFERENCES
