


Abstract
Complex computation and approximate solution hinder the application of generalized linear mixed models (GLMM) into genome-wide association studies. We extended GRAMMAR to handle binary diseases by considering genomic breeding values (GBVs) estimated in advance as a known predictor in genomic logit regression, and then reduced polygenic effects by regulating downward genomic heritability to control false negative errors produced in the association tests. Using simulations and case analyses, we showed in optimizing GRAMMAR, polygenic effects and genomic controls could be evaluated using the fewer sampling markers, which extremely simplified GLMM-based association analysis in large-scale data. Further, joint association analysis for quantitative trait nucleotide (QTN) candidates chosen by multiple testing offered significant improved statistical power to detect QTNs over existing methods.
Introduction
Although usually expressed as binary phenotypes, many disease traits in plants and animals are thought to be controlled by a number of loci each having a small effect [1, 2]. Thus, random polygenic effects excluding the tested markers should be considered in genome-wide association study (GWAS) for disease traits to correct the population stratification and cryptic relatedness, as linear mixed model (LMM) does for quantitative traits [3, 4]. Logistic regression, as a kind of generalized linear model (GLM) [5, 6], has been used earlier for genome-wide association analysis with the disease traits [7]. Despite correction for fixed-effect covariates [8–10], logistic regression still produces inflation of association test statistics. Therefore, it is necessary to introduce a generalized linear mixed model (GLMM) [11] that considers random polygenic effects to increase the power to map quantitative trait nucleotides (QTNs) for disease traits.
However, genome-wide GLMM association consumes much more computing time than mixed model association with either restricted maximum likelihood estimation (REML) [12] or Markov Chain Monte Carlo (MCMC) iteration [13]. If using the maximum likelihood in estimation and approximations to avoid numerical integration [14], the GLMM yields a problem of serious bias induced by the approximations [15], especially solutions tending toward the positive/negative infinity. In the GWAS for case–control studies, a non-random sampling of cases from the population results in biased estimation for genomic heritability. Analyzed by the LMM for binary phenotypes, genomic heritability estimate is transformed to a liability scale by adjusting both for scale and for ascertainment of the case samples [16]. The genomic heritability of liability is estimated in a biased manner for disease traits, even though it is done by GLMM via MCMC iteration. Based on the calibrated genomic hereditability for case–control ascertainment, a Chi-squared score statistic for GWAS of disease traits is computed from posterior mean liabilities (PMLs) under the liability-threshold model [17]. The individual PMLs are estimated with a multivariate Gibbs sampler, which increases the computational demand. For simplification to GLMM-based association analysis, the GMMAT [18] and SAIGE [19] separately extend the EMMAX [20] and BOLT-LMM [21], respectively, for normally distributed traits to binary phenotypes.
Owing to the computational intensity and approximate solutions obtained, GLMM can hardly be employed in GWAS for disease traits. Moreover, genomic heritability cannot be accurately estimated for complex diseases, especially in ascertained case–control studies. For simplification to genome-wide mixed model association analysis for quantitative traits normally distributed, GRAMMAR [22] replaced polygenic effects excluding the tested marker with the genomic breeding values (GBVs) estimated under null mixed model, and then associated phenotype residuals removing GBVs with genetic markers by least square method in the lowest computational complexity. However, removing partial marker effects from phenotype residuals made GRAMMAR deflating association test statistics and decreasing statistical power to detect QTNs. In this study, we extended GRAMMAR to handle binary traits by considering GBVs estimated in advance as a known predictor in genomic logit regression. Further, we optimized the genomic control for GRAMMAR for binary traits by regulating the downward genomic heritability to estimate the residual phenotypes. The complicated GLMM does not need to be directly solved by the Optim-GRAMMAR for binary traits, and it only repeatedly estimates GBVs with genomic best linear unbiased prediction (GBLUP) [23] for GLMM, achieving genome-wide GLMM association analysis rapidly. Finally, we jointly analyzed the QTN candidates chosen by multiple testing to improve the statistical power to detect QTNs.
Methods
Genomic logit regression
GRAMMAR for binary diseases
Optimization of genomic control
In GRAMMAR for binary traits, replacement of polygenic effects excluding QTNs with GBVs deflates the test association statistics, which yields a high false-negative rate. By regulating the downward genomic heritability, we can more accurately estimate the polygenic effects with the GBLUP Equation (4). The polygenic heritability less than genomic heritability is determined by optimizing genomic control for association tests. Such an optimization for GRAMMAR can be summarized in the following steps:
(1) set the searching open interval of h2 to (0, 1);
(2) estimate the GBVs |$\hat{\mathbf{g}}$| using Equation (4);
(3) statistically infer the genetic effect for each SNP by the chi-squared statistic (7);
(4) calculate the genome-wide chi-squared mean or statistical probability for each SNP;
(5) plot the quantile-quantile (Q-Q) profile for genome-wide statistical probabilities;
(6) update h2 with Brent’s method [25];
(7) repeat step (2)–(6) until the genome-wide chi-squared mean reaches 1.0 plus or yields a satisfactory Q-Q plot, as proposed in [26].
Joint association analysis
Given the Bonferroni corrected significance level, non-significant QTN effects would be eliminated stepwisely from the model (8) according to the corrected statistic (7).
Optimizing genomic control in mixed model associations with binary diseases was written in C language on R platform. A user-friendly Optim-GRAMMAR software with the options of a test at once and joint association analysis was developed, which is freely available at https://github.com/RunKingProgram/Optim-GRAMMAR.
Simulations
Two genomic datasets of human [28] and maize [11] samples were used to simulate the adaptability of GRAMMAR for binary traits to population structure. The maize population has a more complex structure than the human population. Then, 300 000 SNPs for both 12 000 people and 2640 maize were extracted through higher quality control. In whole simulations, control and case samples were constrained to 1:1 for the maize population, and 3000 cases were selected from the human population with low incidence rate of 5% simulated in advance. QTNs were distributed randomly over the entire SNPs, whose additive effects were sampled from a gamma distribution with shape = 1.66 and scale = 0.4. Given the genomic heritability of liability, phenotypes of control (0) and case (1) can be generated from the genomic logit model (1).
In addition to population structure, the number of QTNs, genome heritability and sampling number of SNPs were considered as experimental factors in the simulations. Under the optimized genomic control infinitely close to 1.0, the ROC profiles can be plotted by statistical powers to detect the QTNs relative to a given series of Type I errors. Statistical powers are defined as the percentage of identified QTNs that have the maximum test statistic among their 20 closest neighbors over the total number of simulated QTNs. Simulations were repeated 50 times, and in each simulation, the positions and effects of QTNs simulated were varied and the average results were recorded.
Results
Statistical properties of Optim-GRAMMAR for binary traits
Based on the two genomic datasets, we simulated phenotypes controlled by 40, 200 and 1000 QTNs at the low (0.2), moderate (0.5) and high (0.8) genomic heritability, respectively. The statistical properties of Optim-GRAMMAR using a test at once for binary traits were investigated by comparing it with GRAMMAR, GMMAT, LTMLM and SAIGE. The Q-Q and ROC profiles are displayed selectively in Figures 1 and 2, respectively, and in Supplementary Figures 1S and 2S, respectively, in detail. The genomic controls are estimated in Supplementary Table 1S. Making genomic control infinitely close to 1.0, Optim-GRAMMAR achieved almost the same statistical power to detect QTNs as the GMMAT, which approximates the exact GLMM, irrespective of how many QTNs and heritabilities are simulated. Among Optim-GRAMMAR and the four competing methods, GRAMMAR had the lowest genomic controls and statistical power, and for GRAMMAR, the population structure was more complex and the false negative rate was larger. Although LTMLM achieved the highest statistical power to detect QTNs for all simulated phenotypes for the maize dataset, and SAIGE demonstrated a higher statistical power for the dataset controlled by 1000 QTNs at the genomic heritability of 0.2. A strong false positive error rate was observed for SAIGE. In the human dataset, there were no distinct differences in the statistical properties between GRAMMAR-lambda and the four competing methods, although GRAMMAR provided some false negative errors.
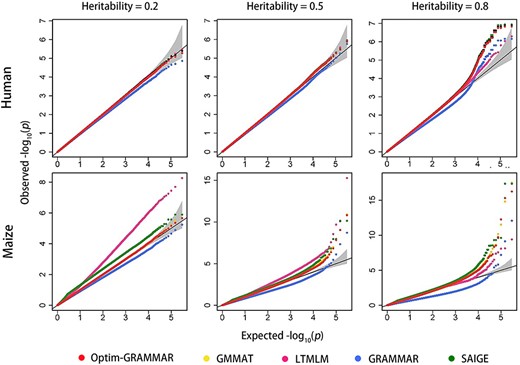
Comparison in the Q-Q profiles between Optim-GRAMMAR and the four competing methods. The simulated phenotypes are controlled by 200 QTNs with the low, moderate and high heritabilities in human and maize. The Q-Q profiles for all simulated phenotypes are reported in Supplementary Figure 1S.
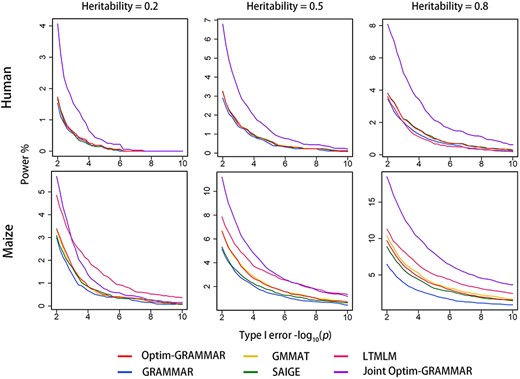
Comparison in the ROC profiles between Optim-GRAMMAR and the four competing methods. The ROC profiles are plotted using the statistical powers to detect QTNs relative to the given series of Type I errors. Here, the simulated phenotypes are controlled by 200 QTNs with the low, moderate and high heritabilities in human and maize. The ROC profiles for all simulated phenotypes are reported in Supplementary Figure 2S.
After optimization for genomic control, Optim-GRAMMAR jointly analyzed multiple QTN candidates chosen from a test at once at a significance level of 0.05. For convenience for comparison, we analyzed the statistical powers obtained with one test at a time and joint analyses together. By backward regression analysis, Optim-GRAMMAR evidently exhibited improved statistical power. In contrast, LTMLM was inferior to joint analysis of Optim-GRAMMAR in the terms of statistical power, even with the highest false positive rates.
Calculation of GRMs and GCs with the sampling markers
To investigate the effects of sampling markers on Optim-GRAMMAR, we randomly drawn 3 K, 5 K, 10 K, 20 K and 25 K SNPs from the entire genomic markers to calculate GRM. Changes in the genomic control at the varied sampling levels of SNPs are depicted in Figure 3 for Optim-GRAMMAR, GRAMMAR, GMMAT and SAIGE. Because LTMLM cannot sample SNPs, it was not included in the comparison. No competing method stably controlled the positive/negative false errors using less than 25 K sampling SNPs, besides SAIGE for human phenotypes. Specifically, GMMAT gradually controlled the positive false errors as the sampling markers increased; GRAMMAR controlled the negative false rate by sampling less markers, while SAIGE produced serious false negative errors in the complex maize population. In comparison, Optim-GRAMMAR still retained a high statistical power to detect QTNs through almost perfect genomic control, even using less than 3000 sampling markers (see Supplementary Figure 3S and Figure 4). In optimizing genomic control (GC), additionally, to avoid genome-wide scan, we also evaluated the GC each round by sampling 10 K, 30 K, 50 K and 100 K SNPs randomly. It was concluded that at those optimal GCs calculated from sampling markers, genome-wide GCs were all closed to or slightly above 1.0 and corresponding Q-Q profiles did not change (results not shown).
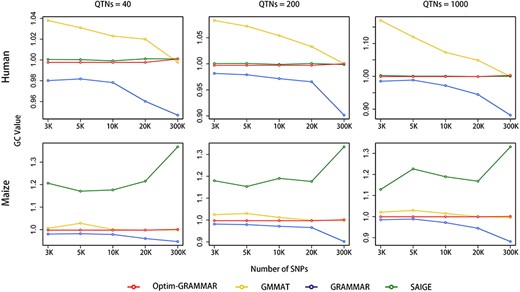
Changes in genomic controls with the number of sampling SNPs for Optim-GRAMMAR and the three competing methods. Genomic control is calculated by averaging genome-wide test statistics. The simulated phenotypes are controlled by 40, 200 and 1000 QTNs with the moderate heritability in human and maize.
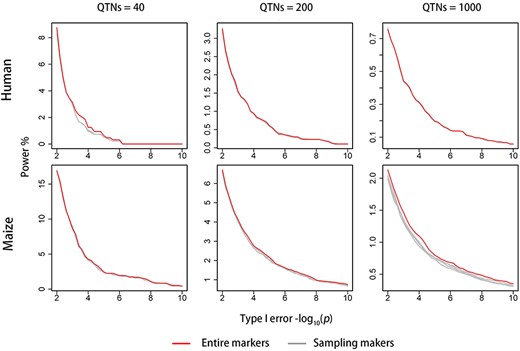
Changes in ROC profiles with the number of sampling SNPs for Optim-GRAMMAR. The simulated phenotypes are controlled by 40, 200, 1000 QTNs with the moderate heritability in human and maize.
Application of Optim-GRAMMAR to WTCCC study
We were authorized to re-analyze the Wellcome trust case–control consortium (WTCCC) study 1 [29]. There were the 11 985 cases from six common diseases and 3004 shared controls, genotyped at a total of 490 032 SNPs. For each dataset, a standard quality control (QC) procedure was performed: SNPs with MAFs <0.01 and HWE > 0.05 were excluded, and individuals with missing rates >0.01 were also excluded. After the QC process, the number of samples and SNPs used for generalized mixed model association analyses were 5002 individuals (1998 cases and 3004 controls) and 409 642 SNPs for bipolar disorder (BD), 4992 individuals (1988 cases and 3004 controls) and 409 516 SNPs for coronary artery disease (CAD), 5003 individuals (1999 cases and 3004 controls) and 409,924 SNPs for rheumatoid arthritis (RA), 5005 individuals (2001 cases and 3004 controls) and 409 742 SNPs for hypertension (HT), 5004 individuals (2000 cases and 3004 controls) and 40 9674 SNPs for type I diabetes (T1D), and 5003 individuals (1999 cases and 3004 controls) and 409 805 SNPs for type II diabetes (T2D). All data analyses were performed in a CentOS Linux sever with 2.60 GHz Intel(R) Xeon(R) 40 CPUs E5–2660 v3 and 512 GB memory.
For the six common diseases, we implemented Optim-GRAMMAR using entire genomic markers and 5000 sampling SNPs, respectively, to estimate the GRM. The Q-Q and Manhattan profiles for the six common diseases are depicted in Supplementary Figures 4S and 5S obtained with the Optim-GRAMMAR using a test at once and the four competing methods used in simulations, while in Supplementary Figure 5S with the Optim-GRAMMAR using joint association analyses. The association analyses illustrated that (1) under perfect genomic control, Optim-GRAMMAR found the QTNs for each disease on each chromosome, and detected slightly more the QTNs than all the competing methods, except for GMMAT, of the detected QTNs, most were overlapped among the competing models; and (2) in Optim-GRAMMAR, joint association analyses detected more QTNs than a test at once, and several new genes were found to be associated with the analyzed diseases by gene annotation. As compared to Optim-GRAMMAR, GRAMMAR detected less QTNs with the lowest genomic control among all the methods, while GMMAT yielded more SNPs whose -log(p) exceeded the Bonferroni corrected thresholds for CAD, T1D, T2D and HT, but it produced the highest false positive errors (genomic controls). Additionally, LTMLM estimated the abnormal genomic heritabilities for CAD, BD, T2D and HT, with unstable genomic controls.
Further, we conducted strict QC for each dataset, as done in [16] for estimating genomic heritability. Despite this, the missing heritabilities could not be normally estimated for BD and HT. As shown in Supplementary Figures 6S and 7S, all methods exhibited clear and comparable association results, except for GRAMMAR. Interestingly, both LTMLM and GMMAT seriously underestimated the genomic heritability for each disease after strict QC. In summary, Optim-GRAMMAR could efficiently and robustly map QTNs for binary diseases and did not depend on estimation of genomic heritability and QC for genomic datasets.
Computational costs (time complexities) were summarized in Table 1 for the five competing association methods. Theoretically, Optim-GRAMMAR and SEIGE had distinct advantage over other GLMM-based association methods in computational complexity. For each dataset with standard QC, we recorded the running times from input of genotypes and phenotype to output of mapping QTNs for all the methods. Table 2 shows that Optim-GRAMMAR reduced the computing time by dozens of times with the lowest memory footprint.
Computational costs of the five competing association methods
| Method | Calculating GRM | Estimating heritability | Estimating GBVs | Association test |
|---|---|---|---|---|
| GMMAT | O(mn2) | O(in3) | O(m2n) | |
| LTMLM | O(mn2) | O(in3) | O(smn) | O(m2n) |
| SAIGE | O(il2n) | O(iln) | O(imn) | |
| GRAMMAR | O(mn2) | O(in3) | O(mn) | O(imn) |
| Optim-GRAMMAR | O(k2n) | O(ikn) | O(imn) |
k and l are numbers of sampling markers for Optim-GRAMMAR and SAIGE, respectively; s and i are rounds of Bayesian sampling for LTMLM and iterative solving for GLM or GLMM.
Computing time/memory footprint (Min/Gb) of the four competing methods for the six diseases
| Disease | LTMLM | SAIGE | GMMAT | Optim-GRAMMARa | Optim-GRAMMARb |
|---|---|---|---|---|---|
| CAD | 26.14/33.1 | 15.60/1.2 | 6.78/2.1 | 2.47/0.4 | 0.91/0.6 |
| RA | 27.46/33.1 | 15.19/1.2 | 6.82/2.1 | 2.56/0.4 | 0.96/0.6 |
| T1D | 27.31/33.1 | 14.16/1.2 | 6.78/2.1 | 2.38/0.4 | 0.93/0.6 |
| T2D | 25.83/33.1 | 15.22/1.2 | 6.54/2.1 | 2.41/0.4 | 0.94/0.6 |
| HT | 28.61/33.1 | 14.67/1.2 | 6.57/2.1 | 3.02/0.4 | 0.89/0.6 |
| BD | 26.88/33.1 | 14.85/1.2 | 6.74/2.1 | 2.04/0.4 | 0.91/0.6 |
aRepresents using entire markers; bSampling markers for Optim-GRAMMAR. All computations were performed on a computing platform with a 3.20 GHz Intel(R) Core(R) 6-core CPU i7 8700 and 64 GB memory.
Discussion
Development of the GRAMMAR for GLMM association was an essential prerequisite for extending the Optim-GRAMMAR to rapidly optimize mixed model association analysis for binary traits. For genomic GLMM, however, no binary residuals could be produced because of the scale difference between binary phenotype and predictors. Thus, we considered the GBVs estimated in advance as a known predictor in genomic logit regression and then executed association tests for candidate markers. This ensured that GRAMMAR had the lowest computing complexity for association tests for binary traits among the existing GLMM-based association methods [17–19]. Because GRAMMAR for binary diseases produces high false negative rates for quantitative traits distributed normally, we optimized the genomic control for GRAMMAR by regulating downward genomic heritability to underestimate the GBVs with GBLUP equations for GLMM. Thus, Optim-GRAMMAR solved the GBLUP equations and performed association tests with simple logit regression only for several iterations, thus improving the computational efficiency for genome-wide GLMM association analysis.
Several GLMM-based association methods such LTMLM, GMMAT and SAIGE have simplified genome-wide mixed model association analysis for binary traits to a certain extent, but they are more appropriate to handle the less complex populations such as human datasets [18, 19]. Moreover, the heritability for binary diseases could not be robustly and precisely estimated using genomic markers [14–16], which also limited the efficient application of these association methods. In contrast, because Optim-GRAMMAR does not need to directly estimate genomic heritability, it can powerfully and robustly map QTNs for binary traits in complexly structured populations. Within the framework of Optim-GRAMMAR, further, joint analysis for the candidate quantitative trait nucleotides chosen by multiple testing significantly improved statistical power to detect QTNs with almost perfect genomic control.
Data availability
The datasets can be available at https://www.panzea.org/%21#genotypes/cctl for maize, and http://www.wtccc.org.uk/ with the authorization for human genomic data.
GRAMMAR is extended to handle binary diseases by considering genomic breeding values as a known predictor in logit regression.
The Optim-GRAMMAR can effectively correct confounders with polygenic effects in association tests, controlling false negative errors.
Within the framework of Optim-GRAMMAR, joint association analysis greatly improves statistical power to detect QTNs.
The Optim-GRAMMAR can handle large-scale data by using sampling markers to evaluate polygenic effects and genomic controls.
Funding
National Key R&D Program of China (2018YFD0900201); National Natural Science Foundations of China (32072726); Special Scientific Research Funds for Central Non-profit Institutes, Chinese Academy of Fishery Sciences (2019ZY09).
Yuxin Song is currently a PhD student at Wuxi Fisheries College, Nanjing Agricultural University.
Li'ang Yang is a teaching assistant at College of Life Science, Northeast Agricultural University. Her research focuses on animal breeding and genetics.
Li Jiang is an associate professor at Research Centre for Aquatic biotechnology, Chinese Academy of Fishery Sciences. He is interested in breeding and genetics in aquaculture.
Zhiyu Hao is a research assistant at Institute of Animal Husbandry, Heilongjiang Academy of Agricultural Sciences. His research focuses on genome-wide association study.
Runqing Yang is a professor at Research Centre for Aquatic biotechnology, Chinese Academy of Fishery Sciences. He is interested in developing statistical methodology of genome-wide association study.
Pao Xu is a professor at Wuxi Fisheries College, Nanjing Agricultural University. His research focuses on breeding and genetics in aquaculture.
References
Author notes
Yuxin Song and Li’ang Yang authors have contributed equally to this study.
