


Abstract
DNA replication is a fundamental process in all organisms; this event initiates at sites termed origins of replication. The characteristics of eukaryotic replication origins are best understood in Saccharomyces cerevisiae. For this species, origin prediction algorithms or web servers have been developed based on the sequence features of autonomously replicating sequences (ARSs). However, their performances are far from satisfactory. By utilizing the Z-curve methodology, we present a novel pipeline, Ori-Finder 3, for the computational prediction of replication origins in S. cerevisiae at the genome-wide level based solely on DNA sequences. The ARS exhibiting both an AT-rich stretch and ARS consensus sequence element can be predicted at the single-nucleotide level. For the identified ARSs in the S. cerevisiae reference genome, 83 and 60% of the top 100 and top 300 predictions matched the known ARS records, respectively. Based on Ori-Finder 3, we subsequently built a database of the predicted ARSs identified in more than a hundred S. cerevisiae genomes. Consequently, we developed a user-friendly web server including the ARS prediction pipeline and the predicted ARSs database, which can be freely accessed at http://tubic.tju.edu.cn/Ori-Finder3.
Introduction
The highly accurate and complete replication of genetic materials is essential for all life. The specific sites where the DNA starts unwinding and the replication initiates are called origins of replication (ORIs) [1]. Compared to bacterial DNA replication, eukaryotic DNA replication involves more complex replication mechanisms and more flexible options for ORI activation. Eukaryotic DNA replication is regulated to ensure that all chromosomes replicate only once per cell cycle throughout the S phase [2]. Saccharomyces cerevisiae has unparalleled value in the study of molecular mechanisms of eukaryotic DNA replication and the characteristics of eukaryotic ORIs are best understood in this species. Autonomously replicating sequences (ARSs) are modular in structure and function as chromosomal replication origins in the S. cerevisiae genomes. ARS generally contains an 11 bp ARS consensus sequence (ACS) [3], where the origin recognition complex (ORC), a six-subunit DNA-dependent ATPase, specifically recognizes and binds [4,5]; the specific recognition of T bases in the ACS element is performed by a basic patch of Orc1, the largest subunit of ORC, which is conserved across species from yeast to humans [5,6]; any mutation in the ACS could abolish the ARS function [7,8]. DNA unwinding element (DUE) is an AT-rich element and serves as the site for unwinding the DNA double helix [9], and it is also a common structure of the replication origin sequences in both yeast and mammals [10]. Moreover, a DUE element can be substituted by an unrelated sequence, which will not influence the origin function [11]. Other elements, such as B elements (B1, B2, B3 and B4), are usually located 3′ to the T-rich strand of the ACS, whereas these elements vary from one ARS to another and exhibit low sequence similarity among the ARSs [7]. Nevertheless, all documented ARSs generally possess two common features: an ACS motif responsible for ORC binding and an AT-rich stretch serving as the DNA unwinding site. Based on the features of ARSs, some algorithms and web servers for ARS prediction have been developed. Breier et al. adopted both the 17 bp ACS motif and the AT-rich region flanking it to predict ARSs in the S. cerevisiae genome using an algorithm called Oriscan [12]. Only 26 known yeast origins were chosen to extract sequence features; Breier et al. reported that Oriscan was not sensitive to the change in the prediction boundaries, and greater changes produced either no change or a decrease in performance, which may limit the discovery of new and various potential ARSs. Two web servers and one software tool for ARS prediction based on machine learning methods have been reported, namely PseKNC2.0 [13], iRO-3wPseKNC [14] and sefOri [15], respectively; they are user-friendly and can rapidly output the prediction. However, PseKNC2.0 could only handle query sequences longer than 300 bp. Based on the SGD database, approximate 74.72% of the annotated ARSs are shorter than 300 bp, which indicates the prediction limitations of PseKNC2.0. IRO-3wPseKNC is a windowless predictor, and sefOri could deal with uploaded sequences longer than 55 bp. However, when false ARSs were added around the true ARS, the results predicted by these two predictors fluctuated with increase in the length of query sequences, which indicates that the proportion of the true ARS contained in the query sequence could affect the prediction performance. Additionally, none of these web servers and software could achieve sequence segmentation and origin prediction at the genome-wide level, therefore constructing more effective algorithms and bioinformatic tools to accurately and efficiently identify replication origins among DNA fragments or whole genomes has become an urgent need for researchers.
In previous studies, we developed Ori-Finder (http://tubic.tju.edu.cn/Ori-Finder/) and Ori-Finder 2 (http://tubic.tju.edu.cn/Ori-Finder2) for the prediction of replication origins in bacterial genomes and archaeal genomes, respectively [16]. In this study, a novel ARS prediction pipeline called Ori-Finder 3 was built to identify the potential replication origin sequences among the S. cerevisiae genomes based solely on DNA sequence information. The computational prediction resolution of Ori-Finder 3 could be displayed at the single-nucleotide level. Up to now, it is the first bioinformatics tool to achieve the sequence segmentation and replication origin identification not only among the query DNA fragments with various lengths but also in the whole genomes of S. cerevisiae. Here, we adopted the Z-curve theory to convert the DNA sequence to a geometrical curve, as each given sequence could be uniquely reconstructed to a three-dimensional Z-curve [17]. Therefore, the analysis of a DNA sequence could be performed by parsing the corresponding Z-curve. Subsequently, a windowless technique based on the Z-curve theory [17] is proposed to calculate and segment the AT-rich region along the DNA sequence. We first adopted ACS motif scanning and AT-rich sequence segmentation using the windowless technique to identify the candidate ARSs, which mimics the actual biological process. Subsequently, a machine learning method was used for the filtration of the candidate ARSs. Additionally, we built a user-friendly and publicly accessible web server for researchers. Users only need to upload query sequences longer than 50 bp to obtain the potential ARSs among the uploaded sequences. In addition, we executed Ori-Finder 3 for a hundred S. cerevisiae genomes; these predictions were collected for constructing a database, which could provide large-scale data for further sequence feature mining.
Materials and methods
The ARS dataset for yeast reference genome
We retrieved the reference genome sequence and annotation including the records of ARSs, ACSs and intergenic sequences of S. cerevisiae S288C (version: R64–2-1) from the SGD database (http://www.yeastgenome.org) [18]. Additionally, we collected the ARS records from the OriDB (http://cerevisiae.oridb.org) [19] and DeOri databases (version 6.0) (http://tubic.tju.edu.cn/deori) [20]. Additionally, the experimental ARS datasets, for instance, based on 2D gel analysis (http://cerevisiae.oridb.org/data_ucsc.php?main=sc_ori_studies&table=sc_2D_gel&format=BED), plasmid-based assays (http://cerevisiae.oridb.org/data_ucsc.php?main=sc_ori_studies&table=sc_cloned_ori&format=BED) and miniARS-seq analysis [21], were downloaded from the OriDB database or retrieved from the literature.
Z-curve segmentation
Thereafter, the geometrical approaches can be applied to analyze |$z{\prime}_n$| curves. The mosaic structure comprises several alternating AT-rich (GC-poor) and AT-poor (GC-rich) regions, which can be clearly visualized by the |$z{\prime}_n$| curve [17,23]. The |$z{\prime}_n$| curve can be smoothed by the spline function using the sub-package UnivariateSpline of the interpolate module integrated in the SciPy software [24] with the default parameters. Subsequently, the switch points between AT-rich (GC-poor) and AT-poor (GC-rich) regions can be identified by the function find_peaks of the signal module integrated in SciPy with a custom parameter, i.e. minimal horizontal distance between neighboring peaks greater than or equal to 100 bp.
ACS motif identification
We collected the ACS sequences from both the SGD and OriDB databases; subsequently, MEME (version 5.1.0) (http://meme-suite.org/tools/meme) [25], an online computational tool for motif discovery, was applied to identify a shared motif among these collected ACS sequences with the parameter of one occurrence per sequence. Subsequently, the motif module integrated in the Biopython (version 1.74) [26] software was applied to scan the ACS motif among the query DNA sequences or whole genomes of yeast.
Filtering the candidate ARSs by machine learning
Benchmark dataset
A reliable benchmark dataset is essential for building a robust predicting model. In this study, a nonredundant positive dataset comprising the available ARSs of the reference, S. cerevisiae, from the SGD database was supplemented with the confirmed ARSs from OriDB and DeOri. OriDB integrated experimental data from different replication studies; we observed that the annotated origins vary greatly in size due to the difference in experimental resolution. Therefore, the chromosomal coordination of these sequences needs to be considered.
To build the negative dataset, we adopted the program shuffleBed, integrated in the BEDTools software (version 2.25.0), to randomly extract the non-replication origins from intergenic sequences, except for the known ARSs; the length distribution of these non-ARSs was consistent with that of the positive dataset. Subsequently, CD-HIT [27] was applied to remove the redundancy with a sequence identity cutoff of 80%. Additionally, we collected previously published benchmark datasets of replication origin sequences [13,14] for the following comparison.
Z-curve parameters
To extract sequence information, we adopted the Z-curve parameters [28] based on the Z-curve theory [17,22].
The DNA bases are not independently distributed in a sequence. Among the replication origin sequences, the frequencies of certain dinucleotides (e.g. AA, TT, AT or TA) and trinucleotides (e.g. AAA or TTT) are significantly higher than those of other dinucleotides and trinucleotides, respectively (Supplementary Figure 1A and 1B).
Support vector machine
The support vector machine (SVM) method, a powerful classifier, has been widely used in the field of bioinformatics [30,31]. In this study, an efficient machine learning tool in Python, scikit-learn (version 0.22) [32], was applied to implement SVM by the function of C-Support Vector Classification (SVC) on the basis of LIBSVM [33]. The function of RFECV was used for feature ranking with the parameter of ‘cv’ (cross-validation) equal to 10. The Z-curve parameter matrix of the benchmark dataset was randomly split into 10 equally sized groups. Eighty percent groups were used as training datasets, and the remaining groups were used as test datasets for evaluating the performance of the predicting model.
Performance evaluation
Evaluating the performance of the prediction pipeline
To evaluate the prediction performance of the pipeline, we compared the predicted results with multiple ARS databases, including the SGD, OriDB (containing confirmed, likely and dubious ARSs) and DeOri databases, and previously published experimental ARS datasets, including the ARS dataset based on 2D gel analysis, plasmid-based assays and miniARS-seq methods. Additionally, we collected DNA replication-related experiment datasets, consisting of genome-wide ORC chromatin immunoprecipitation (ChIP) signal and minichromosome maintenance (MCM) ChIP signal from tiled microarray [35], and replication time profile of the yeast genome [36]. Here, the online software liftOver (https://genome.ucsc.edu/cgi-bin/hgLiftOver) was applied to convert genome coordinates to unified version.
Results and discussion
According to the ARS annotation from the SGD database, the length of the recorded ARSs range from approximate 50 base pairs to over thousands of base pairs, and most of them share low sequence similarity [29]. However, they all co-own two common elements [37]. One is an ACS element that can be sequence-specific recognized and bounded by a six-subunit ORC [38], and the other element DUE is characterized by an AT-rich stretch and considered to promote the unwinding of the DNA double helix at local sites [39]. Based on the two common features of replication origin sequences (ACS and DUE elements), we built a prediction pipeline for identifying the potential ARSs on either the DNA fragments or the whole genome sequences of S. cerevisiae.
The overview of prediction pipeline
The ARS prediction pipeline consists of three major parts (Figure 1A). (1) The DNA sequences need to be inputted into Ori-Finder 3; the query sequence needs to be longer than 50. (2) The AT-rich sequence segmentations containing ACS elements are extracted as candidate ARSs. Subsequently, these candidate ARSs are filtered by the SVM prediction model. (3) The predicted ARSs are presented and visualized in the output tables and figures.
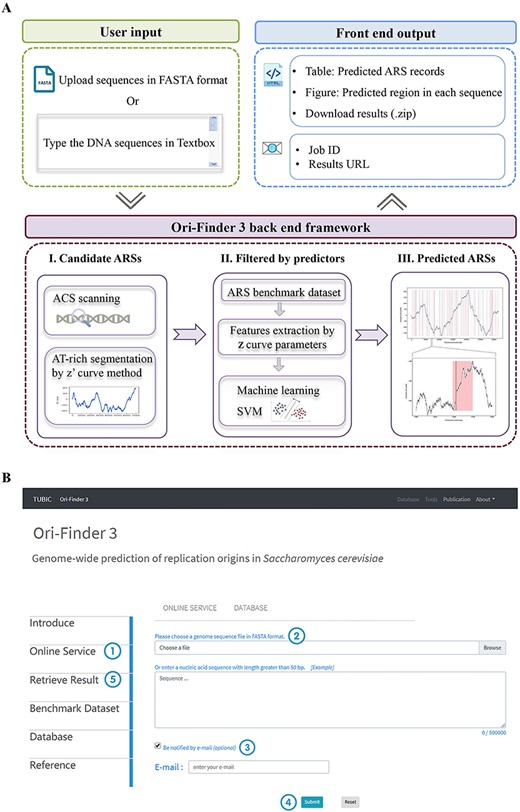
Outline of Ori-Finder 3 and the screen shot of the web server for identifying potential replication origins in DNA fragments or whole genomes of S. cerevisiae. (A) The workflow of Ori-Finder 3. (B) The screen shot of the online service page of Ori-Finder 3.
Identification of candidate ARSs
According to the ARS annotation from SGD, we extracted the local z|$^{\prime }$| curves of all these ARSs from their corresponding chromosomes. Subsequently, the least squares technique was applied, resulting in the value of fitted |$k^{\prime }$| and |${\mathrm{R}}^2$| (R squared, the coefficient of determination). We found that in most (93.75%) ARSs, |${k}^{\prime }>0$| (Figure 2A), which indicates that the AT content of these ARSs is greater than that of their corresponding chromosomes. For those ARSs exhibiting |${k}^{\prime }<0$|, we could find a local AT-rich stretch next to the ACS contained in the corresponding ARS region. Meanwhile, we evaluated the |${\mathrm{R}}^2$| of the fitting line; most (72.73%) ARSs have a characteristic of |${\mathrm{R}}^2>90\%$| (Figure 2A). As a control, the local z|$^{\prime }$| curves of non-ARSs from their corresponding chromosomes were extracted; in contrast to that of the ARSs, we found that the distribution of |$k^{\prime }$| of non-ARSs relatively evenly ranges from −0.3 to 0.3 (Figure 2B). We also observed that the values of |$k^{\prime }$| and |${\mathrm{R}}^2$|, as well as the AT content of non-ARSs are significantly lower than those of the ARSs (Figure 2C–E). These results suggested that the |$\mathrm{z}^{\prime }$| curve of the ARS is an approximately monotonously increasing linear line. In order to identify the ARSs among the chromosomes, we first extracted these AT-rich segments by the windowless technique based on the |$\mathrm{z}^{\prime }$| curve [17,23].

Sequence feature analysis of replication origins. (A) |$k^{\prime}$| and |${\mathrm{R}}^2$| of the fitted |$\mathrm{z}^{\prime}$| curve of 352 ARSs annotated in the SGD database with both |${k}^{\prime }>0$| (red) and |${k}^{\prime }<0$| (blue). The circle size represents the AT content of each sequence. (B) |$k^{\prime}$| and |${\mathrm{R}}^2$| of the fitted |$\mathrm{z}^{\prime}$| curve of 352 non-ARSs randomly extracted from intergenic sequences of S. cerevisiae S288C with both |${k}^{\prime }>0$| (red) and |${k}^{\prime }<0$| (blue). The circle size represents the AT content of each sequence. (C) Comparison of |$k^{\prime}$|, the slope of the fitted |$\mathrm{z}^{\prime}$| curve, between ARSs and non-ARSs. (D) Comparison of |${\mathrm{R}}^2$|, the coefficient of determination, between ARSs and non-ARSs. (E) Comparison of AT content between ARSs and non-ARSs. Center black line, median; boxes, interquartile range (IQR); whisker, 1.5 × IQR; data points beyond the whiskers are outliers. Significance of the above analysis is estimated by the pairwise Wilcox test, and ‘***’ represents P-value <0.001.
Another important element of the replication origin sequences of S. cerevisiae is an 11 bp ACS element serving as a binding site for ORC. To evaluate the ability of the pipeline to identify the ACS elements in DNA sequences, we scanned the ARSs possessing the experimental valid ACS annotated by SGD. We found that 85.71% ACS predictions overlap the recorded ACSs, which reflects the reliability of the motif module integrated in our prediction pipeline for scanning the ACS elements.
Following the above steps, we could determine the candidate ARSs that contain both an AT-rich stretch and the ACS element with the identification resolution at the single-nucleotide level. However, we could extract over 10, 000 short DNA segmentations exhibiting these characteristics. To further accurately and precisely identify the ARSs among the whole genomes, we have adopted a machine learning method, followed by addition of other constraints to screen the candidate ARSs in an efficient manner.
The filtration of candidate ARSs by SVM
The SVM, a machine learning algorithm for classification, was adopted for filtering the candidate ARSs to distinguish the ARSs from non-ARSs. We used Z-curve parameters to extract the sequence features and observed that a total of 93 Z-curve parameters with the combination of phase-independent trinucleotide parameters, phase-specific mononucleotide parameters and dinucleotide parameters provide the best performance for ARS classification (Supplementary Table 1).
We found that the construction or selection of the benchmark dataset considerably affects the prediction performance, even if the same method of machine learning and extracting parameters are used. Here, we collected two previously published benchmark datasets of replication origin sequences from Li [40] and Liu [14], as well as the benchmark dataset constructed in this study (Table 1).
Benchmark datasets
| Dataseta | Reference | No. of positives | No. of negatives |
|---|---|---|---|
| D(Li) | [40] | 405 | 406 |
| D(Liu) | [14] | 340 | 342 |
| D(Wang) | Current work | 380 | 370 |
| Dataseta | Reference | No. of positives | No. of negatives |
|---|---|---|---|
| D(Li) | [40] | 405 | 406 |
| D(Liu) | [14] | 340 | 342 |
| D(Wang) | Current work | 380 | 370 |
aD(Li) indicates the benchmark dataset downloaded from http://lin-group.cn/server/iOriPseKNC/data.html; D(Liu) indicates the benchmark dataset downloaded from http://bioinformatics.hitsz.edu.cn/iRO-3wPseKNC/data/; D(Wang) indicates the benchmark dataset built in this study, which can be download from http://tubic.tju.edu.cn/Ori-Finder3/public/index.php/dataset.
These three ARS benchmark datasets possess different characteristics. For building the positive dataset, Li’s positive ARSs were collected from the OriDB database, and Liu’s positive ARSs were collected from the DeOri database. We built a non-redundant positive dataset with data primarily collected from the SGD database and supplemented with confirmed ARSs from the OriDB and DeOri databases, so that it includes as many positive ARSs as possible with different types and characteristics. For constructing the negative dataset, Li, et al. intercepted the upstream sequences of positive ARSs as negative ARSs. Liu, et al randomly extracted negative ARSs from the non-replication regions in the yeast genome, whereas the intergenic sequences only account for approximate 24% of the whole genome, which indicates that the coding sequence could have a high proportion in the negative dataset. This may reduce the power of the predictor to distinguish between ARS and non-ARS of intergenic sequences and decrease its specificity. Generally, the locations of the replication origins are approximately restricted to intergenic regions in eukaryotes [38,41,42]. In this study, we randomly selected negative ARSs from the non-replication regions in the intergenic sequences of the yeast genome. Another difference is that the length of all sequences in Li’s benchmark dataset is limited to 300 bp, while for Liu’s and our datasets, the ARSs retained their original lengths. Obviously, Li’s benchmark dataset exhibits a good balance, which could improve the fitness and stability of the predictor. However, ARS length varies from 50 base pairs to thousands of base pairs, only intercepting a 300 bp length will lead to an increase in the proportion of non-ARS for short sequences and a loss of the information of true ARSs for long sequences, which would affect the prediction power. The length distribution of the negative dataset was consistent with that of the positive dataset in both Liu’s and our datasets, which not only ensures the balance of data distribution but also retains the complete information of ARSs in the positive dataset.
For these three different benchmark datasets, we adopted the same extraction method based on the Z-curve parameters and the same SVM machine learning method to build the individual prediction model; subsequently, these three prediction models were randomly selected and combined. To achieve the best prediction performance, we used a custom Python script to determine the optimum relative weight of each sub-predictor variable in every combination. The AUC describes the capability of the predictor for distinguishing ARS from non-ARS. We found that the predictor built based on the benchmark dataset constructed in this study showed higher accuracy, specificity and AUC but relatively lower sensitivity compared with other individual predictors (Table 2). The performance of the predictor built on the basis of Liu’s dataset was not good, which may due to the randomly selected regions when constructing the negative dataset so that the predictor exhibits less power to distinguish between ARS and non-ARS of the intergenic sequences. Although the predictor constructed based on Li’s dataset showed relatively lower specificity, its sensitivity score was the highest. We attempted to improve the prediction performance by combining different predictors to compensate for the shortcomings and complement each other. For a combination of the sub-predictors built separately based on Li’s dataset and the benchmark dataset built in this study with relative weights of 0.42 and 0.58, respectively, the AUC could reach up to 0.9618 (Figure 3), and the prediction accuracy could be 91.04% (Table 2), which reflected that the joint application of different predictors could be an effective approach to enhance the prediction power.
The evaluation of different combinations of predictors
| Dataseta | Relative weightb | Accuracy (%) | Sensitivity (%) | Specificity (%) | Precision (%) | F1 scorec | MCCd | AUCe |
|---|---|---|---|---|---|---|---|---|
| D(Liu) | – | 61.13 | 80.21 | 41.08 | 58.87 | 0.679 | 0.2318 | 0.6713 |
| D(Li) | – | 68.64 | 84.06 | 52.43 | 65.01 | 0.7332 | 0.3858 | 0.7721 |
| D(Wang) | – | 80.37 | 79.18 | 81.62 | 81.91 | 0.8052 | 0.6078 | 0.8643 |
| D(Liu) & D(Li) | 0.18; 0.82 | 69.43 | 86.38 | 51.62 | 65.24 | 0.7434 | 0.4067 | 0.8178 |
| D(Liu) & D(Wang) | 0.42; 0.58 | 77.47 | 85.09 | 69.46 | 74.55 | 0.7947 | 0.5534 | 0.8335 |
| D(Li) & D(Wang) | 0.42; 0.58 | 91.04 | 84.58 | 97.84 | 97.63 | 0.9063 | 0.8291 | 0.9618 |
| D(Liu) & D(Li) & D(Wang) | 0.11; 0.30; 0.59 | 87.88 | 85.60 | 90.27 | 90.24 | 0.8786 | 0.7588 | 0.9448 |
a‘&’ indicates the combination of different sub-predictors built by individual datasets.
bthe relative weight of each sub-predictor in every combination.
cF1 score measures the weighted average of precision and sensitivity.
dMCC measures the quality of binary classifications.
eAUC, area under the curve.
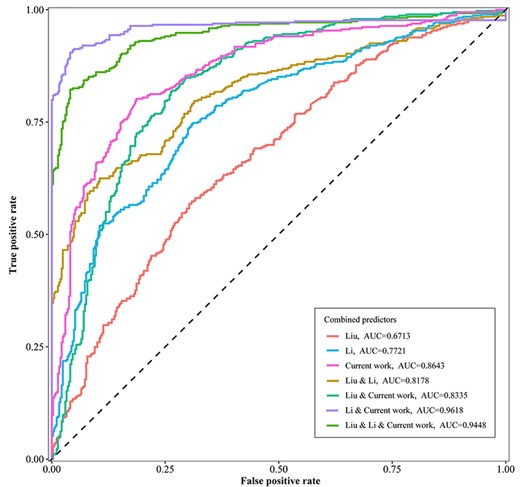
The ROC curves of various combinations of predictors. ‘Liu’ indicates that the predictor was constructed based on D(Liu); ‘Li’ indicates that the predictor was constructed based on D(Li); ‘Current work’ indicates that the predictor was constructed based on D(Wang); ‘&’ indicates the combination of different sub-predictors.
Evaluating the performance of ARS prediction pipeline
Predicting potential ARSs in ARS benchmark dataset
To evaluate the prediction performance for identifying relatively short sequences with the features of replication origins, we randomly partitioned the ARSs benchmark dataset built in this study into 10 equal-sized sub-datasets. Each sub-dataset was tested by Ori-Finder 3 and previously published web servers and software; the average values are listed in Table 3. We found that all these web servers and software showed relatively good sensitivity, while their specificity values are considerably low, except that of Ori-Finder 3. Sensitivity measures the ratio of true positives that are correctly identified, and specificity represents the proportion of true negatives that are correctly predicted. The predictor with high sensitivity and low specificity tends to predict ‘none non-ARS ’ despite the presence of some non-ARSs. The sensitivity and specificity of Ori-Finder 3 are well balanced; it exhibits a relatively higher accuracy compared with other web servers and software.
The evaluation of different ARS prediction web servers and software
| Web server/software | Reference | Length limitation (bp) | Accuracy (%) | Sensitivity (%) | Specificity (%) | Precision (%) | F1 scorea | MCCb |
|---|---|---|---|---|---|---|---|---|
| Ori-Finder 3 | Current work | 50 | 78.68 | 84.87 | 72.16 | 76.44 | 0.8034 | 0.578 |
| iORI-PseKNC2.0 | [13] | 300 | 67.35 | 82.51 | 52.82 | 61.51 | 0.699 | 0.3655 |
| iROI-Euk | [43] | 300 | 66.55 | 79.03 | 54.37 | 61.40 | 0.6861 | 0.3389 |
| iRO-3wPseKNC | [14] | 75 | 64.61 | 88.21 | 39.73 | 60.88 | 0.7198 | 0.3180 |
| SefOri | [15] | 55 | 61.14 | 87.93 | 32.97 | 58.09 | 0.6991 | 0.2496 |
aF1 score measures the weighted average of precision and sensitivity.
bMCC measures the quality of binary classifications.
These web servers and software have a limitation for the length of the input DNA sequences. Specifically, the web servers iROI-Euk [43] and iROR-pSEknc2.0 [13] could only predict sequences that are no less than 300 bp; however, the ARSs are generally 100–200 bp long [44]. According to the ARS records stored in the SGD database, only 25.28% ARSs are longer than 300 bp, which reflects the limitation of the prediction power of these two web servers. Ori-Finder 3 could perform the sequence segmentation and prediction on DNA sequences with length greater than 50 bp, and the prediction results could be displayed at the single-nucleotide level.
Evaluating the prediction performance at the genome-wide level
We executed Ori-Finder 3 with the input of the S. cerevisiae reference genome (Version: R64–2-1). A total of 6,489 potential ARSs were identified with AT content ranging from 38 to 88.75%. The length of these predicted ARSs ranged from 50 to 1,000 bp, with most values close to 210 bp. We observed that the number of predicted ARSs was positively correlated to the length of their corresponding chromosomes with a coefficient of determination of 0.9943. We compared the distributions of length and AT content of top-ranked predictions of Ori-Finder 3 with those of ARS records from SGD database; the results showed that there is no significant difference of sequence characteristics between them, which reflects the predictions of Ori-Finder 3 are reasonable (Supplementary Figure 2A and B).
To better evaluate genome-wide prediction performance, we collected the annotated or published ARS records and experimental data from databases related to S. cerevisiae DNA replication (including SGD, OriDB and DeOri databases) and previously published literature. The program called ‘closest’, integrated in BEDTools, was applied to determine whether the predicted ARSs overlap with the known ARS records. The result showed that the predictions could well cover the ARS datasets obtained from different experimental methods (Figure 4A), reflecting the good sensitivity of the ARS prediction pipeline.
![Prediction performance of the ARS prediction pipeline at the genome-wide level. The S. cerevisiae reference genome (Version: R64–2-1) was used as the test genome. (A) The prediction coverage of known ARS datasets. The gray bars represent the total number of ARS datasets. The blue and yellow bars represent the predicted ARS coinciding with the known ARSs in each ARS dataset; the coverage ratio is annotated above the bar. The blue bar indicates that the ARS records were obtained from databases related to yeast DNA replication origins, and yellow bars indicate that the ARS records were acquired from different yeast replication experimental data, including plasmid-based assays (http://cerevisiae.oridb.org/data_ucsc.php?main=sc_ori_studies&table=sc_cloned_ori&format=BED), miniARS-seq analysis [21] and 2D gel analysis (http://cerevisiae.oridb.org/data_ucsc.php?main=sc_ori_studies&table=sc_2D_gel&format=BED). (B) The predicted ARSs are ranked from left to right. The predicted ARS overlapping the known ARS record is illustrated in red, and the rest is showed in gray. (C) Precision values, described as the ratio of correct predictions to the positive observations, are ranked in groups of ARS predictions in cumulative increments.](https://oup.silverchair-cdn.com/oup/backfile/Content_public/Journal/bib/22/3/10.1093_bib_bbaa182/1/m_bbaa182f4.jpeg?Expires=1749217762&Signature=BwEpsUmdYIaaXy-C2HGptvG-9LDM3mjOVB6Zdcyb0HG-xZzdRndKXhVixhrZ1TLmevRId9io9DTttWp~n6ZoZOkS0KD1Z0Z8NTmCjl7xZucbA2muzcLvtyI98Cyb1lC0m12EjZqVVl2O-SXURQjiBaQ5zlBDkgGTZHZ6GBcPK~TqIjceTfsosopumWpLYhPPrxAegBBIhfeK9uY50QCbYWWjIrDqtF3NoX9BX5cXUQ8DIHTT~nnZRvJA7a0AQyGkLobfhYr7wfWE-rX6YJNcK5leRD6XGNsdYS-Cm0mWBLOMpyNzLOj~faJwS3BwWosOJq85IahX9TFS5ACROqcRBA__&Key-Pair-Id=APKAIE5G5CRDK6RD3PGA)
Prediction performance of the ARS prediction pipeline at the genome-wide level. The S. cerevisiae reference genome (Version: R64–2-1) was used as the test genome. (A) The prediction coverage of known ARS datasets. The gray bars represent the total number of ARS datasets. The blue and yellow bars represent the predicted ARS coinciding with the known ARSs in each ARS dataset; the coverage ratio is annotated above the bar. The blue bar indicates that the ARS records were obtained from databases related to yeast DNA replication origins, and yellow bars indicate that the ARS records were acquired from different yeast replication experimental data, including plasmid-based assays (http://cerevisiae.oridb.org/data_ucsc.php?main=sc_ori_studies&table=sc_cloned_ori&format=BED), miniARS-seq analysis [21] and 2D gel analysis (http://cerevisiae.oridb.org/data_ucsc.php?main=sc_ori_studies&table=sc_2D_gel&format=BED). (B) The predicted ARSs are ranked from left to right. The predicted ARS overlapping the known ARS record is illustrated in red, and the rest is showed in gray. (C) Precision values, described as the ratio of correct predictions to the positive observations, are ranked in groups of ARS predictions in cumulative increments.
We ranked the predicted ARSs according to the prediction score; a high number of matches were clearly visible among the top-ranked predictions (Figure 4B). The precision of the strongest predictions was considerably high; for the top 50 ARS predictions, the precision could reach 94% (Figure 4C). A total of 83 of the top 100 ARS predictions matched the known ARS records. The ARS predictions ranking in the top 500 frequently coincided with the annotated replication origin records, while the precision values kept decreasing as the predictions with lower scores were added.
For further illustrating the detailed genome-wide prediction results, we took chromosome XI of the S. cerevisiae reference genome (Version: R64–2-1) as an example. We listed the ARS predictions identified by Ori-Finder 3 and the known ARS records from related ARS databases and previously published literature, as well as the DNA replication-related experimental data (Figure 5A). Clearly, the predicted ARS within the top 500 largely matched the known ARS records from different ARS databases, and the identification resolution could reach the single-nucleotide level (Figure 5B), which reflects the predictive accuracy of the identified ARSs with high prediction scores. Additionally, we made a comparison between the predicted ARSs and other experimental approaches related to DNA replication, including genome-wide mapping of ORC- and MCM-binding sites [35] and the replication profile of the yeast genome [36]. The ACS motif could be sequence-specifically recognized and bounded by ORC proteins, followed by the ORC-dependent recruitment of MCM proteins [45]. We observed that the predicted ARSs ranked within the top 500 could largely overlap the peaks of the ORC- and MCM-binding data, which reflects the feasibility of the prediction strategy constructed in this study.
![The predicted ARSs compared with the annotated ARSs and experimental datasets related to DNA replication. (A) An example from chromosome XI, from left to right, shown along the chromosome coordinate; the following information is shown from top to bottom: the black vertical rectangle represents the total predicted ARSs and the top-ranked ARS predictions. The green vertical rectangle describes the annotated ARS datasets, including the data from the SGD, DeOri and OriDB (containing confirmed, likely and dubious ARSs) databases, as well as miniARS-seq analysis [21] and plasmid-based assay; the blue plots present the ORC and MCM ChIP signals [35] and replication timing profile [36] of chromosome XI. (B) An example of predicted ARS from chromosome XI, the black line describes the local ${z}^{\prime }$ curve. The plot of ${z}^{\prime }$ curve is also called cumulative GC profile [23]. When A/T bases of local sequence exceed global sequence, the local ${z}^{\prime }$ curve shows a monotonic increase; otherwise, the local ${z}^{\prime }$ curve shows a monotonic decrease. The bright red rectangle represents the predicted ARS, and the dark red rectangle represents the scanned ACS motif. The bright blue rectangle shows the annotated ARS records from the SGD, OriDB and DeOri databases, and the dark blue rectangle represents the annotated ACS motif of ARS1125 according to SGD. The yellow rectangle shows the annotated ARS records from different ARS experimental data, including miniARS-seq analysis and plasmid-based assay.](https://oup.silverchair-cdn.com/oup/backfile/Content_public/Journal/bib/22/3/10.1093_bib_bbaa182/1/m_bbaa182f5.jpeg?Expires=1749217762&Signature=tMBLDQ25dvs4YaSy-25-EptnROtlC6b3Dw2VzzCAZEB0pV1k5F22LXxXfsuSuyPH7bI0Ad-edMSCJdgP4afuF3IuTP9Qi4BS8OSCA5IVzw~oofc4~eu6sy9S1QrH5rBn~gVN-4W3GfbbfGaZrJZ~HbHz70IpPBJxEvuPizRoIWumKS1s58~wBcgNmC~xeQqB~hxNVHYCooGcMY33EFRhNO84KNfej-jwsMgF1~e5O-o1gnPMGcfnufZj8zlqmB2G2zIjoRNuPxklgHGx4PvVUIlMT7aPOuSE0BZnJXPWlPWwBfPluDaEJSpN2cDYKFYAcwBRAh2ql1TrsyEhlynMmQ__&Key-Pair-Id=APKAIE5G5CRDK6RD3PGA)
The predicted ARSs compared with the annotated ARSs and experimental datasets related to DNA replication. (A) An example from chromosome XI, from left to right, shown along the chromosome coordinate; the following information is shown from top to bottom: the black vertical rectangle represents the total predicted ARSs and the top-ranked ARS predictions. The green vertical rectangle describes the annotated ARS datasets, including the data from the SGD, DeOri and OriDB (containing confirmed, likely and dubious ARSs) databases, as well as miniARS-seq analysis [21] and plasmid-based assay; the blue plots present the ORC and MCM ChIP signals [35] and replication timing profile [36] of chromosome XI. (B) An example of predicted ARS from chromosome XI, the black line describes the local |${z}^{\prime }$| curve. The plot of |${z}^{\prime }$| curve is also called cumulative GC profile [23]. When A/T bases of local sequence exceed global sequence, the local |${z}^{\prime }$| curve shows a monotonic increase; otherwise, the local |${z}^{\prime }$| curve shows a monotonic decrease. The bright red rectangle represents the predicted ARS, and the dark red rectangle represents the scanned ACS motif. The bright blue rectangle shows the annotated ARS records from the SGD, OriDB and DeOri databases, and the dark blue rectangle represents the annotated ACS motif of ARS1125 according to SGD. The yellow rectangle shows the annotated ARS records from different ARS experimental data, including miniARS-seq analysis and plasmid-based assay.
Some of the predicted ARSs could be matched with the ARS records annotated as ‘likely’ or ‘dubious’ from the OriDB database, which implies that the prediction pipeline can provide clues to identify potential functional ARSs, and there might still be a large number of potential functional ARSs to be discovered. The flexible and dormant origins are considered as potential replication origins; they are excess in quantity, and only a small part of them could be activated in each cell cycle [46]. The process of DNA damage or stress conditions could lead to the increasing use of origins [47], and the flexible origins could become potential origins used stochastically in different cells. The chromosome harboring multiple origin deletions was reported to replicate relatively normally [48,49]. The deletion of origins could lead to the activation of the nearby origins [50], which suggests that numerous potential origins exist in the chromosomes. However, further experimental verification is needed to determine whether the identified ARS exhibiting high prediction scores without matching the known ARS records show replication activity and whether they function as a replication origin under environmental stress.
The ARS prediction pipeline, Ori-Finder 3, can not only predict the query DNA sequences with various lengths but also identify the potential ARSs at the genome-wide level, which make it possible for researchers to efficiently locate the ARSs from the whole genomes of S. cerevisiae by means of the bioinformatic method.
Web server and user guide
We developed a user-friendly and publicly accessible web server named Ori-Finder 3 (Figure 1B); the following is a step-by-step guide:
Step 1: Open the Ori-Finder 3 web server homepage http://tubic.tju.edu.cn/Ori-Finder3, and start the ARS prediction interface by clicking the ‘Online service’ button.
Step 2: Users can submit the sequence in two ways: one method is to upload the file including the DNA sequences in the FASTA format, and the other is to directly type the sequences in the textbox. Please note that the length of the uploaded or inputted DNA sequences should be within 50 bp to 100 Mbp (due to the RAM limitation, the maximal length should not exceed 100 Mbp).
Step 3 (optional): Users could wait for the results on the current page or receive the results via e-mail, which is optional. Please note that the running time for ARS prediction is directly proportional to the length of the query sequences and ARS prediction in genomes will take a longer time.
Step 4: Click the ‘Submit’ button to execute the ARS prediction.
Step 5 (optional): Users could re-query the predicted results by inputting the job ID; please note that our web server will save the results only for 7 days.
The S. cerevisiae strains possess broad genotypic and phenotypic characteristics, which naturally makes researchers raise questions on the extent of distribution of replication origins in various S. cerevisiae strains with various phylogenetic distances. Therefore, we have constructed a database consisting of the ARSs predicted by Ori-Finder 3 from the genomic data of the S. cerevisiae population, including the S. cerevisiae reference genome (version: R64–2-1), as well as 103 well-annotated budding yeast genome sequences with high genome integrity (> 95%) retrieved from the NCBI FTP site (ftp://ftp.ncbi.nih.gov/genomes/all/). The database could provide researchers with the predicted ARSs that might possess potential functional DNA replication origins, and these identified ARSs could offer us a chance to explore the characteristics of ARSs at a large scale in the yeast population. For example, the distributions of the top 500 ARSs in each yeast genome (Supplementary Figure 3) and the functions of genes adjacent to the predicted ARSs could be analyzed (Supplementary Figure 4) based on this database. With the accumulation of S. cerevisiae genomes, the continuous update of this database would facilitate to discover new insights into the mechanism of DNA replication in S. cerevisiae.
Conclusion
For constructing the ARS prediction pipeline, we combined ACS identification and AT-rich sequence segmentation with machine learning to extract and identify potential ARSs among the DNA sequences with good feasibility and effectiveness using Ori-Finder 3, especially in identifying potential ARSs at the genome-wide level. The predicted ARSs with relatively high scores showed good precision, which reflects the prediction power of Ori-Finder 3 and which could enable researchers to efficiently search potential ARSs in S. cerevisiae genomes. However, further experimental verification is needed to determine whether the predicted ARS exhibiting high prediction scores without matching the known ARS records show replication activity, which will further optimize and upgrade the performance of Ori-Finder 3. Among the Saccharomyces sensu stricto species, a phylogenetically conserved ACS motif was reported [51], which indicates that we could integrate such conserved motifs into the pipeline; this might provide clues for researchers to identify potential replication origins among these closely related Saccharomyces species. However, for higher eukaryotes such as mammals or humans, no relatively exact conserved motifs have been found in their corresponding replication origins [46], and most ORIs still exhibit an AT-rich stretch [52], which indicates that the Z-curve theory could still be used to conduct the AT-rich sequence segmentation. If sufficient large-scale sequence analysis is performed on the known ORIs of higher eukaryotes, Ori-Finder 3 could be updated, and it might serve as a prediction pipeline for recognizing potential ORIs among the genomes of higher eukaryotes.
Accurate identification of replication origins through bioinformatics methods provides a powerful strategy for researchers to efficiently locate potential autonomously replicating sequences (ARSs) from DNA fragments or whole genomes of S. cerevisiae.
A reliable benchmark dataset plays an essential role in building a robust predicting model. Here, we build a high-quality replication origin benchmark dataset containing 380 ARS and 370 non-ARSs for identifying the origins of S. cerevisiae, which could be downloaded from the Ori-Finder 3 website.
Some algorithms or web servers for origin prediction have been built and developed based on the sequence features of replication origins; however, they could not predict the origins at a genome-wide level. We developed a novel, user-friendly web server, Ori-Finder 3, freely available at http://tubic.tju.edu.cn/Ori-Finder3, for the computational prediction of replication origin sequences from the DNA fragments or whole genomes of S. cerevisiae based only on DNA sequences. For predicting the potential ARSs in the reference genome of S. cerevisiae, the precision of the top 100 predictions could reach up to 83% and that of the top 300 predictions could reach up to 60%.
Data availability
The Ori-Finder 3 web server is freely available at http://tubic.tju.edu.cn/Ori-Finder3.
Acknowledgements
The authors would like to thank Prof. Chun-Ting Zhang, for the invaluable assistance and inspiring discussions.
Funding
The National Key Research and Development Program of China [grant number 2018YFA0903700] and the National Natural Science Foundation of China [grant numbers 31571358, 21621004, 31171238 and 91746119].
Dan Wang is a PhD candidate in the Department of Physics, School of Science, Tianjin University. Her research interests are bioinformatics and microbial genomics.
Fei-Liao Lai is an MS candidate in the Department of Physics, School of Science, Tianjin University. His research interests are bioinformatics and microbial genomics.
Feng Gao is a Professor in the Department of Physics, School of Science, and the Frontiers Science Center for Synthetic Biology and Key Laboratory of Systems Bioengineering (Ministry of Education), Tianjin University. His researches are performed in the fields of computational biology and bioinformatics with a special focus on microbial genomics and functional genomics.
