


Abstract
Phase separation is an important mechanism that mediates the spatial distribution of proteins in different cellular compartments. While phase-separated proteins share certain sequence characteristics, including intrinsically disordered regions (IDRs) and prion-like domains, such characteristics are insufficient for making accurate predictions; thus, a proteome-wide understanding of phase separation is currently lacking. Here, we define phase-separated proteomes based on the systematic analysis of immunofluorescence images of 12 073 proteins in the Human Protein Atlas. The analysis of these proteins reveals that phase-separated candidate proteins exhibit higher IDR contents, higher mean net charge and lower hydropathy and prefer to bind to RNA. Kinases and transcription factors are also enriched among these candidate proteins. Strikingly, both phase-separated kinases and phase-separated transcription factors display significantly reduced substrate specificity. Our work provides the first global view of the phase-separated proteome and suggests that the spatial proximity resulting from phase separation reduces the requirement for motif specificity and expands the repertoire of substrates. The source code and data are available at https://github.com/cheneyyu/deepphase.
Introduction
How cells segregate cellular components in a temporally and spatially appropriate manner remains a fundamental question in cell biology. In addition to classic membrane-bound organelles, membraneless organelles offer a flexible way to regulate the location and concentration of various cellular components. Under specific physiological conditions, multivalent molecules such as proteins and nucleic acids referred to as scaffolds undergo polymerization and recruit a class of proteins and nucleic acids referred to as clients, leading to the formation of biomolecular condensates, also known as membraneless organelles or phase-separated compartments [1]. It was recently shown that liquid–liquid phase separation (LLPS) underlies the formation of membraneless organelles [2, 3]. Such compartmentalization increases the local concentration of components within the condensates while allowing the components to be exchanged with the surrounding cellular environment in a highly dynamic and tightly controlled manner. Common membraneless organelles include nucleoli, promyelocytic leukaemia (PML) bodies, stress granules and processing bodies (P-bodies). Recent studies have suggested that transcription factors (TFs) and coactivators regulate gene expression by forming phase-separation condensates at genomic loci such as super-enhancers [4, 5]. LLPS is also involved in various pathological processes, such as those underlying neurodegenerative diseases and oncogenesis [6]. The aberrant liquid-to-solid phase transition of FUS and TDP-43 has been linked to amyloidoses such as amyotrophic lateral sclerosis [7, 8].
Understanding the principles underlying the formation of membraneless organelles is crucial for investigating the physiology and pathophysiology of various biological processes. Furthermore, identifying the proteins linked to LLPS represents a critical first step towards characterizing membraneless organelles. Proteins exhibiting linear repeats of modular domains can interact with each other to form biomolecular condensates. In addition, a high proportion of some kinds of intrinsically disordered regions (IDRs), which lack fixed three-dimensional structures, represent another molecular signature that promotes phase separation. Therefore, sequence analysis is often utilized in the bioinformatics screening of phase-separated proteins such as IDRs [9, 10] and in prion-like domain prediction [11, 12]. However, current phase separation predictors are mostly designed for IDR-containing proteins, thus inevitably overlook phase-separated proteins with a relatively low IDR content [13, 14].
Membraneless compartments exhibit similar droplet-like characteristics, including a spherical shape, permeable surface, highly dynamic nature and fusion upon contact [2, 15–18]. Identifying these spherical droplet structures from immunofluorescence (IF) images represents the most common approach for validating phase-separated proteins. With this method, proteins are fluorescently labelled to trace certain phase-separated compartments formed in vitro as well as in cells. A recent study analysed IF images of normal and perturbed cells to characterize the regulatory effects of 1354 human genes on the characteristics of typical membraneless compartments [19]. The specific droplet structure observed in IF images is a typical feature that distinguishes phase-separated proteins from other proteins. However, such analyses are performed on a protein-by-protein basis, and the scalable analysis of IF images to identify phase-separated proteins has been challenging. Here, we set out to perform the proteome-scale identification and analysis of proteins involved in phase separation based on deep learning from IF images of 12 073 proteins.
Results
Overview of the DeepPhase method and related works
Proteins involved in phase separation usually form spherical droplet structures in IF images when visualized by using fluorescent reporters or antibody staining [3, 18–20]. Therefore, the identification of proteins involved in phase separation can be transformed into a binary image classification problem by identifying IF images with spherical droplet structures.
We collected 170 experimentally confirmed human phase-separated proteins from the published literature (see Methods, Supplementary Table 1 available online at https://dbpia.nl.go.kr/bib). A total of 1490 IF images of these proteins were downloaded from the Cell Atlas of the Human Protein Atlas database (https://www.proteinatlas.org/humanproteome/cell) [21]. Since the formation of phase separation depends on specific conditions such as the concentration, solubility, valence and post-translational modification of a protein [1], phase separation does not always occur in the conditions in which IF images are taken. Therefore, we manually screened IF images that displayed droplets with a higher fluorescence intensity than the background as positive samples, which included 481 images of 75 proteins (see Methods, Supplementary Table 2 available online at https://dbpia.nl.go.kr/bib). To evaluate the quality of the manual screening results, we segmented the droplets and cells in IF images by using CellProfiler3 [22], which is software for analysing cell images. CellProfiler3 provides a score to measure the roundness of droplets in each IF image. The roundness was significantly different between the 481 screened IF images that were manually labelled as exhibiting droplets and the 1009 deserted IF images that were labelled as not exhibiting droplets (Supplementary Figure 1 available online at https://dbpia.nl.go.kr/bib). Furthermore, the screened IF images presented a significantly higher fraction of droplets with a roundness >0.8 than the deserted IF images. We next tested whether the labelled proteins aggregated within the cells. CellProfiler3 can segment cell boundaries in IF images. Hence, within different cell regions, we calculated the mean and standard deviation of the green signal indicating the distribution of the labelled protein. Compared to proteins with a diffuse distribution, proteins with an aggregated distribution are expected to possess a higher ratio of the standard deviation to the mean. As shown in Supplementary Figure 1 available online at https://dbpia.nl.go.kr/bib, the standard deviation/mean ratios of the 481 screened IF images were significantly higher than those of the 1009 deserted IF images. These results indicated that our manual screening identified out the IF images with distinguishable droplets.
The positive sample sets were separated into three parts: the training set, the validation set and the test set. Then, we built a convolutional neural network (CNN) classifier referred to as DeepPhase with the training and validation set, which discriminated IF images that displayed droplet structures (see Methods, Figure 1A, Supplementary Figure 2 available online at https://dbpia.nl.go.kr/bib). The prediction performance of the classifier was evaluated with the test set. The final area under the curve (AUC) of DeepPhase for the test set was 0.93 (Figure 1B), and the balanced accuracy was 0.84 (score cutoff = 0.9), indicating that IF images with droplet-like structures could be discriminated effectively with our deep-learning approach. A total of 12 073 proteins with IF images were scored with DeepPhase. For each protein, multiple scores were generated from IF images from different cell lines and antibodies; the highest score was taken as the DeepPhase score. Among these 12 073 proteins, 2343 (19.4%) candidate phase-separated proteins exhibited DeepPhase scores >0.9 (Figure 1B and C, Supplementary Table 3 available online at https://dbpia.nl.go.kr/bib).
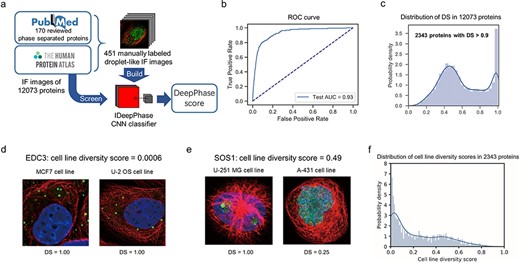
Screening phase-separated candidate proteins with DeepPhase. (A) Overview of DeepPhase for identifying droplet structures in IF images. (B) Receiver operating characteristic (ROC) curves of classification on the test set. (C) Distribution of DeepPhase scores (DS) in 12 073 proteins. (D) IF images of EDC3 in MCF7 cell line and U-2 OS cell line. (E) IF images of SOS1 in U-251 MG cell line and A-431 cell line. (F) Distribution of cell line diversity in candidate proteins.
Proteins with DeepPhase scores >0.9 and DeepPhase scores <0.5 were denoted as candidate proteins and control proteins, respectively. It has been found that some sequence features of proteins are closely relative to their phase separation behaviour, and several sequence-based computational tools had been developed accordingly. We compare the DeepPhase score with four sequence-based LLPS predictors PLAAC [11], PScore [23], PSPer [12] and catGRANULE [24]. As shown in Table 1, scores of both PSPer and catGRANULE were significantly different between candidate and control proteins. Furthermore, it is well established that some types of IDRs facilitate protein phase separation [20]; consistent with this, candidate proteins possess significantly higher content IDR and disorder-promoting residues than control proteins (Table 1). Besides IDR, non-IDR interacting elements like the coiled-coil domain can drive phase separation as well [25, 26]. We predicted the coiled-coil residues with DeepCoil [27], and the contents of coiled-coil residues of candidate proteins in nucleus were significantly higher than those of control proteins in nucleus. Furthermore, the EDC3 and SOS1 proteins have been shown to undergo phase separation in membraneless compartments [14, 28], but only ~20% of their peptide sequences consist of IDRs. Both EDC3 and SOS1 were predicted to form droplets according to DeepPhase (Figure 1D and E). These results suggest that phase-separated proteins with lower IDR content can also be successfully predicted by DeepPhase.
Analysis of enrichment in different characteristics of proteins
| Type | Measure | Reference | Results for all scored proteins | Results for scored proteins localized in nucleus | ||||||||||
|---|---|---|---|---|---|---|---|---|---|---|---|---|---|---|
| Average for candidate proteins | Average for control proteins | P value | Average for conserved candidate proteins | Average for diverse candidate proteins | P value | Average for candidate proteins | Average for control proteins | P value | Average for conserved candidate proteins | Average for diverse candidate proteins | P value | |||
| LLPS predictors | PLAAC | [11] | -0.2067 | -0.2157 | 0.0931 | -0.2085 | -0.2051 | 0.1438 | -0.1991 | -0.1982 | 0.2302 | -0.2072 | -0.1918 | 0.0618 |
| PScore | [23] | 1.2571 | 1.2307 | 0.2071 | 1.2971 | 1.2339 | 0.3692 | 1.3659 | 1.3762 | 0.4269 | 1.3736 | 1.3646 | 0.4611 | |
| PSPer | [12] | 0.2671 | 0.2488 | <0.0001 | 0.2807 | 0.2584 | 0.0003 | 0.2801 | 0.2599 | <0.0001 | 0.294 | 0.2695 | 0.0013 | |
| catGRANULE | [24] | 0.3638 | 0.2938 | 0.0002 | 0.4277 | 0.3398 | 0.0082 | 0.4079 | 0.3426 | 0.0026 | 0.4767 | 0.3706 | 0.0274 | |
| Structural properties | Disordered content by D2P2 | [9] | 0.2009 | 0.1694 | <0.0001 | 0.231 | 0.1849 | <0.0001 | 0.2309 | 0.1989 | <0.0001 | 0.2589 | 0.2127 | 0.0011 |
| Disordered content by Espritz | [10] | 0.2609 | 0.2264 | <0.0001 | 0.2895 | 0.2447 | <0.0001 | 0.2923 | 0.2548 | <0.0001 | 0.3177 | 0.2736 | 0.0017 | |
| Content of coiled-coil residues by DeepCoil | [27] | 0.0961 | 0.0988 | 0.2151 | 0.0992 | 0.0954 | 0.2055 | 0.0959 | 0.0938 | 0.0442 | 0.0967 | 0.0973 | 0.3648 | |
| Content of disorder promoting residues | [89] | 0.6521 | 0.6412 | <0.0001 | 0.6599 | 0.6475 | 0.0001 | 0.662 | 0.6511 | <0.0001 | 0.6694 | 0.6564 | 0.0015 | |
| Electrostatic properties | Fraction of charged residues (R/K/D/E) in the sequence | [89] | 0.2483 | 0.2411 | <0.0001 | 0.2581 | 0.2427 | <0.0001 | 0.2552 | 0.2446 | <0.0001 | 0.2653 | 0.2464 | <0.0001 |
| Mean net charge at pH = 7.4 | [89] | 0.0281 | 0.0253 | 0.0072 | 0.0308 | 0.0256 | 0.0054 | 0.0311 | 0.0262 | 0.0015 | 0.0337 | 0.0278 | 0.0077 | |
| Net charge per residue of the sequence at pH = 7.4 | [89] | -0.0003 | -0.0019 | 0.1345 | 0.0037 | -0.0024 | 0.0062 | 0.0027 | -0.0028 | 0.0018 | 0.0065 | -0.0001 | 0.0153 | |
| Kappa parameters defined by Das & Pappu | [37] | 0.1932 | 0.188 | 0.0002 | 0.1991 | 0.1886 | <0.0001 | 0.1984 | 0.1917 | 0.0002 | 0.2036 | 0.1931 | 0.0001 | |
| Isoelectric point by ProPAS | [92] | 7.1632 | 7.1052 | 0.1739 | 7.3024 | 7.0744 | 0.0109 | 7.298 | 7.0966 | 0.0020 | 7.4193 | 7.1834 | 0.0327 | |
| Isoelectric point by LocalCIDER | [89] | 7.237 | 7.1735 | 0.1387 | 7.3642 | 7.165 | 0.0145 | 7.3686 | 7.1459 | 0.0012 | 7.4798 | 7.2709 | 0.0344 | |
| Mean hydropathy | [90] | 0.4497 | 0.4561 | <0.0001 | 0.4423 | 0.454 | <0.0001 | 0.4426 | 0.4495 | <0.0001 | 0.4352 | 0.4485 | <0.0001 | |
| Binding | RNA-binding property by TriPepSVM | [31] | 0.2271 | 0.159 | <0.0001 | 0.306 | 0.1867 | <0.0001 | 0.2719 | 0.1834 | <0.0001 | 0.337 | 0.226 | <0.0001 |
| Content of disordered DNA binding residues | [32] | 0.0557 | 0.0459 | <0.0001 | 0.0689 | 0.0487 | <0.0001 | 0.0674 | 0.0516 | <0.0001 | 0.0791 | 0.059 | 0.0037 | |
| Content of disordered RNA binding residues | [32] | 0.0836 | 0.0871 | 0.0621 | 0.0923 | 0.0763 | 0.0151 | 0.0848 | 0.0864 | 0.0957 | 0.0933 | 0.0749 | 0.0178 | |
| Content of disordered protein binding residues | [32] | 0.0714 | 0.0579 | <0.0001 | 0.0826 | 0.0644 | 0.0006 | 0.0808 | 0.0704 | 0.0043 | 0.0912 | 0.0728 | 0.0673 | |
| Aggregation | Aggregation score per residue by TANGO | [35] | 4.4251 | 4.8813 | 0.0006 | 3.9643 | 4.712 | 0.0002 | 3.6897 | 4.0695 | 0.0074 | 3.2734 | 4.0742 | 0.0103 |
| Aggregation energy by PASTA2 | [36] | -9.4846 | -9.8446 | 0.0603 | -9.2455 | -9.6379 | 0.0167 | -8.7602 | -9.2095 | 0.0334 | -8.5938 | -8.902 | 0.0334 | |
Many phase separation proteins were found to be RNA-binding proteins [29, 30]; hence, we tested if candidate proteins prefer to bind to RNA. The RNA-binding property was predicted by TriPepSVM [31], and the results displayed in Table 1 show that candidate proteins prefer to bind to RNA (Table 1). We also predicted the content of disordered DNA, RNA and protein binding residues with disoRDPbind [32]. As shown in Table 1, all these kinds of disordered binding residues were significantly higher in candidate proteins than in control proteins (Table 1). Protein aggregation was reported to correlate with LLPS, and aberrant protein aggregations were usually found in neurodegenerative diseases [33, 34]. We used TANGO [35] and PASTA2 [36] to predict the residues that contribute to protein aggregation; to our surprise, both predictors showed that the candidate proteins exhibit significantly lower potential of aggregation. We further compared the scores of TANGO and PASTA2 between the known phase-separated proteins and the control proteins and found that known phase-separated proteins also exhibit significantly lower potential of aggregation than control proteins (see Supplementary Table 4 available online at https://dbpia.nl.go.kr/bib).
We further explore the electrostatic properties of candidate proteins. We found that compared with control proteins, candidate proteins exhibit significantly higher fractions of charged residues (R/K/D/E), higher mean net charge (calculated at pH = 7.4) and lower hydropathy (Table 1). Though the net charge per residue (calculated at pH = 7.4) and isoelectric point showed no significant difference between candidate proteins ensemble and control proteins, these two parameters were significantly higher in the nucleus-localized candidate proteins than the nucleus-localized control proteins. Furthermore, we compared the kappa parameters defined by Das and Pappu [37]. Candidate proteins also exhibit significantly higher kappa parameters than control proteins. All these results indicated that the value, fraction and distribution of charges could contribute to protein phase separation, especially for proteins localized in nucleus.
In general, our results showed that the candidate proteins prefer to exhibit higher content of disordered regions, more charged residues, lower hydropathy and higher mean net charge; candidate proteins also exhibit higher content of disordered binding residues and prefer to bind RNA. These results were consistent with features of known phase-separated proteins [30, 33, 38, 39].
DeepPhase can measure the cell type specificity of identified phase-separated candidate proteins
In contrast to amino acid sequence-based prediction, DeepPhase predicts phase separation behaviour in the specific conditions when IF images are taken, providing a unique opportunity to investigate the cell type-specific regulation of phase separation for proteins with for which IF images from different cell lines. For all 2343 candidate proteins with DeepPhase scores higher than 0.9, 2296 (2296/2343 = 98%) proteins had available IF images from staining in at least two cell lines, and 2109 (90%) proteins had IF staining images from at least three cell lines. To cover more candidate proteins, we defined the difference between each protein’s highest and the second highest DeepPhase scores in different cell types as the cell type diversity score, and proteins that were found to be droplet-like in different cell types presented relatively low diversity scores. Proteins with cell type diversity scores <0.05 and cell type diversity score >0.1 were denoted as conserved candidate proteins and diverse candidate proteins, respectively. Approximately 33% of the candidate proteins were conserved and exhibited similar droplet structures in different cell lines (Figure 1F). For example, EDC3 formed droplets in both MCF7 and U-2 OS cells (Figure 1F). On the other hand, 54% of candidate proteins displayed droplet structures in one specific cell type. For example, SOS1 exhibited a diversity score of 0.49. It displayed a droplet structure in the U-251 MG cell line, whereas the signal was more diffuse in the A-431 cell line (Figure 1E). As another example, IF images of EWSR1 were generated in three cell lines, A-431, U-2 OS and U-251MG, but droplet structure was only detected in U-2 OS cells, which is consistent with the cell type diversity score of 0.22 (see Supplementary Figure 3 available online at https://dbpia.nl.go.kr/bib).
We investigated common characteristics shared by proteins with cell type-specific phase separation behaviours relative to proteins with conserved phase separation behaviours in different cells. First, we tested whether proteins that only generated droplet structures in specific cell types tended to present variable expression levels across different cell lines, indicating that the diversity of phase separation correlates with the diversity of expression levels. RNA-seq data from different cell lines were downloaded from the Human Protein Atlas database. Here, RNA-seq data are used instead of mass spectrum (MS)-based protein expression levels since MS-based protein expression data are limited. For each protein, the diversity of expression levels was defined as the ratio of the mean expression level to the standard deviation. We compared the diversity of expression levels with the diversity score of phase separation and found that the diversity of phase separation was significantly different between proteins showing high or low diversity of expression levels (see Supplementary Figure 4 available online at https://dbpia.nl.go.kr/bib). These results indicated that expression level is a possible reason why proteins form droplets in one cell line but not another.
In addition to the diversity of expression levels, the diversity of phase separation was related to the IDR content of a protein. As shown in Figure 1I, conserved candidate proteins tended to harbour more IDRs than diverse candidate proteins. Furthermore, conserved candidate proteins also presented significantly more charged residues, higher kappa parameters, higher mean net charge, higher isoelectric point, lower hydropathy and stronger binding properties than diverse candidate proteins (Table 1). In particular, the difference in kappa parameters between conserved and diverse candidate proteins was even more significant than the difference between candidate and control proteins, suggesting that these properties can help to distinguish between conserved and cell line-specific phase-separated proteins.
To test the robustness of the above conclusion, we defined two additional diversity scores to investigate the phase separation diversity of each protein in different cell lines. The first score was the standard deviation of the DeepPhase scores from different cell types. For the cell type with more than one available IF image, the highest score was used. The second score was the ratio of the standard deviation to the mean. As shown in Supplementary Table 5 available online at https://dbpia.nl.go.kr/bib, all three diversity scores resulted in the similar conclusion. For people working with such proteins that generate droplet structures conditionally, the antibody and cell line information might guide subsequent phase separation studies (see Supplementary Table 3 available online at https://dbpia.nl.go.kr/bib).
DeepPhase can discriminate known and novel potential phase-separated proteins in different membraneless organelles
To further investigate whether the DeepPhase scores extracted from the IF images of specific proteins predict phase separation potential, we examined the DeepPhase scores of proteins known to be localized in different membraneless organelles from database annotations and high-throughput experiments (see Methods, Supplementary Table 6 available online at https://dbpia.nl.go.kr/bib); the proteins used in training and test processes were removed for this analysis. We found that known phase-separated proteins in nucleoli, PML bodies and P-bodies presented significantly higher DeepPhase scores than other proteins (Figure 2A).
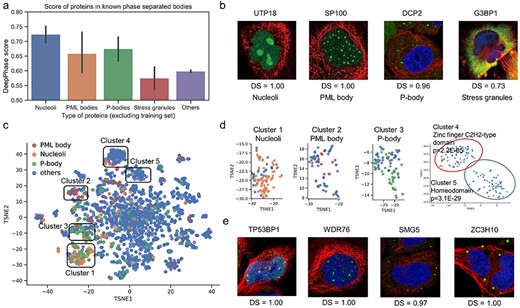
Visualization of proteins localized in phase-separated component. (A) DeepPhase scores of proteins in known phase-separated component. (B) IF images and DeepPhase scores (DS) of known marker proteins in phase-separated components. (C) T-SNE visualization of identified 2343 candidate proteins in the PPI network. (D) Visualization of five clusters in the PPI network. (E) IF images of TP53BP1 and WDR76 (potential PML body-associated members) and SMG5 and ZC3H10 (potential P-body-associated members).
Nucleolar proteins are considered to segregate into at least three subcompartments where different ribosome biogenesis processes take place [40]. The markers of these subcompartments, POLR1E, FIB1 and NPM1, were shown to form droplet structures with DeepPhase scores as high as 0.99 (see Supplementary Table 3 available online at https://dbpia.nl.go.kr/bib). The PML body is another membraneless compartment in the nucleus. The proteins ATRX, MRE11, HIPK3, RPAIN, TDP2 and SP100 were previously demonstrated to be components of the PML body [41]. They similarly displayed clear droplets, and their DeepPhase scores were higher than 0.90 (Figure 2B, see Supplementary Figure 5 available online at https://dbpia.nl.go.kr/bib). It is worth noting that despite the identification of similar DeepPhase scores for proteins such as UTP18 in nucleoli (1.00) and SP100 in the PML body (1.00), the nucleoli droplets were less spherical and significantly larger than the PML body droplets, and our method could recognize both types of droplets. In addition to these two intranuclear membraneless organelles, components of extranuclear membraneless organelles could also be discriminated by DeepPhase. For example, DCP2, a component of the P-body [42], displayed clear droplets mainly in the cytoplasm (Figure 2B). Stress granules are phase-separated organelles that appear to protect RNAs when cells are stressed [43]. Since the IF images downloaded from the Human Protein Atlas database were generated without exogenous stress, the components of stress granules displayed diffuse signals with relatively low scores (Figure 2A). One recent report showed that without exogenous stress, the stress granule marker G3BP1 displays diffuse signals throughout the cytoplasm [44], which agrees with diffuse cytosolic signals found in G3BP1 IF images (Figure 2B). Taken together, these analyses demonstrated that DeepPhase was highly effective in extracting putative phase-separated components of both nuclear and cytoplasmic membraneless organelles.
Building on these observations, we investigated whether the novel potential phase-separated proteins identified by DeepPhase could be assigned to different membraneless organelles. To achieve this goal, we clustered proteins based on protein–protein interactions (PPIs) from the STRING database [45]. The PPI network was embedded into vectors using the node2vec algorithm [46] and visualized in 2D space using T-distributed stochastic neighbour embedding (t-SNE) [47], so that proteins with more similar PPI contexts were located closer to each other (Figure 2C; see Methods). As shown in Figure 2D, known proteins found in nucleoli (Cluster 1), PML bodies (Cluster 2) and P-bodies (Cluster 3) were clustered. These clusters provide an approach to identify novel components of the corresponding membraneless organelles. For example, TP53BP1, which was recently demonstrated to be a phase-separated protein [48], was included in the PML body cluster, and PML was previously reported to colocalize with TP53BP1 in DNA lesions [49]. As another example, WDR76, which interacts with chromatin components and exhibits functional similarity to PML bodies [50], was also included in the PML body cluster. Both TP53BP1 and WDR76 received a score of 1.00 and exhibited similar droplet structures to PML bodies (Figure 2E), suggesting that they are potential components or interacting proteins of PML bodies. Among proteins in the P-body cluster, the RNA-associated proteins ZC3H10 and SMG5, whose DeepPhase scores were 0.97 and 1.00, respectively, showed droplet structures in the cytoplasm similar to known P-body components (Figure 2E). Furthermore, SMG5 plays a role in nonsense-mediated mRNA decay, and ZC3H10 regulates the microRNA miR-143 [51, 52], whose functions are highly associated with the P-body, indicating that these proteins are likely new P-body components. These data suggested that with additional functional annotations and droplet types in IF images, the phase-separated candidate proteins identified by DeepPhase could be assigned to different membraneless organelles.
Beyond well-studied organelles, we found that two novel clusters (clusters 4 and 5) were highly enriched in two large TF families (the zinc finger family and homeobox family, respectively), suggesting their general potential to undergo phase separation. This is consistent with recent studies, indicating that TFs form phase-separated condensates with coactivators at genomic loci with transcriptional enhancers and influence gene expression [4, 5].
Phase-separated proteins exhibit different structural characteristics
Previous works have suggested that structural characteristics such as Pi–Pi interactions and fibril core-forming segments contribute to LLPS [23, 53]; however, the common characteristics and mechanisms of protein phase separation remain unknown. To investigate the structural preference of phase-separated proteins, we clustered the sequences of identified candidate proteins with structural information. To this end, we adopted a neural network that mapped a protein sequence to a sequence of vector embeddings that encoded structural information [54] (see details in Methods). With this approach, each protein sequence was mapped to a sequence of vector embeddings encoding structural information. Then, ordered and disordered candidate proteins were clustered separately with the agglomerative hierarchical clustering algorithm. A total of 716 disordered candidate proteins with IDR > 0.25 were clustered into four groups, and 1586 ordered proteins with IDR ≤ 0.25 were clustered into six groups (HC1-4 and LC1-6, Figure 3A).
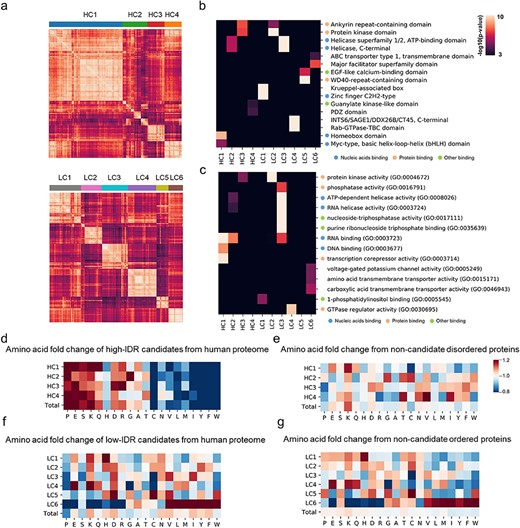
Sequential and functional preference of candidate proteins. (A) Sequence clustering of high-IDR candidate proteins HC1–4 and low-IDR candidate proteins LC1–6. (B) Interpro domain enrichment of proteins in different sequence clusters. (C) Gene ontology enrichment of proteins in different sequence clusters. (D) Amino acid distribution of high-IDR candidate proteins compared with human proteome. (E) Amino acid distribution of high-IDR candidate proteins compared with high-IDR control proteins. (F) Amino acid distribution of low-IDR candidate proteins compared with human proteome. (G) Amino acid distribution of low-IDR candidate proteins compared with low-IDR control proteins.
To investigate the domain and function of each sequence cluster, we applied gene set enrichment analysis to all clusters with Enrichr [55]. Interestingly, zinc finger domains were enriched in cluster LC1, and homeobox domains were enriched in cluster HC1 (Figure 3B), suggesting different IDR content preferences of different TF families. The zinc finger family and homeobox family were found to be enriched in PPI clusters 4 and 5, respectively. We calculated the correlations between PPI clusters and sequence clusters based on the observed-to-expected ratio (see Methods). PPI cluster 4 was most similar to cluster LC1, and PPI cluster 5 was most similar to HC1 (see Supplementary Figure 6 available online at https://dbpia.nl.go.kr/bib). Moreover, WD40 repeat domains and ankyrin repeat-containing domains were enriched in clusters LC5 and HC3, respectively. These two domains were previously reported to mediate PPIs [56, 57] and may contribute to the multivalence of membraneless organelles, which is an important feature in LLPS. It was recently reported that protein interactions using WD40 motifs might be a common feature of processes that are reliant on LLPS, which was consistent with our findings [58]. Previous work indicated that the RNA helicase DDX3X can undergo LLPS in vitro [59], and we found that proteins with helicase activity were dramatically enriched in cluster LC3 and enriched in HC2 (Figure 3C), suggesting the phase separation behaviour of RNA helicases. Interestingly, transmembrane proteins, including four ABC transporter proteins, were enriched in LC6, and it was recently reported that a member of the ABC transporter family has the ability to undergo phase separation into mesoscale assemblies [60].
We further investigated the amino acid preference of different sequence clusters. As shown in Figure 3D and E, cluster HC2 exhibited more glycine residues but fewer glutamine residues. Previous work indicated that glycine maintains the liquidity of proteins, and the replacement of aspartate and glutamate residues with glycine residues enables the phase separation of the prion-like RNA-binding protein TAF15 [61]. Consistent with that finding, our results showed that the increase in glycine may only have contributed to proteins in HC2, in which RNA-binding proteins were enriched. We also found that lysine (K) was enriched in all high-IDR clusters compared with both control high-IDR proteins and the human proteome (Figure 3D and E) and was also enriched in LC4 (Figure 3F and G). These results suggested that an increase in lysine discriminates candidate proteins from control proteins, independent of IDRs.
Increased post-translational modification frequencies and decreased substrate specificities of phase-separated candidate proteins
Post-translational modifications (PTMs) are frequently found in IDRs mediating multivalent interactions [62], and they might play a role in regulating phase separation [63, 64]. PTMs change the physicochemical properties of the modified amino acids and can thereby affect phase separation behaviour [65]. For instance, the phase separation of FUS is inhibited by arginine methylation [66], and phosphorylation helps to clear amyloid-like assemblies during meiosis [67].
We further investigated the difference in PTMs between candidate and control proteins. For proteins with more than 25% IDRs, the occurrence of phosphorylation (on Ser/Thr), sumoylation, ubiquitination and acetylation was more frequent in candidate proteins (Figure 4A). In particular, the candidates exhibited dramatically more phosphorylation sites at both the C- and N- termini, while for proteins with less than 25% IDRs, the difference was not as substantial. In different clusters, candidate proteins with a high IDR content (HC1–HC4) all exhibited more phosphorylation sites on Ser/Thr residues than both control proteins with a high IDR content (HNC) and candidate proteins with a low IDR content (Figure 4B). This difference was not observed for phosphorylation on Tyr, but cluster LC2 exhibited slightly more Tyr phosphorylation sites (Figure 4C). Considering that protein kinases were enriched in LC2, these results suggested that the candidate protein kinases were partially regulated by Tyr phosphorylation. In regard to sumoylation, unlike the observed general enrichment of phosphorylation, only candidates in the HC2 and LC2 clusters exhibited increased sumoylation (see Supplementary Figure 7 available online at https://dbpia.nl.go.kr/bib).
Phase separation can concentrate a specific set of molecules in the condensed state to facilitate efficient biochemical reactions. In contrast, molecules such as components of enzymatic reactions may be sequestered in different phases of condensates to prevent reactions or for inactivation [20, 68]. For example, after being phosphorylated by the ZAP70 kinase, the transmembrane protein LAT recruits ligands such as the SOS1 protein and forms a LAT complex that coalesces into T cell microclusters that activate downstream signalling pathways [14]. In this process, the kinases and substrates are concentrated and may facilitate the phosphorylation process by reducing the requirement for substrate specificity. To test this hypothesis, we investigated whether the substrate specificities of these potential phase-separated kinases were lower than those of other kinases. The substrate specificities of 286 kinases were extracted from a previous study [69]. A total of 243 of 286 kinases observed in IF images were scored by using DeepPhase. Substrate specificities determined based on a small substrate set will likely be inaccurate; therefore, 84 kinases with less than 50 potential substrates were removed. The remaining 159 kinases included 127 serine/threonine kinases and 32 tyrosine kinases. We found that the substrate specificities of 29 potentially phase-separated Ser/Thr kinases with DeepPhase scores >0.9 were significantly lower than those of 58 Ser/Thr kinases with DeepPhase scores <0.5 (one-tailed Mann–Whitney U test, P = 0.012, Figure 4D). Then, for each kinase, we calculated the proportion of substrates with DeepPhase scores higher than 0.90 to further examine whether phase-separated kinases tend to have phase-separated substrates (see Supplementary Table 7 available online at https://dbpia.nl.go.kr/bib). The results indicated that kinases with DeepPhase scores >0.9 tended to have more substrates with DeepPhase scores >0.9 (one-tailed Mann–Whitney U test, P = 0.013, Figure 4E). When the phase-separated kinases were ranked by the fraction of substrates with a DeepPhase score > 0.9, the top five kinases were CDK4, CHEK2, AKT2, PDPK1 and MTOR (see Supplementary Figure 8 available online at https://dbpia.nl.go.kr/bib). Taken together, these data suggest that protein kinases may function by recruiting substrates in condensates, thereby reducing substrate specificity.
The above analysis revealed that the spatial proximity resulting from phase separation reduce the requirement of specificity of kinase–substrate interactions. We further argue that the phase separation of TFs may result in spatial proximity to their target genomic loci and, thus, reduce the specificity of protein–DNA interactions that are normally required to affect gene expression. To test this hypothesis, we compared the binding motif specificity of candidate phase-separated TFs and control TFs by comparing the AUC of their position-specific scoring matrices from the HOCOMOCO database [70]. The AUCs of 259 TFs were collected, including 55 TFs with DeepPhase scores >0.9 and 109 TFs with DeepPhase scores <0.5. Compared with TFs with low phase-separated potential (DeepPhase score < 0.5), TFs with high phase-separated potential (DeepPhase score > 0.9) exhibit significantly lower specificity (one-tailed Mann–Whitney U test, P = 0.012, Figure 4F). The results suggested that TFs undergoing phase separation tend to recognize less-conserved motifs, whereas TFs without phase separation generally require more specific binding motifs. In summary, our results indicated that reducing motif requirements is a general biochemical function of phase separation.
Discussion
In this study, we established a method referred to as DeepPhase that discriminates IF images with droplet structures. The application of DeepPhase to proteome-scale IF images produced a list of proteins that displayed droplet structures. In contrast to sequence-based analysis methods, the phase-separated proteins predicted by DeepPhase exhibited multimerization potential. Furthermore, as IDRs are present in many phase-separated proteins, current phase separation predictors are mostly designed for IDR-containing proteins, and such analysis may lead to bias and overlook proteins that drive phase separation without the presence of IDRs. Our method identified phase-separated candidate proteins regardless of their IDR composition and revealed that many of them exhibited relatively ordered structures.
The importance of phosphorylation in phase separation is well established, but how phase separation affects phosphorylation is less clear. Based on the scores generated by DeepPhase, we found that the enrichment of phosphorylation sites is an important characteristic of phase-separated candidate proteins (Figure 4A). During the phosphorylation process, kinases display a preference for certain sequence motifs flanking the target Ser/Thr/Tyr site. However, it is common for kinases to also phosphorylate substrate sites without the preferential motif. Our results displayed in Figure 4D indicated that the phase-separated compartments might facilitate the phosphorylation process by reducing the requirement for substrate specificity. The candidate phase-separated kinases identified in this study provide new mechanistic insights into well-established phosphorylation signalling pathways. For example, the candidate kinase CHEK2 (with 29% candidate substrates) phosphorylates PML [19, 71, 72] and tau [73, 74], and PML and CHEK2 can mediate p53-independent apoptosis following gamma irradiation [75]. In addition to PML and tau, the other two substrates of CHEK2, CDC25C and BDNF, received DeepPhase scores of 0.97 and 0.95, respectively. Multiple studies have proven that CHEK2 phosphorylates PML on Ser-117 and colocalizes in PML nuclear bodies [75, 76]. Furthermore, it has been found that the interaction of CHEK2 with the proteasome activator REGγ is necessary for the regulatory effect of REGγ on the number of PML nuclear bodies [77]. However, the functions of CHEK2 in phase-separated compartments have not been clearly elucidated.
It has been suggested that the compartmentalization of phase-separated proteins concentrates biochemical reactions [33]. In our work, we suggested that in the condensate of a phase-separated kinase-substrate complex, the kinase could phosphorylate sites that are suboptimal (less specific) or are not fully consistent with its conventional phosphorylation motif. Interestingly, in addition to the reduced substrate specificities observed in the phosphorylation process, we found that compared with the diffused TFs in IF images, the droplet-like TFs also exhibited lower motif specificity, indicating a general biochemical function of protein phase separation to expand the repertoire of substrates by spatial proximity and reduce motif specificity (hence increasing tolerance and robustness).
As described in the Introduction section, studies have usually predicted the LLPS potential based on protein sequences [11, 23, 24]. To compare the results of DeepPhase analysis with existing methods, we used PSPer, catGRANULE, PScore and PLAAC to score candidate proteins. However, except for PSPer and catGRANULE, the prediction results of the sequence-based methods were different from those of DeepPhase. One possible reason for this disparity is that some phase-separated proteins that did not appear as droplets in the scored IF images could not be identified by DeepPhase. It is well established that parameters such as temperature, pH and solvent strength can affect the phase separation process, and some proteins aggregate only under certain conditions [34]. The other possible reason is that DeepPhase predicts phase-separated proteins independent of peptide sequences. Among the 2343 candidate phase-separated proteins with a DeepPhase score > 0.9, 1586 proteins presented an IDR content of less than 0.25, while sequence-based prediction methods are usually biased toward phase-separated proteins with a high IDR content. We used the LLPS driver protein GM130 (Golgi matrix protein) as an example. Unlike other LLPS driver proteins, GM130 does not possess a high proportion of IDRs and LCRs [25]. The scores for GM130 produced by PSPer, catGRANULE, PScore and PLAAC were ranked as 22, 61, 56 and 81% of the 12 703 scored proteins, while the score of GM130 was ranked by DeepPhase as 93%.
Intermolecular interactions including charge–charge interaction, cation–pi interaction, dipole–dipole interaction and pi–pi interaction have been proposed to drive phase separation [23, 78, 79]. As shown in Table 1, candidate proteins possess larger fractions of charged residues and exhibit significantly higher kappa parameters, which indicate the segregated distribution of oppositely charged residues. However, the predicted results of PScore, which indicate planar pi-pi contacts, show no difference between candidate and control proteins. These results suggest that charge–charge interactions contribute more to DeepPhase-detected candidate proteins compared to pi–pi interactions.
Besides intermolecular interactions, protein aggregation contributes to LLPS as well [80], while the results of two protein aggregation predictors (TANGO and PASTA2) demonstrate that candidate proteins exhibit significant lower potential of aggregation than control proteins (Table 1). A possible reason is that IF images used in this study were not taken under specific pathological conditions suitable for protein aggregation. Another reason is that both TANGO and PASTA2 were designed to predict protein aggregation by identifying the cross-beta structure. The structure should be underrepresented in the candidate proteins and known phase-separated proteins, which are enriched with disordered regions. However, a significant difference of aggregation potential is found among the low IDR structural clusters. Compared with candidate proteins from LC1 to LC5, the proteins from LC6 exhibit significantly higher potential of aggregation (one-tailed Mann–Whitney U test, TANGA: P = 3.4E−72, PASTA2: P = 1.4E−55, see Supplementary Figure 9 available online at https://dbpia.nl.go.kr/bib). The results suggest that a subgroup of candidate proteins with low IDR content exhibits the potential of protein aggregation.
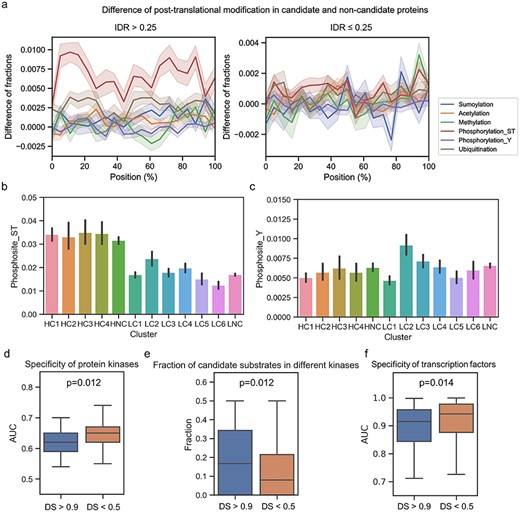
Preference of PTMs in candidate proteins. (A) Differences of position-based PTM distributions in candidate/control proteins. Line plots show differences of specific PTMs distribution in proteins with DeepPhase scores higher than 0.9 and DeepPhase scores lower than 0.5; proteins with high or low IDR were individually shown. Comparison of phosphorylated serine or threonine (B) and phosphorylated tyrosine (C) sites in different sequence clusters. (D) Comparison of substrate specificity of candidate/control Ser/Thr kinases. (E) Comparison of fraction of candidate substrates in candidate/control Ser/Thr kinases. (F) Comparison of specificity of candidate/control transcription factors.
There are still drawbacks in the identification of phase-separated candidate proteins from IF images. First, unlike conditions in the nucleus, cytoplasmic membrane-bound organelles such as endosomes or lysosomes display spherical structures similar to membraneless organelles. Among the 2343 candidate phase-separated proteins, 120 were annotated as being located in endosomes and lysosomes by Swiss-Prot. However, it seems impossible to generally exclude these proteins since the known phase-separated proteins PML, LSM4, NBR1 and BAAT were annotated as being located in endosomes and lysosomes as well. Second, since the development of phase separation depends on specific conditions, proteins that are capable of undergoing phase separation are not always phase-separated. Those conditionally phase-separated proteins that do not appear droplets in the IF images cannot be identified by DeepPhase, which could result in false negatives. Third, it has been established that under specific conditions, some multivalent molecules (mainly proteins and nucleic acids) referred to as scaffolds can undergo polymerization and recruit a class of proteins and nucleic acids referred to as clients [81, 82]. However, the differences between scaffolds and clients could not be discriminated by DeepPhase since they both display droplet structures in IF images. We extracted 3493 client proteins and 113 scaffold proteins from two recently published databases, DrLLPS and PhaSePro [83, 84]. Twenty-two scaffold proteins and 502 client proteins received a score higher than 0.9 from DeepPhase. We found that 72% (16/22) of scaffold proteins came from the high IDR clusters (IDR content >0.25) and that 39% (195/502) of client proteins came from the high IDR clusters. These results indicated that for the candidate phase-separated proteins generated by DeepPhase, the scaffold proteins tended to possess a high IDR content, while client proteins tended to possess low IDR content. We anticipated that further sequence and structure analysis may contribute to refining the candidate list and discriminating the scaffolds and clients.
Methods
Collection of proteins involved in phase separation and related images
A total of 2526 publications from 1 January 2000 to 21 October 2018 were extracted from PubMed using the keywords ‘phase transition’, ‘phase separation’, ‘membraneless organelles’ or ‘biomolecular condensate’, and these articles were manually reviewed. As a result, 170 human proteins were confirmed to be involved in phase separation (see Supplementary Table 1 available online at https://dbpia.nl.go.kr/bib). The extracted articles and proteins were integrated and could be accessed in the external database PhaSepDB [85].
The Cell Atlas of the Human Protein Atlas database (https://www.proteinatlas.org/humanproteome/cell) [21] provides antibody-based profiles obtained by immunofluorescence confocal microscopy for 12 073 proteins with available antibodies. In total, 83 673 IF images generated for different antibodies in different cell lines were downloaded and stored for subsequent analysis.
A total of 152 of 170 collected human phase-separated proteins had available IF images, and they were mapped to 1490 IF images. The development of phase separation is condition dependent, and experimentally verified phase-separated proteins do not appear spherical droplets in all IF images. Three types of images were manually labelled as positive samples: (i) images with droplet-like condensates in the nucleus, (ii) images with nucleoli-like condensates and (iii) images with droplet-like condensates in the cytosol. Example images are displayed in Supplementary Figure 10 available online at https://dbpia.nl.go.kr/bib. Finally, 481 of 1490 images displayed droplets with a higher fluorescence intensity than the background were manually selected for further analysis. These images were separated into a positive training set, a validation set (195 and 79 images from 40 proteins) and a test set (207 images from 35 proteins) according to the time at which these proteins were manually collected. The proteins in the test set did not overlap with those in the training and validation sets.
A total of 734 of 12 703 proteins exhibited overlapping IF images because of the use of antibodies recognizing multiple antigens. The overlap often occurred for homologous proteins and did not affect the training, validation or test set. A total of 130 candidate phase-separated proteins (DeepPhase scores >0.9) selected from the overlapping images are presented in Supplementary Table 3 available online at https://dbpia.nl.go.kr/bib.
Segmentation of droplets and cells in IF images by using CellProfiler3
CellProfiler3 was used to segment droplets and cells in the IF images. The droplets were segmented by the robust background thresholding method based on the green signal (the labelled protein). The roundness of the segmented droplets was measured according to the FormFactor score in CellProfiler3. The cells were segmented by Otsu’s thresholding method in CellProfiler3 based on the red (microtubules) and blue (DAPI) signals. The mean and standard deviation of the green signal, which demonstrated the distribution of the labelled protein, were calculated for each cell. More details and the script for segmentation and measurements are available at https://github.com/cheneyyu/DeepPhase.
Convolutional neural network
As described in Supplementary Figure 11 available online at https://dbpia.nl.go.kr/bib, our CNN model contained seven layers with trainable weights; the first five layers were convolutional, and the remaining two layers were fully connected. Convolutional layers were activated with the RELU function and connected with max-pooling layers, which pooled each 2 × 2 pixels into 1 pixel; the last max-pooling layer was linked with a global max-pooling layer, which pooled a 14×14×64 tensor into a vector of length 64. Then, the vector was connected with a fully connected layer with 64 neurons and RELU activation, a dropout layer with a dropout rate equal to 0.2, and a fully connected layer with one neuron and sigmoid activation. The output of the sigmoid function was a value ranging from 0 to 1, which represented the possibility of image classification. We built our model with Keras 2.2 and TensorFlow 1.12.
Training and test process of DeepPhase
Two-stage training was applied in the training process (Figure 1A). In the first stage, the CNN network was trained with the positive training set, which included 195 images, and an equal-sized negative training set, which were randomly selected from the 83 673 IF images after filtering out positive samples. The remaining 79 IF images and equal-sized images in the negative set were used as the validation dataset. To augment the size of the training and validation datasets, each image (3, 2048, 2048) was cropped into four non-overlapping sections (3, 512, 512), which increased the number of IF images by four times. The sample sizes of the training set and validation set were 1560 (780 positive versus 780 negative samples) and 632 (316 positive versus 316 negative samples), respectively. The ImageDataGenerator module from the Keras library was applied to generate rotated and flipped images. The CNN model was trained with the cropped training sets. The Adam optimizer in the Keras library was applied to train the CNN with the default parameters and batch size equal to 64 for 50 epochs. The obtained CNN classifier was used to score the cropped IF image in the test set. For each original IF image in the validation set, the highest score of four cropped images was treated as the final score (see Supplementary Table 8 available online at https://dbpia.nl.go.kr/bib). The AUC of the obtained CNN classifier for the validation dataset was 0.72.
In the second stage, each downloaded IF image was cropped into four non-overlapping sections, and 334 692 cropped images were finally obtained. We applied the CNN classifier established in the first stage to all 334 692 cropped images, and the top 1000 scored images that did not overlap with the positive and negative sample sets were manually checked and labelled. A total of 934 manually labelled cropped images (461 positive samples and 473 negative samples) were added to the positive and negative training set of the first stage. Then, the CNN network was retrained with this extended training set, and the validation dataset was the same as in the first stage. The AUC for the test set was 0.90 in the second stage. We further set the signals from the red (microtubules) and blue (nucleus) channels to zero and used only the green (antibody) channel; the AUC for the same validation set was 0.91. The final model used in DeepPhase was the green-only model. For each IF image, the highest score of the four non-overlapping sections was taken as the final score.
Given that the test set might partially overlap with the extended training sets, we filtered the positive test set by removing 30 images from 4 overlapping proteins, and the filtered positive test set contained 177 images from 31 proteins. We randomly selected 20 000 images as negative samples in the test set, and these images were generated from proteins that were not used in the training and validation processes. Similarly, each image in the test set was cropped into four sections, and the highest score of the four sections was calculated for each image. A detailed framework for the training and test process is displayed in Supplementary Figure 2 available online at https://dbpia.nl.go.kr/bib.
Annotations of proteins in known components
To evaluate the performance of DeepPhase, we collected proteins in known components, including nucleoli, PML bodies, P-bodies and stress granules. The protein list for nucleoli was retrieved from the UniProt database [86], including 440 proteins; the protein list for the PML bodies was retrieved from the PhaSepDB database [85], including 82 proteins; the protein list for the P-body was retrieved from a single high-throughput experiment [28], including 186 proteins; and the protein list for stress granules was retrieved from a single high-throughput experiment [87], including 146 proteins.
Calculating sequence properties of candidate proteins
To characterize the sequence properties of candidate phase separation proteins, we downloaded protein sequences from Swiss-Prot database. We submitted the Ensembl gene ID provided by Human Protein Atlas database to Swiss-Prot as identifiers and retrieved 11 832 protein sequences. 6174 of 11 832 proteins were labelled as nucleic proteins based on their localization annotations in Human Protein Atlas database. CD-HIT [88] was applied to remove redundancy in these sequences. Using 40% sequence similarity as a threshold, 9224 of 11 832 proteins were remained for sequence analysis, including 1827 candidate proteins and 3799 control proteins. The analysis in Table 1 was performed on this non-redundant data set.
For each protein, the fraction of charged residues, net charge per residue, mean net charge, hydropathy, isoelectric point, kappa parameter defined by Das and Pappu and the fraction of disorder-promoting residues were calculated using LocalCIDER [89]. In the calculation of the net charge per residue, R/K/D/E/C/Y/H are all considered titratable residues using EMBOSS pKa values, and pH = 7.4 was assumed. The hydropathy of a protein was defined as the average hydropathy of each residue from a normalized Kyte–Doolittle hydrophobicity scale [90, 91]. The kappa parameter was measured by a combination of the fraction of charged residues and the linear sequence distributions of oppositely charged residues [37], and the segregation of oppositely charged residues within linear protein sequences leads to high kappa parameters. In the calculation of the kappa parameter and the fraction of charged residues, a neutral pH where only R/K/D/E are charged was assumed. Besides LocalCIDER, the isoelectric point was also calculated with ProPAS [92].
The IDR content of each protein was downloaded from the D2P2 database [9]. We predicted the IDR content of each protein by Espritz as well [10], and the final Espritz score is the average score of three models (X-Ray, DisProt and NMR). Protein aggregation was predicted by TANGO and PASTA2. In the prediction of TANGO, default parameters with pH = 7.4, ionic strength =0.05 mol l−1 and temperature = 303 K were used.
Embedding PPI network of candidate proteins into 2D space
Weighted PPIs in the human proteome were downloaded from the STRING database, and each node in the PPI network was embedded in a 128-dimensional vector using the node2vec algorithm [46]. The vectors of candidate proteins were mapped in 2D space using the t-SNE dimension reduction algorithm [47].
Mapping protein sequences to the sequence of vector embeddings that encode structural information
The amino acid sequence of each protein was mapped to a sequence of vector embeddings using a recent sequence-embedding model [54]. The model provided a trained multilayer long short-term memory (LSTM) network that mapped every amino acid of a protein into a 3705-dimensional vector. The trained weight of the model was downloaded from https://github.com/tbepler/protein-sequence-embedding-iclr2019. Since the LSTM network was constructed by incorporating information from pairwise residue contact maps within individual proteins and global structural similarity between proteins, the output vector of the last LSTM layer embeddings contained structural information. As shown in the framework (see Supplementary Figure 12 available online at https://dbpia.nl.go.kr/bib), for one protein with N amino acids, each amino acid was transferred to a 3705-dimensional vector by using the sequence embedding model, and the N vectors at each dimension were then averaged and used as the final vector embeddings. According to the above process, each protein was encoded as a 3705-dimensional vector and then clustered with an agglomerative hierarchical clustering algorithm.
To compare the correlation between PPI clusters and sequence clusters, we calculated the numbers of observed and expected common proteins. The expected number was computed as the number of common proteins in each PPI cluster times the fraction of each sequence cluster for all proteins. Finally, log10(observed/expected) values were calculated to measure the correlation in each PPI-sequence cluster pair.
Annotation of kinases and PTM sites
The human kinase–substrate interaction dataset and the human PTM site dataset were downloaded from the PhosphoSitePlus database [93], which included 10 266 kinase–substrate relationships, 237 796 phosphorylation sites, 97 933 ubiquitylation sites, 8035 sumoylation sites, 21 245 acetylation sites and 15 619 methylation sites. For each protein, the positions of PTM sites were divided by the full length and standardized into (0, 1). The fractions of each kind of PTM site per 1% sequence were calculated and are shown in Figure 4A.
We identified 2343 phase-separated candidate proteins with deep learning from immunofluorescence images and analysed their sequence properties.
Disordered and ordered candidate clusters exhibited diverse sequence, function and modification preferences.
Phase-separated kinases show a reduced requirement of substrate specificity.
Phase-separated TFs exhibit less conserved DNA-binding motifs.
Data availability
Source code and supplementary tables are available at https://github.com/cheneyyu/DeepPhase.
Author contributions
C.Y. and T.L. conceived the study. C.Y. and T.L. designed the research. C.Y. and B.S. performed the research. B.S., Q.H. and K.Y. collected and labelled the data. C.Y., B.S. and M.S. analysed the data. C.Z., Y.C. and C.W. contributed to the data analysis. C.Y., B.S. and T.L. wrote the paper with input from all other authors.
Acknowledgements
We thank Dr Michael Zhang (Tsinghua University, China), Dr Jun Qin (National Center for Protein Sciences, China) and Dr Huan Wang (Peking University, China) for helpful suggestions. We thank Dr Torsten Juelich (Peking University, China) for linguistic assistance during preparation of our manuscript.
Funding
National Key Research and Development Program of China (2018YFA0507504); National Natural Science Foundation of China (61773025).
Chunyu Yu is a PhD student in the Department of Biomedical Informatics, School of Basic Medical Sciences, Peking University Health Science Center, Beijing, China. His research interests involve bioinformatics, machine learning and radiomics.
Boyan Shen is an undergraduate student at the Department of Biomedical Informatics, School of Basic Medical Sciences, Peking University Health Science Center, Beijing, China.
Kaiqiang You is a PhD student in the Department of Biomedical Informatics, School of Basic Medical Sciences, Peking University Health Science Center, Beijing, China. His research interests involve bioinformatics, the 3D structure of genomes and liquid–liquid phase separation.
Qi Huang is an undergraduate student at Department of Biomedical Informatics, School of Basic Medical Sciences, Peking University Health Science Center, Beijing, China.
Minglei Shi is an assistant professor in the MOE Key Laboratory of Bioinformatics; Bioinformatics Division and Center for Synthetic & Systems Biology, TNLIST; School of Medicine, Tsinghua University, Beijing, China. His research interests involve the 3D structure of genomes and liquid–liquid phase separation.
Congying Wu is a professor at the Institute of Systems Biomedicine, School of Basic Medical Sciences, Peking University Health Science Center, Beijing, China. Her research interests involve the cytoskeleton and cell migration.
Yang Chen is an associate professor in the MOE Key Laboratory of Bioinformatics; Bioinformatics Division and Center for Synthetic & Systems Biology, TNLIST; School of Medicine, Tsinghua University, Beijing, China. His research interests involve the 3D structure of genomes.
Chaolin Zhang is an associate professor in the Department of Systems Biology, Department of Biochemistry and Molecular Biophysics, Center for Motor Neuron Biology and Disease, Columbia University, New York, USA. His research interests involve alternative splicing and RNA networks.
Tingting Li is an associate professor in the Department of Biomedical Informatics, School of Basic Medical Sciences, Peking University Health Science Center, Beijing 100191, China. Her research interests involve bioinformatics, machine learning, protein post-translational modification and liquid–liquid phase separation.
