


Abstract
Immune checkpoint genes (ICGs) play critical roles in circumventing self-reactivity and represent a novel target to develop treatments for cancers. However, a comprehensive analysis for the expression profile of ICGs at a pan-cancer level and their correlation with patient response to immune checkpoint blockade (ICB) based therapy is still lacking. In this study, we defined three expression patterns of ICGs using a comprehensive survey of RNA-seq data of tumor and immune cells from the functional annotation of the mammalian genome (FANTOM5) project. The correlation between the expression patterns of ICGs and patients survival and response to ICB therapy was investigated. The expression patterns of ICGs were robust across cancers, and upregulation of ICGs was positively correlated with high lymphocyte infiltration and good prognosis. Furthermore, we built a model (ICGe) to predict the response of patients to ICB therapy using five features of ICG expression. A validation scenario of six independent datasets containing data of 261 patients with CTLA-4 and PD-1 blockade immunotherapies demonstrated that ICGe achieved area under the curves of 0.64–0.82 and showed a robust performance and outperformed other mRNA-based predictors. In conclusion, this work revealed expression patterns of ICGs and underlying correlations between ICGs and response to ICB, which helps to understand the mechanisms of ICGs in ICB signal pathways and other anticancer treatments.
Introduction
Immune checkpoints are immune regulators of both stimulatory and inhibitory pathways and are important to maintain self-tolerance and regulate the type, magnitude and duration of immune responses [1]. Tumors may activate immune checkpoint pathways to prevent being recognized by the immune system and inhibit immune responses [2, 3]. Immune checkpoint blockade (ICB) therapies, which involve the use of antibodies that target different factors of immune checkpoint pathways, have become a remarkable and potential strategy for cancer immunotherapy, in which, the CTLA-4, PD-1 and PD-L1 are the most widely studied molecules [4, 5]. Therapies targeting CTLA-4 (ipilimumab) [6] and the PD-1/PD-L1 axis (pembrolizumab and nivolumab) [7, 8] have been approved for clinical use by the US Food and Drug Administration (FDA) [9]. Despite substantial advancements in cancer immunotherapy, most patients do not respond or benefit from ICB therapy. Thus, investigating biomarkers and models that can predict patient response to ICB immunotherapy could help appraise the selection of treatment strategies and develop candidate targets for ICB therapy.
Immune checkpoint genes (ICGs), such as CTLA-4 and PD-1/PD-L1, which are involved in immune co-stimulatory and inhibitory pathways, should be regarded as potential targets for ICB therapy. Recently, LAG3, TIM3 and TIGIT have been under investigation, and drugs blocking these ICGs are in clinical or preclinical developments [1, 10–13]. Furthermore, agonists of stimulatory checkpoint pathways, including TNFRSF4, TNFRSF9 and TNFRSF18, inducible ICOS, CD40, or molecules targeting tumor microenvironment (TME) components, such as IDO1, are under investigation [3]. Thus, comprehensively exploring the expression profile of ICGs could help identify candidate immune checkpoint targets.
ICB-based immunotherapies have begun to transform clinical cancer care, but only a small subset of patients exhibit clinical benefits [14]. Developing predictive biomarkers for ICB response could lead to a precision medicine approach in cancer immunotherapy, thereby benefiting patients. Recent studies have developed several biomarkers at the genomic, transcriptome signature and immunogenomic levels [15]. Previous studies have revealed that tumor mutation burden (TMB) correlates with immune response rate to inhibition of PD-1 [16, 17] and tumor aneuploidy correlates with immune evasion markers and reduced response to immunotherapy [17]. The expression levels of IFN γ and expanded immune gene signatures respond positively to the PD-1 checkpoint blockade [18]. IMPRESS [19] and TIDE [20] integrated expression features of dysfunctional T-cells and immunosuppressive cells to predict patient response to ICB therapy. In addition, a study demonstrated that high levels of exosomal PD-L1 may be associated with a weak response to anti-PD-1 therapy [21], and another study has devised an RNA-based metric of immune cytolytic activity to reflect anti-tumor immunity [22]. As ICGs are important molecules of immune checkpoint pathways, their expression profiles could be potential biomarkers to predict patient response to immunotherapy.
In this study, we comprehensively surveyed the expression profile of ICGs in The Cancer Genome Atlas (TCGA) [23] and Functional Annotation of the Mammalian Genome (FANTOM5) [24] data, and investigated their association with immune infiltration and patient survival. The expression profile of ICGs was used to develop a precise and robust model to predict patient response to ICB therapy.
Methods and materials
Curation of candidate ICGs and their expression patterns in FANTOM5 data of immune and tumor cells
This formula indicates: (1) tumor cell-dominated ICGs (TC-ICGs), whose expression levels were at least x (x = 4) times greater in tumor cells than that in immune cells, (2) immune cell-dominated ICGs (IC-ICGs), which have a similar expression pattern as TC-ICGs but in immune cells and (3) tumor and immune cell bivariate ICGs (TIC-ICGs).
We then used two single-cell datasets, which contain tumor and immune cell RNA-seq data (GSE75688 and GSE72056), to validate the expression patterns of ICGs at the single-cell level. Because of the sequencing depth and low coverage of genes in the single-cell RNA-seq data, we lowered the classification cutoff (x) to ±1.
Analyses of ICG expression and immune profiles in the TCGA data
The TCGA [23] level-3 gene expression data were used to assess the expression profiles of ICGs and their association with immune profiles (IPs). The nine IPs of TCGA samples comprised of: (1) infiltration levels of seven types of immune cells (B-cells, CD4+ T-cells, CD8+ T-cells, dendritic cells, macrophages, neutrophils and the sum of all these cell types), which were estimated using TIMER [27, 28]; (2) TMB (Supplementary Table S2); and (3) cytotoxic T lymphocyte (CTL) levels (Supplementary Table S3), which were estimated using the average expression levels of CD8A, CD8B, GZMA, GZMB and PRF1 [20].
Construction of ICG-based prediction model for response to ICB immunotherapy
Six datasets from five projects (SRP070710, SRP150548, SRP094781, SRP011540 and ERP107734) [19, 29–32] of patients receiving ICB treatments (Supplementary Table S4) were downloaded from the NCBI SRA database. FastQC v0.11.4 and flexbar v3 [33] were used for adapter removal and data quality control, respectively. The hisat2 and stringtie pipeline [34] was used to estimate the abundance of genes on the reference genome and annotation of GRCh38.
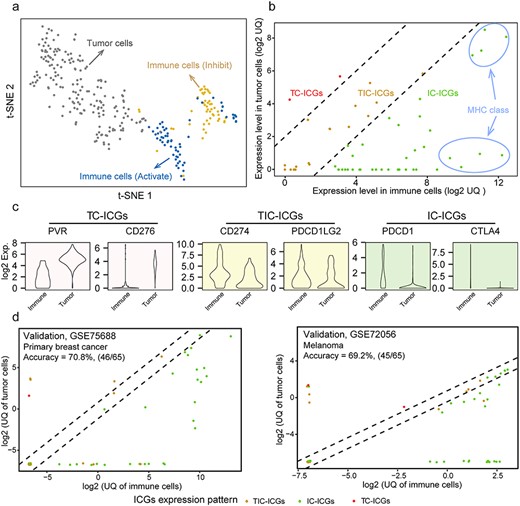
Expression patterns of ICGs. (A) The t-SNE result of classifying solid tumor cells, activated immune cells and inhibited immune cells using the expression of 68 ICGs (from FANTOM5 project). (B) Three expression patterns of ICGs in immune cells and tumor cells: TC-ICGs, IC-ICGs, immune cells dominate; TIC-ICGs, tumor and immune cells bivariate. These were classified by comparing the UQ expression of each ICG between immune and tumor cells. (C) The expression levels of six ICGs shows three expression patterns in tumor and immune cells. (D) Independent validations of ICG expression patterns using two single-cell datasets.
In total, 340 expression features of ICGs were assessed, including the GSVA score of a set of ICGs, the ratio of the expression levels of a given ICG A to another ICG B or a gene set (where ICG A and B were members of a gene set, such as a gene family or a ligand-receptor pair). Detailed processes are in the Supplementary Methods. Furthermore, we designed a ranking algorithm to assess the importance of ICG features to nine IPs in TCGA samples of 33 cancers: (1) for each IP, patients were categorized into high and low groups on the basis of the median of the IP, and the 340 features were ranked by their absolute value of the difference between the two groups. Features with the mean of ranks less than 100 in the 9 comparisons were considered candidate features in the given cancer type (CT); (2) similarly, the above procedure were implemented in the 33 CTs. Finally, 80 features, which were detected as candidate features in more than 10 CTs, were selected for a further optimization.
The hill climbing and logistic regression algorithms were applied to detect key features and build a prediction model (500 iterations of 5-fold cross-validation procedure in training data were performed). The dataset SRP094781, which contained 58 samples with anti-PD-1 on-treatment, was used as training data in this process, whereas the other data were served as validation data to assess the performance of prediction model. The prediction model was named ICGe. Detailed information of the feature selection and model optimization is provided in the Supplementary Method.
Assessment of ICGe and other published predictors in prediction of ICB response
Three published gene expression features [18, 19, 22] for the prediction of patient response to ICB immunotherapy were compared with our ICGe. These published predictors were not trained on the datasets in this study. Therefore, to fairly assess the performance of these features, we retrained these features and built models for them on each dataset by using the logistic regression method. The training process used 5-fold cross-validation with 100 repeats for each dataset. For each fold, the training (60%) and test (40%) data were randomly selected with a balanced response and non-response samples. The mean receiver operating characteristic area under the curve (AUC) of 5-fold cross-validation was used to benchmark the performance (Supplementary Table S5).
Statistical analysis
All statistical analyses were performed using R language. Non-parametric tests (Wilcoxon rank-sum test for independent groups and Wilcoxon signed-rank test for paired groups) were used to compare the median values of two sets of continuous variables. We did paired test for a comparison between tumor and normal samples from the same patient. The expression fold change between the two groups was calculated using the mean values. For non-bivariate normally distributed data, Spearman’s rho statistic was used to measure the correlation between two variables (e.g. ICG expression scores and IPs). The TCGA survival data, which contained four major clinical outcome endpoints for each CT, were collected from literature [35]. Survival curves were estimated with the Kaplan–Meier method and compared using the log-rank test, which were performed using the R package survival v3.1.8. The univariate and multivariate Cox analyses were performed to determine the independent risk characteristics. Hazard ratios (HRs) and 95% confidence intervals of these variables were estimated to quantify the strength of these associations. We performed multiple test correction using false discovery rate (FDR), and calculated FDR from P-values using the Benjamini–Hochberg procedure. And an FDR of <0.05 was considered as statistically significant, if not specified. All statistical tests were two-tailed.
Results
The expression patterns of ICGs in tumor and immune cells
From the literature review, we identified 79 ICGs (Supplementary Table S1). These ICGs are mainly involved in ligand-receptor interactions and have different effects on immune activity, including inhibition, stimulation or a combination of both. To better characterize the expression patterns of ICGs, for example, those predominantly expressed in tumor or immune cells or both, we referred to the expression profiles of 110 immune cells (12 cell types; Supplementary Table S6) and 187 tumor cells (cancer cell lines of 50 tissues; Supplementary Table S7) from FANTOM5 [36], in which 68 out of 79 ICGs have expression values (displayed in Supplementary Figure S1a). Notably, the results of t-SNE and PCA analyses demonstrated that the expression profiles of the 68 ICGs allowed for a distinction between tumor and immune cells, and immune cells of opposite functions (immune inhibition or activation) were categorized into different clusters (Figure 1A, Supplementary Figure S1a).
Subsequently, 68 ICGs were classified into three categories on the basis of their expression patterns: tumor cell dominant (TC-ICGs), immune cell dominant (IC-ICGs) and tumor and immune cell balanced (TIC-ICGs) (Figure 1B, detailed expression profiles of ICGs are presented in the Supplementary Figure S1b). The classification for 68 ICGs was consistent with the previous studies. For example, PVR and CD276, which are important immune receptors that are predominantly expressed in tumor cells, were classified as TC-ICGs (Figure 1C), and PD-L1 (a TIC-ICG), a well-known immune regulator was expressed in both tumor and immune cells [37]. Most of the 68 ICGs were predominantly expressed in immune cells, such as ICOS, CD86, CD40LG, CTLA4 and major histocompatibility complex (MHC) classes I and II gene family members (Figure 1B, Supplementary Figure S1b).
In addition, we wondered whether the expression patterns of ICGs were general. We investigated the expression levels of each ICG among different tissues and found that the expression patterns of ICGs were similar across 25 tissues (Supplementary Figure S1c). Moreover, two scRNA-seq datasets containing data of 19 patients with melanoma [38] and 11 patients with breast cancer [39] were used to measure whether the expression patterns of ICGs were consistent between the tissues and cell levels. In these two single-cell datasets, the expression of 65 out of 68 ICGs have been detected, except for ICG HLA-DRB4, KIR2DS2 and KIR2DL2. Interestingly, the expression patterns of ICGs demonstrated a modest consistency between FANTOM5 and scRNA-seq data (Figure 1D, Supplementary Figure S2), suggesting that the criteria used to classify ICGs were reasonable.
The expression profiles of ICGs and their association with clinical outcomes in TCGA cancers
We investigated the expression profiles of ICGs in 9744 tumor samples of 33 CTs from TCGA [23] and found that each ICG had a consistent tendency among different CTs (Figure 2A). ICGs from MHC classes I and II families exhibited relatively higher expression levels than the others (Supplementary Figure S3). To fairly compare the expression levels of ICGs of different groups among TCGA cancers, we excluded ICGs of MHC families to avoid potential biases. The expression levels of subgroup ICGs were significantly discrepant between tumor and normal samples in most cancers (Figure 2B), while the detailed information about the differences of ICG subgroups between tumor and normal with fold changes and their FDRs are listed in Supplementary Table S8. However, the average expression of subgroup ICGs had a similar trend among TCGA cancer cohorts, with the expression level of IC-ICGs being significantly lower than that of TC-ICGs in most cancers (Figure 2C, Supplementary Table S8; 30 out of 33 cancers; log2 fold change from −0.96 to −3.5; FDR < 0.05). The expression levels of IC-ICGs were higher than that of TC-ICGs in leukocyte-related cancers, such as lymphoid neoplasm diffuse large B-cell lymphoma, acute myeloid leukemia (LAML) and thymoma (THYM) (Figure 2C, Supplementary Table S8; log2 fold change from 0.2 to 1.7; FDR < 0.05). We explored the association of ICG expression (TC-ICGs and IC-ICGs) with TCGA patient progression-free survival (PFS) via using the HR from univariate Cox-regression (Figure 2D). Higher expression levels of IC-ICGs indicated lower death risk in more than half of the patients in TCGA cancers (HR < 1; Figure 2D, left side), whereas higher expression levels of TC-ICGs had an opposite effect (HR > 1; Figure 2D, right side).
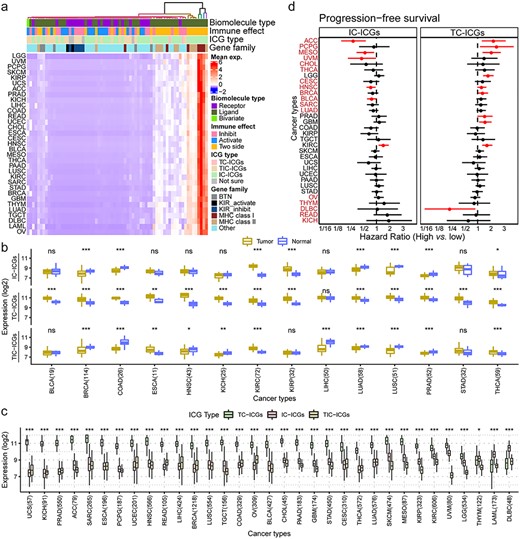
Expression profiles of ICGs in TCGA cancers. (A) Heatmap of the expression of ICGs in 33 cancers from TCGA, scaled by row. Each line is a CT and columns represent ICGs. Each cell in the heatmap represents the mean expression of the ICG in patients with a given cancer. The terms in the annotation bar above the heatmap: biomolecule type, the property of ICGs; immune effect, the effect of ICGs on immunity; ICG type: three types of ICGs as is classified in Figure 1; gene family: the gene family of ICGs. (B) Average expression of different types of ICGs between tumor and normal based on Wilcoxon signed-rank test (*FDR < 0.05, **FDR < 0.01, ***FDR < 0.001). The number behind the CTs indicates the number of paired tumor-normal samples of TCGA cancers. (C) Average expression of different types of ICGs across CTs. Asterisks show the level of significance between TC-ICGs and IC-ICGs based on the Wilcoxon rank-sum test (*FDR < 0.05, **FDR < 0.01, ***FDR < 0.001). The number behind the CTs indicates the number of tumor samples of TCGA cancers. (d) PFS survival difference between high- and low-expression groups of IC-ICGs and TC-ICGs by calculating HR through Cox regression analysis. High and low expression was defined by the median of average expression calculated in (B). Red line indicates a P-value <0.1. Red cancer names indicate cancers in which IC-ICGs and TC-ICGs demonstrated opposite trends in PFS.
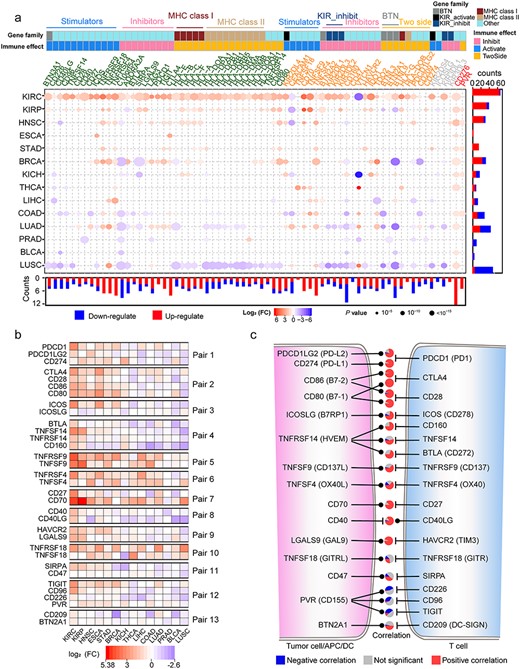
Differential expression of ICGs and their internal correlation. (A) Differential expression of ICGs constructed by the Wilcoxon signed-rank test in 14 TCGA cancers with tumor-normal paired samples, filtered by FC (>1.5) and FDR (<0.05). The color of the gene symbol of ICGs indicates their expression patterns: TCICGs (red), TIC-ICGs (yellow) and IC-ICGs (green). The color bars on the gene symbol represent the functional classes (gene families or immune effects) of ICGs. The annotation bar on the bottom and right side of the dot plot represents the statistics of DE ICGs. The color and size of the points indicate the DE trend (red: upregulated; blue: downregulated) and FDR significance, respectively. (B) DE profiles of ICGs from 13 ligand-receptor pairs. (C) The relationship between ligand and receptor of ICGs and Spearman’s correlation between the expression level of the ligand-receptor pairs in all CTs, statistically displayed in a pie plot. An FDR < 0.05 was considered as statistical significance. The Pie between each ligand-receptor pair indicates the correlation relationship between corresponding pairs in 33 CTs from TCGA.
We also performed the differentially expressed (DE) analyses of ICGs between tumor and paired normal [tumor adjacent (TA) normal tissue] samples for 14 cancers of TCGA (Supplementary Table S9). We found that DE ICGs had strong cancer-specific characteristics (Figure 3A). The detailed information about the differences of ICGs between tumor and normal with fold changes and their FDRs are listed in Supplementary Table S8. Most ICGs were upregulated in the nidus as compared with the adjacent samples in kidney renal clear (KIRC) cell carcinoma, kidney renal papillary (KIRP) cell carcinoma and head and neck squamous cell (HNSC) carcinoma. These findings suggest that the patients with these cancers may be in ‘immune-hot’ conditions and could be suitable for immunotherapy [40]. ICGs were mainly downregulated in the same comparisons of lung squamous cell (LUSC) carcinoma and lung adenocarcinoma (LUAD), except for TC-ICGs, suggesting the ‘immune-desert’ status in the nidus [41]. Although the KIRC, KIRP and kidney chromophobe (KICH) are kidney cancers, the DE ICGs in KICH were remarkably different from the other two. Notably, TC-ICGs CD276 and PVR were upregulated in most CTs, suggesting that these two genes could be candidate targets for immunotherapy. In addition, we observed that ICGs from ligand-receptor pairs showed similar DE profiles across different cancers (Figure 3B). The expression levels of most ligands displayed a significantly positive correlation with their receptors in more than 50% cancers (Figure 3C, Supplementary Figure S4), except for PVR, CD47 and TNFSF18, whose expression levels exhibited a negative or no correlation with their receptors in most TCGA cancers. The detailed information of correlations between ligands and receptors are displayed in Supplementary Table S10. Therefore, similar expression profiles of ICGs from ligand-receptor pairs reflect the functional coordination of different immune checkpoint pathways and the drug indication of these pathways.
Upregulated ICGs positively correlate with high immune infiltration and good prognosis
Furthermore, we explored the association of the expression levels and DE profiles of ICGs with the abundance of infiltrating lymphocytes in cancers. TIMER [27, 28] was employed to investigate the abundance of six types of immune cells (B-cells, CD4+ T-cells, CD8+ T-cells, dendritic cells, macrophages and neutrophils). Interestingly, LUSC, KICH and colon adenocarcinoma (COAD) had higher lymphocytes infiltrating level in normal tissue than in nidus (these cancers are all immune-excluded cancers [42]) (Figure 4A, Supplementary Figure S5a), whereas opposite phenomena were observed in KIRC, HNSC and KIRP (Figure 4A, Supplementary Figure S5a). The infiltrating level of each immune cell showed a similar tendency (Figure 4B). This result was consistent with a study reported that COAD had higher immune infiltration outside rather than tumor core region [42]. Remarkably, we found that the percentage of upregulated ICGs (named ICG-score, Supplementary Table S11) was significantly positively correlated with the high levels of infiltrating lymphocytes in the tumor nidus of TCGA cancers (Figure 4C, Supplementary Figure S5b; Spearman’s correlation from 0.41 to 0.77, FDR < 0.0001). We noticed that the ICGs did not overlap with the markers of TIMER, suggesting that the positive correlation between upregulated ICGs and high levels of infiltrating lymphocytes predicted by TIMER was not a bias caused by marker gene overlapping (Venn diagram in Figure 4C). According to immune status of the nidus and the adjacent tissue, tumors can be categorized into immune-hot (with pronounced immune infiltrates inside the tumor regardless of the outside of the tumor), immune-cold (low density inside and outside tumor region) and immune-excluded (high density outside with a low density inside tumor region) groups [42]. In our analysis, we classified TCGA participants (with paired tumor and normal sample) into immune-hot, immune-cold and immune-excluded, detailed information are presented in Supplementary Table S12. According to the composition of participants of each CT (Supplementary Methods), KIRC, HNSC, KIRP, liver hepatocellular carcinoma (LIHC), thyroid carcinoma (THCA), stomach adenocarcinoma and esophageal carcinoma were immune-hot tumors, whereas KICH, LUSC, COAD and uterine corpus endometrial carcinoma were immune-excluded tumors (Figure 4D, Supplementary Figure S6a). The immune-hot tumors had significantly higher levels of upregulated ICGs compared with the other two (FDR < 0.0001; Supplementary Figure S6b). In principle, higher levels of infiltrating lymphocytes in the nidus could help eliminate tumor cells, resulting in a better prognosis. Thus, we investigated the association of the discrepancy of infiltrating lymphocytes (tumor versus normal) with patient PFS. We found that higher levels of infiltrating lymphocytes in the tumor indicated better prognosis in breast invasive carcinoma (BRCA), KIRC and LUAD (Figure 4E).
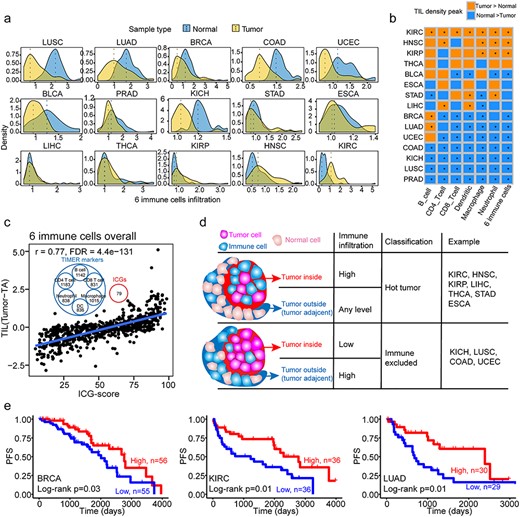
Immune infiltration profiles of tumors as compared with TA tissues, and their association with upregulated ICGs and survival. (A) Density plot of infiltration of six immune cell types (the sum of six immune cells, including B cell, CD4+ T cell, CD8+ T cell, dendritic cell, macrophage and neutrophil cell) in tumor (yellow) and TA tissue (blue). The dashed lines indicate the peak value of the corresponding distribution. (B) Comparison of the density peak of each of the six immune cell types in each CT. The Wilcoxon signed-rank test was used to test the significance between tumor and TA immune infiltration. * indicates the FDR < 0.05, whereas the cell color represents the relationship of the density of distribution of immune infiltration between the tumor and TA group. (C) Spearman’s correlation between the TIL difference (tumor TIL–TA TIL) and upregulated ICGs in paired tumor–TA samples. The Venn diagram in the upper middle part of the figure demonstrates that ICGs are not markers of TIMER to estimate immune cell infiltration. (D) The patterns of immune infiltration in tumor and TA samples and their association with immune hot and immune-excluded tumors. The TCGA CTs are classified into two patterns, which have different immune infiltration status. (E) The difference of PFS between groups with high and low levels of immune cell infiltration.
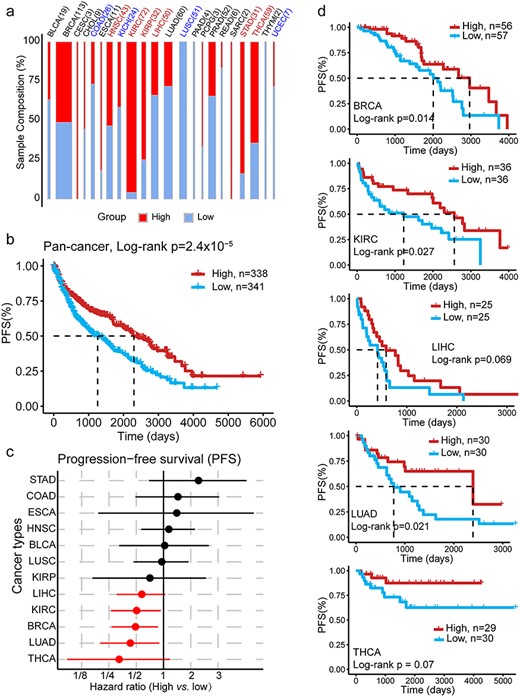
The percentage of upregulated ICGs is a good prognostic predictor for cancers. (A) The distribution of immune-high and -low groups (defined by the median of the percentage of upregulated ICGs) in each CT. The colors indicate the immune classification for tumors estimated in Supplementary Figure S6: red (blue) indicates the immune hot (excluded) tumor. The width of each bar indicates the sample size. (B) PFS difference between high and low groups as defined in (A), with all cancer tumor samples (with paired TA) together. The P-value was calculated using the log-rank test (univariable survival analysis, P-value = 2.4 × 10⁻⁵) and Cox regression with CTs as the covariate (multivariable survival analysis, P-value = 0.0054). (C) Cancer-specific HR of PFS between immune-high and -low groups as defined in (A). The red dot indicates a P-value of <0.1. (D) PFS survival curve in cancers with a P-value of <0.1.
Next, we employed the ICG-score to redefine the immune status of a tumor. A tumor sample with an ICG-score greater than the median of that in the CT was considered as having high immune activity. Tumor samples with other scores were considered having low immune activity, and the distribution of these scores were assessed in TCGA cancers (Figure 5A). Notably, the ICG-score served as a valuable and independent prognostic predictor in 22 TCGA cancers, a high ICG-score predicted good PFS and OS (Figure 5B, Supplementary Figure S7), especially for BRCA, KIRC, LIHC, LUAD and THCA (HR < 1; P-value <0.1; Figure 5C and D). These results demonstrated that the ICG-score could serve as a good marker to investigate immune activity in cancers and act as a good prognosis indicator for patient survival, suggesting its potential roles in immunotherapy.
An ICG expression-based model predicts patient response to immunotherapy with CTLA-4 and PD-1 blockade
Previous studies demonstrated that the levels of TILs were always associated with ICB response [43, 44]. Considering that ICGs appeared to be a valuable prognosis indicator for patient survival as TILs (Figure 5), we examined the power of ICGs on the prediction of response to immunotherapy. First, we generated 340 features containing various combinations of expression profiles of ICGs (Supplementary Table S13, Methods and Supplementary Methods). Subsequently, we evaluated the importance of features by using a ranking algorithm, which quantified the difference of ICG features between high and low levels of nine IPs (B-cell, CD4+ T-cell, CD8+ T-cell, dendritic cell, macrophage, neutrophil, TIL, TMB and CTL) in TCGA 33 cancers (Figure 6A, Supplementary Figure S8a, and Methods). Finally, five features were selected to build a logistic regression model (named ICGe) to predict patients’ response to ICB immunotherapy.
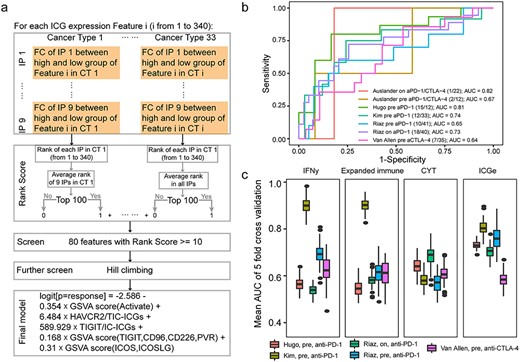
The procedures of ICG feature selection and the performance of ICGe model for the prediction of ICB response. (A) Ranking algorithms for ICG feature selection in 33 TCGA CTs. ICG features consistently associated with nine IP scores in more than 10 CTs were selected as candidate features. Further screening using the hill climbing algorithm was performed to build a prediction model containing five features, the GSVA score of activated ICGs and Pair 13 (CD209, BTN2A1) and Pair 3 (ICOS, ICOSLG) and the expression fraction of HAVCR2 against TIC-ICGs and TIGIT against IC-ICGs. (B) The performance of the ICGe model on validation datasets. Legends show the basic information of each dataset, n/m indicates the response number/non-response number of each dataset. (C) A comparison of ICGe with other published methods using the mean AUC, which is defined by the average AUC of 5-fold cross-validation and 100 repetitions. Each fold randomly selected 60% samples as the training set to train the model. The remaining samples were used as a test dataset to assess the AUC. ICGe was not trained further.
We then assessed the performance of our ICGe model by predicting the response of patients with gastric cancer and melanoma to ICB treatment, without any further training. ICGe achieved AUCs from 0.64 to 0.82 on a scenario of six ICB datasets from five independent studies (Figure 6B), containing RNA-Seq data of patients with anti-PD1 or anti-CTLA4 or a combination of the both treatments (Supplementary Table S4) [19, 29–32]. Furthermore, we benchmarked the performance of ICGe with other published mRNA expression-based predictors of ICB response (Methods, Supplementary Figure S8b). The overall performance of the ICGe model was more robust and accurate than other predictors (Figure 6C). Meanwhile, features of the ICGe model [GSVA score of activated ICGs and Pair 13 (CD209, BTN2A1) and Pair 3 (ICOS, ICOSLG), expression fraction of HAVCR2 against TIC-ICGs and TIGIT against IC-ICGs], could be interpretable in biological meanings. Higher expression of activated ICGs indicated better response of patients to ICB immunotherapy, and perhaps better-activated immunity in ICB response samples. In addition, a higher expression score of ligand-receptor pair 3 (ICOSLG, ICOS) and pair 13 (TIGIT, CD96, CD226, PVR) was associated with a better response of the patient to ICB therapy. However, high expression levels of the inhibitory receptor HAVCR2 against TIC-ICGs may indicate the potential regulatory role of HAVCR2 in ICB therapy response. This finding is consistent with the previous study that immunosuppressive molecules are upregulated in response to ICB therapy [45].
Discussion
Cancer immunotherapy employs artificial stimulation of the immune system to treat neoplasms by leveraging the cytotoxic potential of immune cells [46, 47]. ICB-based immunotherapy has been approved by the FDA for treating a broad range of cancers [48]. However, only a small subset of patients have a positive response to ICB, and biomarkers or models to predict ICB response are insufficient. This highlights the need for more effective biomarkers and novel approaches. In this study, we defined the distinct expression patterns of ICGs in tumor and immune cells by using comprehensive pan-tissue and pan-cancer surveys of RNA-seq data from TCGA and FANTOM5, and investigated the correlations between expression patterns of ICGs and the IP and patient survivals in pan-cancer.
Most expression data employed the bulk tissue sequencing strategy, in which the sequencing sample was a mixture of tumor, immune, stromal and other cells. Thus, scrutinizing the contribution of gene expression of each cell type will assist in the determination of the composition of cell populations. The expression pattern of ICGs highlights the importance of identifying differences of gene expression between different cell types in the context of bulk tissue sequencing, and provides new insights into gene expression analysis in bulk tumor tissues, especially for tumor and immune cells and their interactions. Considering that the cell composition of bulk tumor tissue varied greatly as well as the contribution of any cell type to the expression of a given gene [49], the three expression patterns of ICGs presented here may be a preliminary characterization of real conditions. However, this characterization meets the research goals of the present study. Our method had a validation accuracy of 70% on single-cell sequencing data. This may be because of several factors, such as the composition of sequenced immune cells and the low gene coverage in the scRNA-seq data. The three expression patterns of ICGs were identified from the comparison of immune cell group (12 immune cell types) versus tumor (Supplementary Table S7), whereas the validation scenario of scRNA-seq data comprised of only two types of immune cells (T- and B-cells). In addition, the throughput and coverage of scRNA-seq were much less than bulk sequencing strategy, resulting in a reduced detection power (about 2000 genes in one cell) and generally low gene expression.
Our findings suggest that the expression profile of ICGs is associated with the infiltration level of immune cells and ICGs do not overlap with the signatures of TIMER, indicating that ICGs are valuable markers for the estimation of the abundance of immune cells in bulk sequencing data [50]. Moreover, the expression levels of ICGs may reflect the status of tumor immunity [42] and perform as a prognostic predictor in cancers (Figure 5). Different cancers have distinct immune infiltration status and the composition of the TME is determined by the occupation of tumor within tissues [41, 51], suggesting the diverse response of patients with different cancers to ICB therapies. Lung tumors have been reported to be more resistant to immunotherapy than the same tumor cell line growing in the breast [51]. This supports our findings that LUSC exhibited an immune-excluded cancer, in which immune cells are less infiltrated into the nidus. Considering that different tissues harbor different amounts of immune cells, the threshold used for characterizing activation of immune cell and ICGs may be distinct among tumors [52].
Our results also demonstrated that the expression of ICGs could influence cancer prognosis and ICB response. The expression features of ICGs which had the highest correlation with the IP (represented by immune cell infiltration, TMB and CTL) were used to build a prediction model for ICB response (Figure 6A). The selection of the features and model construction integrated biological factors with machine learning algorithms. The proposed model ICGe contains logistic regression algorithm and only five features, which makes it algorithmically simple, more robust and less prone to be overfitting (Figure 6B and C). Our ICGe performed well when compared with other published expression-based ICB response predictors on the benchmark of six independent validation datasets, including pre- or on-treatment anti-PD-1 or anti-CTLA4 data. Although the accuracy of ICGe showed a slight decrease in anti-CTLA4 data, one possible reason is that the features of ICGe were from anti-PD-1 data. In this manner, the performance of ICGe can be improved when more relevant data become available.
Investigation of biological mechanisms and functions of gene sets involved in specific pathways is an effective approach in cancer research [53–56]. Our work on ICGs comprehensively investigated the expression profile of ICGs and provided new insights into the underlying biological mechanisms and functions of these ICGs. This helps to fill the knowledge gap between ICGs and the response to ICB. Our findings enhance the understanding of co-stimulatory and co-inhibitory mechanisms of ICB signals. Such understanding is essential for better design and application of immunotherapies. Prediction biomarkers and models may serve as additional indications for ICB treatment, other immunotherapies and anticancer strategies. As multi-omics data become increasingly available for cancer analysis, prospective studies are needed to investigate the genomic and epigenetic changes of ICGs in ICB response and to better understand the mechanisms of ICGs in ICB signaling pathways.
Characterize the expression patterns of ICGs on tumor and immune cells.
The expression levels of ICGs positively correlate with immune cell infiltration in tumors.
The percentage of upregulated ICGs defines the degree of immune hot tumors and promotes better clinical outcome.
ICGe, a model using the expression of ICGs for predicting response to ICB, outperforms other expression-based predictors.
Acknowledgements
We thank the referees for their valuable suggestions. Thank for Prof. Ruibin Xi of Peking University for his advice in statistics. The results reported here are upon data of FANTOM5 and TCGA projects, and datasets of single cell RNA-seq and immunotherapy. We thank all the participators and providers of these resources.
Funding
This work was supported by the National Key Research and Development Program of China (2017YFA0700403), National Natural Science Foundation of China (Nos. 31822030, 31801113 and 31771458), China Postdoctoral Science Foundation (Nos. 2019M652623, 2018M632830 and 2019T120664).
Fei-Fei Hu current is a lecturer at Wuhan University of Science and Technology, previously is a PhD candidate at Huazhong University of Science and Technology. Her research interests include cancer multi-omics data analysis and immunology.
Chun-Jie Liu is a post doctor at Huazhong University of Science and Technology. His research interests include tumor immunology and transcriptional regulation.
Lan-Lan Liu is a MS student at Huazhong University of Science and Technology. Her research interest includes immunotherapy response.
Qiong Zhang is a post doctor at Huazhong University of Science and Technology. His research interests include cancer research and tool development for muli-omics data.
An-Yuan Guo is a professor at Huazhong University of Science and Technology. His research interests include cancer research, immunotherapy, tumor immunology and transcriptional regulation.
Reference
Author notes
Fei-Fei Hu and Chun-Jie Liu contributed equally to this work.
