


Abstract
RNA-sequencing enables accurate and low-cost transcriptome-wide detection. However, expression estimates vary as reference genomes and gene annotations are updated, confounding existing expression-based prognostic signatures. Herein, prognostic 9-gene pair signature (GPS) was applied to 197 patients with stage I lung adenocarcinoma derived from previous and latest data from The Cancer Genome Atlas (TCGA) processed with different reference genomes and annotations. For 9-GPS, 6.6% of patients exhibited discordant risk classifications between the two TCGA versions. Similar results were observed for other prognostic signatures, including IRGPI, 15-gene and ORACLE. We found that conflicting annotations for gene length and overlap were the major cause of their discordant risk classification. Therefore, we constructed a prognostic 40-GPS based on stable genes across GENCODE v20-v30 and validated it using public data of 471 stage I samples (log-rank P < 0.0010). Risk classification was still stable in RNA-sequencing data processed with the newest GENCODE v32 versus GENCODE v20–v30. Specifically, 40-GPS could predict survival for 30 stage I samples with formalin-fixed paraffin-embedded tissues (log-rank P = 0.0177). In conclusion, this method overcomes the vulnerability of existing prognostic signatures due to reference genome and annotation updates. 40-GPS may offer individualized clinical applications due to its prognostic accuracy and classification stability.
Introduction
Advanced transcriptomics has been applied in a wide range of biological and clinical research [1], resulting in the emergence of state-of-the-art transcriptome sequencing (RNA-sequencing) technologies with increased throughput, higher accuracy and lower costs. Current RNA-sequencing approaches utilize shotgun sequencing technology [2], in which RNA strands, thousands of bases long, are broken into millions of short reads. To estimate gene expression, it is crucial to accurately align these reads to their genomic origins, which requires reference genomes and annotations. With improvements in sequencing technology and bioinformatics tools, reference genomes and annotations are continually updated [3, 4], which may result in noticeable changes in gene expression estimates.
The Genome Reference Consortium (GRC) released human reference genome version GRCh37 (referred to as HG19) in 2009 and the most recent version, GRCh38 (HG38), in 2013. However, HG19 continues to be widely used due to an initial lack of annotation tools for HG38 and resistance to altering existing working pipelines [5, 6]. Utilization of different human genome references may result in varying estimations of gene expression for the same RNA-sequencing data. Additionally, reference annotation databases, such as GENCODE [4], UCSC Known Genes [7] and RefSeq Gene [8], which provide human gene definitions, can also influence gene expression estimates [9, 10]. GENCODE contains more exons and greater genomic representation than other databases and is currently used by large international consortia, such as ENCODE [11], The Cancer Genome Atlas (TCGA) and the 1000 Genomes Project [12]. However, even the well-accepted annotation database GENCODE is in a constant state of flux, with gene length and gene overlap being modified with each update. Differences in gene definitions can affect differential expression analysis [9]; however, the effect of these differences on prognostic signatures is unclear.
Lung adenocarcinoma (LUAD) is the most common type of non-small cell lung cancer and exhibits the highest mortality rate [13]. Even at stage I, 35–50% of patients exhibit cancer recurrence or die within 5 years of surgical intervention [14]. Additionally, whether chemotherapy after surgery is effective for patients in stage IB is largely unknown [15]. Despite recent improvements in prognostic signatures for early stage LUAD [16], no signature has been successfully adopted in routine clinical practice [17]. Traditional approaches for developing quantitative signatures use absolute measurements of gene expression, which require normalization to adjust for batch effects [18]. For example, 15-gene [19] uses Z-score normalization, and ORACLE [20] uses variance-stabilizing transformation normalization. This is a major challenge due to the biological artefacts and technical biases that occur in measurement platforms [18]. Additionally, gene expression measurements are greatly affected by partial RNA degradation during formalin-fixed paraffin-embedded (FFPE) tissue preparation [21], which is a practical material used in clinical applications yet introduces further uncertainty in patient risk classification. Alternatively, methods based on within-sample relative expression orderings (REOs) to develop gene pair signatures (GPS) eliminate the need for data normalization and are robust following FFPE preparation [22, 23] and thus may have a competitive edge in deriving stable signatures [24]. These types of qualitative signatures include 9-GPS (consisting of nine gene pairs) developed by our laboratory [25] and the immune-related gene pairs index (IRGPI) [26].
In this study, we examined how reference genome and annotation updates impact expression-based prognostic signatures using LUAD as a representative condition. We reverified the prognostic performance of 9-GPS in patients with stage I LUAD with the latest TCGA RNA-sequencing data, which was reprocessed based on the latest reference genome, HG38, and GENCODE version 22. Remarkably, the risk classifications of some samples were altered when using the latest TCGA data. Similar phenomena were observed for other signatures, which would confound their applications in clinical settings. Using three RNA-sequencing datasets, we found that gene annotation updates profoundly affected prognostic signatures. To address this issue, we developed an REO-based qualitative signature for resected stage I LUAD, which exhibited good prognostic performance and improved risk classification stability.
Materials and methods
Data sources
Twelve publicly available gene expression datasets from LUAD tissues (Table 1) were collected from TCGA (http://cancergenome.nih.gov/) and the Gene Expression Omnibus (GEO, http://www.ncbi.nlm.nih.gov/geo/). Data from 197 stage I samples in TCGA were used to demonstrate the contradictory classification that occurs when prognostic signatures are applied to RNA-sequencing data processed by different reference genomes and gene annotations. RNA-sequencing data from 138 samples, integrated by three RNA-sequencing datasets (GSE87340, GSE103584 and GSE81089) with raw data, were used to reveal the impact of reference genomes and gene annotations on existing prognostic signatures for risk classification.
The datasets of lung adenocarcinoma used in this study
| Data source | Platform | Sample count | |
|---|---|---|---|
| Training set | TCGA (previous) | Illumina HiSeq 2000 | 264 |
| TCGA (latest) | Illumina HiSeq 2000 | 264 | |
| Test 1 | GSE30219 | Affymetrix Plus 2.0 | 79 |
| GSE42127 | Illumina WG-6V3.0 | 114 | |
| GSE87340 | Illumina HiSeq 2000 | 27 | |
| GSE103584 | Illumina HiSeq 2500 | 49 | |
| GSE81089 | Illumina HiSeq 2500 | 62 | |
| Test 2 | GSE31210 | Affymetrix Plus 2.0 | 162 |
| GSE50081 | Affymetrix Plus 2.0 | 92 | |
| GSE37745 | Affymetrix Plus 2.0 | 31 | |
| GSE31546 | Affymetrix Plus 2.0 | 13 | |
| GSE29013 | Affymetrix Plus 2.0 | 7 | |
| GSE29016 | Illumina HT-12 v3.0 | 28 | |
| Test 3 | FFPEa | Illumina HiSeq X | 30 |
aRNA-sequencing data for FFPE specimens generated in this study.
The training set for extracting a stable qualitative signature was integrated from three datasets (the latest TCGA, GSE30219 and GSE42127) generated by RNA-sequencing and microarray platforms. This included data from 457 patients with stage I–IIIA disease to capture a broad range of progression-related factors. The above-integrated RNA-sequencing data (test 1) included 138 samples and the microarray data (test 2) included 333 stage I samples that had been integrated by six datasets (GSE31210, GSE50081, GSE37745, GSE31546, GSE29013 and GSE29016), which were used to test the signature’s performance. The 928 patients used for survival analysis were treated with curative surgery resection alone. The clinical characteristics of the 12 datasets are displayed in Table S1 (Supplementary File 1).
Data preprocessing
TCGA RNA-sequencing data were processed by two versions of reference genomes and gene annotations. For HG19, raw count values were downloaded from GDC legacy archive (https://portal.gdc.cancer.gov/legacy-archive/search/f), processed by the fragments per kilobase of exon per million fragments mapped (FPKM) method [27] and are referred to herein as the previous TCGA data. For HG38, the FPKM normalized values were downloaded from the GDC data portal (https://portal.gdc.cancer.gov/) and are referred to herein as the latest TCGA data.
For the three GEO RNA-sequencing datasets, we downloaded raw data in fastq format from the Sequence Read Archive (https://www.ncbi.nlm.nih.gov/sra) and processed the data using a typical pipeline including quality control, read mapping and quantification (Supplementary File 2: Supplementary method). Using this pipeline, we first quantified gene expression levels guided by two reference genomes, HG19 and HG38, which were downloaded from the University of California, Santa Cruz’s genome browser (http://hgdownload.soe.ucsc.edu/downloads.html#human). Next, using HG38 as the reference genome, we generated 11 gene expression profiles guided by 11 gene annotations (GENCODE v20-v30) obtained from GENCODE (https://www.gencodegenes.org/). The gene expression profiles guided by the latest annotation (GENCODE v32), which is an independent reference annotation for our signature, were used to test the prognostic performance of the developed signature. The gene expression profiles guided by GENCODE v20-v32 were used to test the stability of the developed signature. The GENCODE annotation, in ‘gene transfer format’, was parsed using the Iranges, GenomicRanges and GenomicFeatures packages (version 2.16.0, 1.34.0, and 1.34.7, respectively) developed by Michael et al. [28] to obtain the gene length and gene overlap for each gene.
For microarray data generated by the Affymetrix platform, the Robust Multi-array Average algorithm [29] was used to preprocess the raw data. For data generated by the Illumina platforms, originally processed data (series matrix files) were used. For each sample, the expression of all probes corresponding to the same gene were averaged to obtain a single expression value. Probes that did not match any gene or matched multiple genes were deleted. Entrez gene IDs were mapped to Ensemble gene IDs (ENSG).
Tissue samples, RNA extraction and sequencing
FFPE tissues were obtained from 76 patients with stage I LUAD who underwent surgical resection at the Harbin Medical University Cancer Hospital. Total RNA was extracted using an RNeasy FFPE Kit (Cat#73504, QIAamp, Qiagen, Hilden, Germany) according to the manufacture’s protocol. The purity and concentration of total RNA were determined with a Nano Drop One spectrophotometer (Nanodrop Technologies, Wilmington, DE, USA) according to the OD260/280 reading and a Qubit 3.0 fluorescence quantifier (Thermo Fisher Scientific, Waltham, MA, USA), respectively. An Agilent 4200 bioanalyzer (Santa Clara, CA, USA) was used to assess the RNA integrity number (RIN). Among the 76 collected FFPE tissues with an RIN of 1–3.4, an RNA-sequencing library was constructed for the 30 samples with RIN > 2 using the NEBNext ULtra Directional RNA Library Prep Kit (New England Biolabs, Ipswich, MA, USA). Paired-end sequencing with a read length of 150 bp was conducted using the Illumina HiSeq X platform (San Diego, CA, USA). These 30 FFPE samples were used in test 3 and their clinical characteristics are shown in Table S1 (Supplementary File 1).
Risk classification of existing prognostic signatures
We collected four published prognostic signatures for analyses. The model coefficients and risk cut-offs for each signature were obtained from the original literature [19, 20, 25, 26, 30].
For 9-GPS, risk classification of samples was performed by a straightforward voting scheme [25]. Briefly, for each of the nine gene pairs, Ga and Gb, a risk score of 1 (high risk) was assigned if Ea > Eb, where Ea and Eb represent the expression levels of Ga and Gb, respectively; otherwise, the risk score was 0 (low risk). The risk score of a tumour sample was calculated as the sum of all gene pair risk scores. Here, we adopted the previously proposed strict voting rule for low-risk identification (7/9-GPS) [30]: if ≥7 gene pairs were low risk, that is, if the sample’s risk score <3, the sample was placed in the low-risk group; otherwise, the sample was placed in the high-risk group.
For IRGPI [26], an IRGP score of 1 was assigned if IRGa < IRGb; otherwise, the IRGP score was 0. The original score for each tumour sample was calculated as the linear combination of each IRGP score. Next, the original score was transformed into risk score using exponential function. The samples were placed in the high-risk group if their risk scores were higher than the risk cut-off (0.988); otherwise, the samples were placed in the low-risk group.
For 15-gene [19], FPKM values for each gene were first transformed to Z-scores by centring on a mean of 0 and scaling to a standard deviation of 1 per cohort. Next, the risk score for the sample was calculated as the weighted sum of the four principal components derived from the transformed Z-scores of the 15 genes in the training data. Using a risk cut-off (−0.1), the samples were placed in high- or low-risk groups.
For ORACLE [20], raw count values were fed into a variance-stabilizing transform function using the DESeq2 package (version 1.22.2) [31] to output normalized count values per cohort. Next, the risk score for each tumour sample was calculated as a linear combination of the normalized count values of the 23 ORACLE genes weighted by the model coefficients fitted in the training data. The samples were placed in the high- or low-risk groups based on the risk cut-off (10.19941).
Survival and differential expression analyses
The time-dependent receiver operating characteristic (ROC) curve (survivalROC, version 1.0.3) [34] at 5 years was used to determine the optimal cut-off of the signature. The nearest neighbour estimation method was used to estimate the ROC curve. The risk score of the signature corresponded to the shortest distance between the ROC curve and the point representing the 100% true-positive rate and 0% false-positive rate was used as the cut-off value.
Differential expression analysis of two conditions was performed using the EdgeR R package (1.20.0) [35]. P-values were adjusted using the Benjamini–Hochberg approach for controlling the false discovery rate (FDR) [36]. Genes with an FDR < 0.05 as determined by EdgeR were considered differentially expressed.
Development of a stable qualitative prognostic signature
We constructed a prognostic signature by focusing on stable genes extracted across 11 versions of GENCODE (v20–v30). First, we used univariate Cox analysis to select overlapped prognosis-associated genes whose expression was significantly associated with patient OS (P < 0.05) in all three datasets from the training set and excluded genes that were not stable.
Next, for a gene pair, Ga and Gb, including at least one prognosis-associated gene with expression values Ea and Eb, respectively, we used univariate Cox analysis to assess the association between its specific REO pattern (Ea > Eb or Ea < Eb) and patient OS in the training set. Gene pairs with an FDR < 0.05 were selected as candidates for building a prognostic signature and referred to as prognosis-associated gene pairs. For each prognosis-associated gene pair, patients with the specific REO pattern (e.g. Ea > Eb) were considered to be at high risk; otherwise (e.g. Ea < Eb), they were considered to be at low risk. The C-index was used to evaluate the predictive performance of each prognosis-associated gene pair.
Third, to improve the stability of risk classification, we selected prognosis-associated gene pairs with rank difference in the upper quartile. Here, the rank difference for each gene pair was calculated as the geometric mean of the absolute rank difference of the gene pair in all training samples.
Finally, for multiple gene pairs containing the same gene, the one showing the largest C-index was selected to contribute to the prognostic signature. For each gene pair in the prognostic signature, a risk score of 1 (high risk) was assigned if Ea > Eb; otherwise, the risk score was 0 (low risk). The risk score of a tumour sample was calculated as the sum of the risk scores of all gene pairs, and the risk cut-off was determined by a time-dependent ROC curve.
All statistical analyses were carried out with the R3.5.1 software package (http://www.r-project.org/). Significance was defined as P < 0.05 or FDR < 0.05 for multiple comparisons.
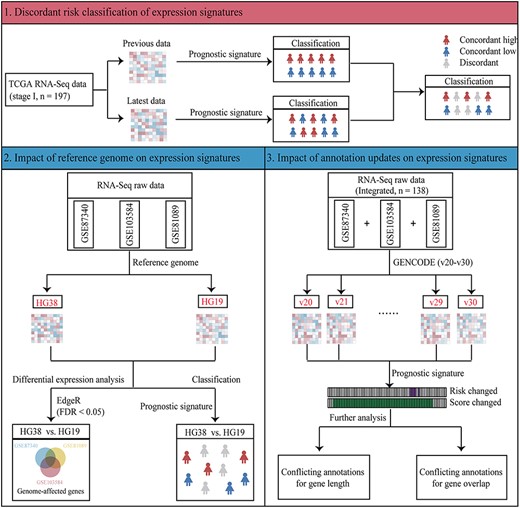
Overview of reference genome and gene annotation analyses. Firstly, we analysed the discordant risk classifications between two versions of TCGA RNA-sequencing data and found that reference genome and gene annotation alterations confound the application of expression signatures. Secondly, we analysed the impact of reference genome updates on expression signature using three RNA-sequencing datasets. Lastly, we analysed the impact of gene annotation updates on expression signature using integrated RNA-sequencing dataset.
Results
Discordant risk classification of prognostic signatures resulting from different reference genomes and annotations
Figure 1 shows the workflow of reference genome and gene annotation analyses. First, we re-evaluated the performance of 7/9-GPS in the latest TCGA data for 197 patients with stage I LUAD. Remarkably, 7/9-GPS failed to predict prognoses in the latest TCGA data (log-rank P = 0.2117, C-index = 0.55, hazard ratio (HR) = 1.68, 95% confidence intervals (CIs): 0.74–3.81, Supplementary File 3, Figure S1). Comparison of the risk classification as determined by 7/9-GPS in the latest TCGA data with that from the previous data showed that 6.6% of patients (13/197) exhibited discordant risk classification (Figure 2A). Similarly, when comparing the two TCGA versions for IRGPI (qualitative signature) and 15-gene (quantitative signature), the discordance rates were 27.9 and 6.6%, respectively (Figure 2B). ORACLE (quantitative signature), the recently reported sequencing-based signature in LUAD, placed 158 and 39 patients in the high- and low-risk groups, respectively, based on previous TCGA data but placed all patients in the high-risk group based on the latest TCGA data (Figure 2B).
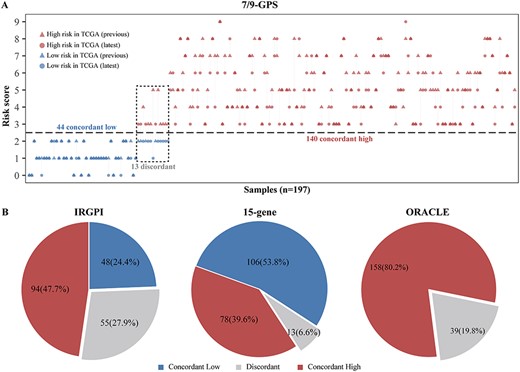
TCGA RNA-sequencing data based on different genomes and annotations confound prognostic signatures of lung adenocarcinoma. (A) Risk classification determined by 7/9-GPS based on the previous and latest TCGA data with 197 patients with stage I LUAD. Patient’s risk scores are represented by triangles (based on the previous TCGA data) and circles (based on the latest TCGA data) and colour-coded according to risk classification (red = high risk; and blue = low risk). Patients whose risk classifications were discordant between the two versions of TCGA are enclosed by a black dotted box. (B) Percentage of patients enrolled in TCGA (n = 197 patients with stage I LUAD) who were classified as concordant low-risk (blue), concordant high-risk (red) or discordant (grey) using three published prognostic signatures for LUAD: the IRGPI (left), 15-gene (middle) and ORACLE (right).
Impact of reference genome updates on expression signatures
To decipher the impact of reference genome updates on gene expression signatures, we performed Pearson correlation analyses for expression profiles based on HG38 and HG19 and found that the correlation for each sample was as high as 0.95. Despite the high correlation, the values of many genes were dramatically affected by the choice of a reference genome (Figure 3A; only the samples with the lowest and highest correlations between HG38 and HG19 in GSE87340, GSE103584 and GSE81089 are shown). Then, we used EdgeR to select differentially expressed genes (DEGs) between expression profiles based on HG38 and HG19 (two groups) for GSE87340, GSE103584 and GSE81089, respectively. We found 915, 755 and 1757 DEGs for GSE87340, GSE103584 and GSE81089 (edgeR, FDR < 0.05, Figure 3B), respectively. There were 673, 826 and 702 overlapping DEGs between GSE87340 and GSE103584, GSE87340 and GSE81089 and GSE103584 and GSE81089, respectively. Of these overlapping DEGs, 99.41, 98.55 and 99.72%, respectively, showed consistently dysregulated directions in their expression profiles based on HG38 compared to those based on HG19. Given that a single dataset may only capture a portion of DEGs because of insufficient statistical power, the DEGs from three datasets were merged and defined as genome-affected genes (1873 genes). We hypothesized that genome-affected genes would lead to discordant risk classification for expression signatures when their gene expression was processed with HG19 or HG38. We applied 7/9-GPS to the gene expression profiles based on HG19 and HG38, calculated the risk score for each sample and determined its risk classification. Risk classifications of all samples, including individual risk scores, were identical for the two gene expression profiles, although one genome-affected gene (5.6%) was included in 7/9-GPS (Figure 3C). IRGPI showed no discordant risk classification despite the signature containing two genome-affected genes (5.0%) involved in two gene pairs. However, for quantitative signatures, three genome-affected genes occurred in 15-gene (20.0%) and ORACLE (13.0%), which resulted in three (2.2%) and one (0.7%) patient with discordant risk classifications, respectively.
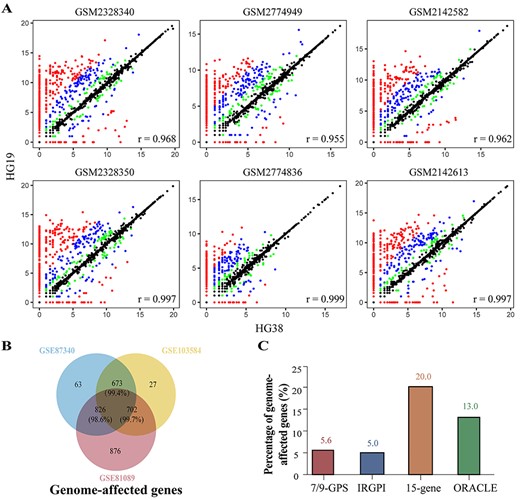
Impact of reference genome updates on expression signatures. (A) Scatter plots of samples with lowest (top) and highest (bottom) correlation for GSE87340 (left), GSE103584 (middle) and GSE81089 (right), respectively. Both the x and y-axes represent Log2 (count +1). Although the majority of genes had highly consistent or nearly identical expression levels, there were many genes whose count values were dramatically affected by the choice of a reference genome. Green, blue and red points indicate corresponding |Log2 (fold change)| values between HG38 and HG19 that were greater than 1, 2 and 5, respectively. (B) Venn diagram of DEGs between expression profiles based on HG38 and HG19 for GSE87340, GSE103584 and GSE81089. The union of three DEG lists is defined as genome-affected genes. (C) Percentage of prognostic signatures containing genome-affected genes.

Impact of gene annotation updates on 7/9-GPS. (A) Heatmap of the risk scores of 138 patients as determined by 7/9-GPS based on GENCODE v20–30. The colours represent risk scores in increments of 1, from blue = 0 to red = 8. Patients were classified as high risk for risk scores >2; otherwise, the patients were classified as low risk. Patients with discordant risk scores (green) and classifications (purple) in different GENCODE versions are marked above the heatmap. (B) Gene expression levels of ENSG00000196700 (circle) and ENSG00000198901 (triangle) for 51 patients whose REOs were reversed between the gene expression profiles guided by GENCODE v27 (blue) and GENCODE v28 (red). (C) Boxplots of the count values (left) and FPKM values (right) of ENSG00000135114 based on GENCODE v21 (purple) and GENCODE v22 (yellow). The count and FPKM values between expression based on GENCODE v21 and GENCODE v22 were compared by Student’s t-test. (D) The cumulative percentage of conflicting annotations. Green and yellow lines indicate conflicting annotations in gene length and overlap, respectively.
Impact of gene annotation updates on expression signatures
Annotation updates are of a much wider variety and are made more frequently than reference genome updates. We generated 11 gene expression profiles using 11 versions of GENCODE (v20–v30) for integrated RNA-sequencing data (see Materials and methods). To explore the correlation between expression based on different versions of GENCODE, we performed Pearson correlation analysis. We found that although high correlations were observed, the count values of many genes were remarkably affected by the choice of gene annotation (Supplementary File 3, Figure S2; only the samples with lowest and highest correlation between GENCODE v30 and v20 in GSE87340, GSE103584 and GSE81089 are shown). Next, 7/9-GPS was applied to the 11 gene expression profiles to assign the samples to high- or low-risk groups. A change in risk score was observed in 59 of 138 samples (42.8%), resulting in a change of risk classification for five patients (3.6%) (Figure 4A). Differences in gene annotations frequently lead to different estimates of gene expression [9, 10], which in turn may be responsible for the discordant risk scores and classifications. Therefore, we summarized the definitions (gene length and gene overlap) of 7/9-GPS genes in the 11 versions of GENCODE (Supplementary File 1, Table S2). There were three genes (ENSG00000118971, ENSG00000198901 and ENSG00000196700) whose gene overlap changed and five genes (ENSG00000138160, ENSG00000171877, ENSG00000135114, ENSG00000064989 and ENSG00000196700) whose gene length changed. Among these, ENSG00000198901, a gene in gene pair 9, is a striking example. It has sequence overlaps for 50 exons with other genes in GENCODE v28, but is independent in GENCODE v27. Thus, most reads uniquely mapped to ENSG00000198901 in GENCODE v27 became multi-overlap reads in GENCODE v28, making the true regions these reads originated from unable to be determined. The recommended strategy of featureCounts is to discard multi-overlap reads [37]. Therefore, the read counts of this gene decreased dramatically in GENCODE v28 compared to in GENCODE v27, leading to a sharp decrease in FPKM expression values. The other gene in gene pair 9 remained unchanged, leading to a reversed REO pattern in 51 patients (37.0%) (Figure 4B). Consequently, four of these patients switched risk classification, as the risk scores of these patients determined by 7/9-GPS now crossed the cut-off threshold.
A gene from gene pair 6, ENSG00000135114, was defined as having a length of 2336 bp in GENCODE v21 but 3517 bp in GENCODE v22, an increase of 50.56%. Theoretically, the longer the gene, the more likely it is to obtain reads [27]. However, the read counts of ENSG00000135114 were only slightly increased when the data were based on GENCODE v22 when compared to GENCODE v21 (Student’s t test, P = 0.7543, Figure 4C). As the increase in read counts was not proportional to its increase in length, its FPKM expression values in GENCODE v22 were significantly lower than those in GENCODE v21 (Student’s t test, P = 0.0003, Figure 4C). For the other gene of gene pair 6, ENSG00000064989, its length was unchanged, and there was little difference in FPKM expression values between GENCODE v21 and v22. For four patients, this caused the REO pattern of gene pair 6 (ENSG00000135114 < ENSG00000064989) in GENCODE v22 to be reversed compared to the REO (ENSG00000135114 > ENSG00000064989) in GENCODE v21, resulting in a reduction of risk score.
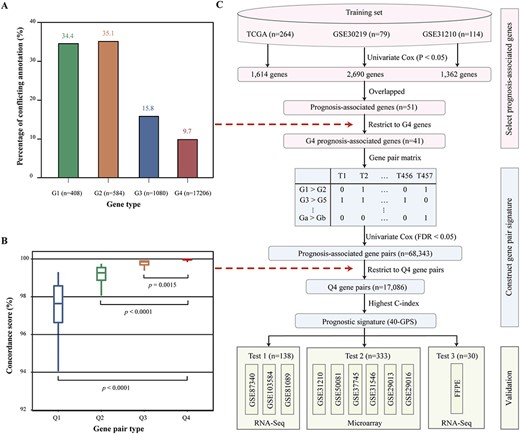
Development and validation of a stable prognostic signature. (A) Percentage of conflicting annotations for G1, G2, G3 and G4 genes. (B) Boxplots of the concordance score for Q1, Q2, Q3 and Q4 gene pairs. (C) Flowchart for developing and validating a stable prognostic signature for stage I LUAD.
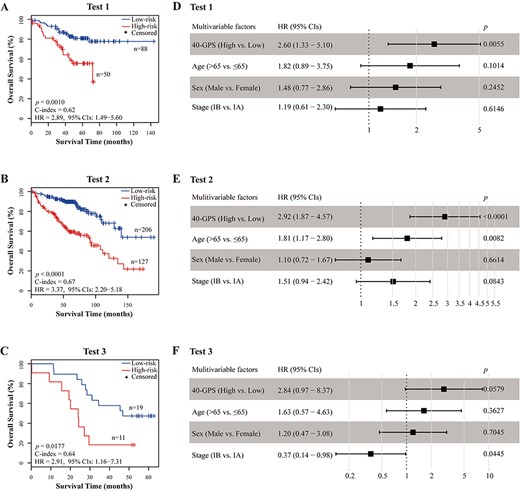
Performance of 40-GPS to predict OS in three test datasets. (A–C) Kaplan–Meier curves of OS for high-risk and low-risk patients determined by 40-GPS in tests 1, 2 and 3. (D–F) Multivariate Cox analyses of 40-GPS after adjusting for age, sex, and stage in tests 1, 2, and 3, respectively. Solid squares represent the HR of death, and the close-ended horizontal lines represent the 95% CIs. HR and 95% CIs were generated using multivariate Cox regression models.
To assess the extent of changes to definitions of gene length and overlap in the entire genome, we searched 11 versions of GENCODE. The cumulative percentage of conflicting annotations in GENCODE v20-v30 was 19.4% for gene length and 8.3% for gene overlap (Figure 4D). The large change in gene definitions may affect the application of other expression signatures, not only 7/9-GPS. Indeed, six, nine and seven patients had discordant risk classifications as determined by IRGPI, 15-gene and ORACLE, respectively.
Development of a stable prognostic signature
Based on the above results, we inferred that the gene expression signature would be improved if the influence of conflicting annotations was controlled. We suspected that well-annotated genes would be suitable for stable signature design. To explore this hypothesis, we divided the genes into four groups based on GENCODE v20–25: changes in both gene length and gene overlap (G1 = 408 genes); changes in gene overlap but not in gene length (G2 = 584 genes); changes in gene length but not in gene overlap (G3 = 1080 genes) and stable genes (G4 = 17,206 genes). When extended to GENCODE v26–30, we found 34.4, 35.1, 15.8 and 9.7% of genes with conflicting annotations for G1, G2, G3 and G4 genes, respectively (Figure 5A). Although G4 genes compared favourably to G1, G2 and G3 genes, they were still exposed to annotation instability. Therefore, we inferred that gene pairs with large rank differences would provide a more stable metric that was robust against fluctuations in gene expression values across different versions of GENCODE. To confirm this, using expression profiles based on GENCODE v20 of integrated RNA-sequencing data, we extracted 133,805,800 highly stable gene pairs, whose REO pattern was maintained in >90% of samples. The highly stable gene pairs were divided into four groups according to rank differences in gene pairs: below the lower quartile (Q1 gene pairs), between the lower quartile and median (Q2 gene pairs), between the median and upper quartile (Q3 gene pairs) and above the upper quartile (Q4 gene pairs). We also extracted highly stable gene pairs from the expression profiles based on GENCODE v21–v30. Next, we calculated the ratio of highly stable gene pairs extracted from GENCODE v20 whose REO direction was unchanged when based on GENCODE v21–v30; this ratio was termed the concordance score. The result showed that the concordance scores of Q4 gene pairs were significantly higher than those of Q1, Q2 and Q3 gene pairs (Figure 5B). These results demonstrate that Q4 gene pairs are more stable and therefore better suited for signature design. Taken together, gene pairs with large rank difference (Q4) based on genes that were stable across multiple annotations (G4) may be robust against annotation updates and informative for patient prognosis.
Figure 5C shows the procedure for developing and validating the stable prognostic signature. First, the 13,592 G4 genes detected in the latest TCGA data, GSE30219 and GSE42127, were analysed, and 1614, 2690 and 1362 genes were shown to be correlated with OS (univariate Cox model, P < 0.05), respectively. Of these genes, 51 were identified in all three datasets and selected as prognosis-associated genes. To control the influence of conflicting annotations, we selected 41 G4 prognosis-associated genes. Second, among all gene pairs consisting of at least one G4 prognosis-associated gene, we extracted 68,343 prognosis-associated gene pairs whose specific REO patterns were significantly associated with patient OS in the training set (univariate Cox model, FDR < 0.05). To improve the stability of risk classification, we selected 17,086 Q4 prognosis-associated gene pairs. For multiple gene pairs containing the same gene, the one with the largest C-index was selected. This generated a prognostic signature consisting of 40 non-redundant gene pairs, denoted 40-GPS (Supplementary File 1, Table S3). For each of the 40 gene pairs (Ga and Gb), a risk score of 1 was assigned if Ea > Eb; otherwise, the risk score was 0. For a tumour sample, the sum of the risk scores of all 40 gene pairs determined the risk score of the sample. Time-dependent ROC curve analysis determined a risk score of 17 as the optimal lower cut-off for placing samples into the high-risk group (Supplementary File 3, Figure S3). The R function for classifying 40-GPS for a cohort or an individual is available in Supplementary File 4: R function. In the training set, 40-GPS classified 149 and 200 patients with stage I disease into the high- and low-risk groups, respectively, with significantly different OS (log-rank P < 0.0001, HR = 2.63, 95% CIs = 1.75–3.95, C-index = 0.64, Supplementary File 3, Figure S4).
Survival analyses of four existing prognostic signatures in three test data sets
| Test set | Signature | Log-rank P | Cox Pa | C-indexa |
|---|---|---|---|---|
| Test 1 | 7/9-GPS | 0.0191 | 0.0225 | 0.60 |
| IRGPI | 0.4775 | 0.4790 | 0.51 | |
| 15-gene | 0.6968 | 0.6970 | 0.52 | |
| ORACLE | 0.7601 | 0.760 | 0.52 | |
| Test 2 | 7/9-GPS | <0.0001 | <0.0001 | 0.66 |
| IRGPI | <0.0001 | <0.0001 | 0.67 | |
| 15-gene | 0.0101 | 0.0111 | 0.58 | |
| ORACLE | — | — | — | |
| Test 3 | 7/9-GPS | 0.0002 | 0.0006 | 0.70 |
| IRGPI | 0.3221 | 0.3270 | 0.55 | |
| 15-gene | 0.2527 | 0.2580 | 0.58 | |
| ORACLE | — | — | — |
aCox P value and C-index were generated by the univariate Cox proportional hazards model.
Validation of 40-GPS
The prognostic performance of 40-GPS was tested in three test datasets obtained from RNA-sequencing and microarray technologies. For the RNA-sequencing data, we generated gene expression profiles using the latest gene annotation (GENCODE v32), which is an independent reference annotation for our signature. In test 1, which was integrated from three public RNA-sequencing datasets, 40-GPS placed 50 patients into the high-risk group who had an OS significantly worse than that of the 88 low-risk patients (log-rank P = 0.0010, C-index = 0.62, HR = 2.89, 95% CIs: 1.49–5.60, Figure 6A). In test 2, which was integrated from six public microarray datasets, 127 high-risk and 206 low-risk patients (as classified by 40-GPS) also showed significantly different OS (log-rank P < 0.0001, C-index = 0.67, HR = 3.37, 95% CIs: 2.20–5.18, Figure 6B). Notably, for samples with severely degraded RNA collected from the Harbin Medical University Cancer Hospital in test 3, 40-GPS still significantly stratified patients into high- and low-risk groups in terms of OS (log-rank P = 0.0177, C-index = 0.64, HR = 2.91, 95% CIs: 1.16–7.31, Figure 6C).
Multivariate Cox analyses showed that after adjusting for age, sex and stage, 40-GPS remained significantly associated with patient OS in test 1 (P = 0.0055, HR = 2.79, 95% CIs: 1.40–5.53, Figure 6D), test 2 (P < 0.0001, HR = 2.92, 95% CIs: 1.87–4.57, Figure 6E) and test 3 (P = 0.0579, HR = 2.84, 95% CIs: 0.97–8.37, Figure 6F). In addition, when further restricted to patients with stage IB LUAD, 40-GPS stratified patients into subgroups with significantly or marginally significantly different OS in 54 patients in test 1 (log-rank P = 0.0024, C-index = 0.67, HR = 4.73, 95% CIs: 1.58–14.12, Supplementary File 3, Figure S5A), 155 samples in test 2 (log-rank P < 0.0001, C-index = 0.63, HR = 3.04, 95% CIs: 1.69–5.46, Supplementary File 3, Figure S5B) and 20 samples in test 3 (log-rank P = 0.1250, C-index = 0.63, HR = 2.49, 95% CIs: 0.75–8.27, Supplementary File 3, Figure S5C).
More importantly, in tests 1 and 3, we found that all risk classifications made by 40-GPS were stable across all annotations, even when based on the latest GENCODE v32 (Supplementary File 3, Figure S6).
Comparison with other gene expression signatures
We compared 40-GPS with four published signatures: 7/9-GPS, IRGPI, 15-gene and ORACLE. The results of survival analyses are summarized in Table 2 and the Kaplan–Meier curves are shown in Supplementary File 3, Figure S7. In test 1 (RNA-sequencing data), we generated gene expression profiles based on GENCODE v32, which is an independent reference annotation for all signatures. Only 7/9-GPS could stratify patients into high- and low-risk groups with significantly different OS (log-rank P = 0.0191, C-index = 0.60, Supplementary File 3, Figure S7A); however, its performance (C-index) was inferior to that of 40-GPS (log-rank P = 0.0010, C-index = 0.62, Figure 4A). In test 2 (microarray data), all tested signatures stratified patients into high- and low-risk groups with significantly different OS except for ORACLE; however, none exceeded the performance of 40-GPS (log-rank P < 0.0001, C-index = 0.67, Figure 4B). Notably, although partial samples of test 2 were included in the training cohort of IRGPI, 40-GPS still performed equally well. In test 3 (FFPE data), only 7/9-GPS could stratify patients into high- and low-risk groups with significantly different OS (log-rank P = 0.0002, C-index = 0.70, Supplementary File 3, Figure S7I), and it performed slightly better than 40-GPS (log-rank P = 0.0177, C-index = 0.64, Figure 4C).
Discussion
Prognostic transcriptional signatures are used to identify patients at high risk of recurrence or death and thereby improve treatment precision beyond that which can be achieved based on clinical characteristics, such as stage [38, 39]. For prognostic transcriptional signatures to serve as objective indicators for guiding treatment, it is essential that they accurately characterize risk. We found that some patients were assigned discordant risk classifications when the qualitative prognostic signature 7/9-GPS was based on different versions of TCGA. This may result from differences in reference genomes and gene annotations used for quantifying RNA-sequencing data. This phenomenon was also observed for one qualitative (IRGPI) and two quantitative signatures (15-gene and ORACLE). These results demonstrate that risk scores based on existing expression signatures may be confounded by reference genome and gene annotation updates. This variation in risk classification can confuse the therapeutic regimen, thus making prognostic signatures unsuitable for clinical practice.
Although reference genome HG38 was released in 2013, HG19 remains widely used in RNA-sequencing studies [5, 6]. The difference in gene expression quantification between the two reference genomes is often overlooked, which can contribute to discordant risk classifications. Our results show that a fraction of genes is differentially expressed in HG38 relative to HG19, possibly confounding gene expression signatures. Although we found that the four prognostic signatures were not affected or affected somewhat by changes between two reference genomes, we recommend that researchers switch to HG38 for increased accuracy in signature design [40], as it is the most accurately sequenced human genome, and the next coordinate-changing update (GRCh39) was indefinitely postponed according to a GRC press release.
More importantly, gene definition (gene length and overlap) differences occur frequently when GENCODE annotations are updated [41]. These changes also lead to different gene expression estimates, confounding risk classification not only by the quantitative signatures but also by the qualitative signatures. Taken together, these results suggest that existing signatures, commonly subjected to changes in gene definition due to annotation updates, are not suitable for clinical application.
Gene annotation aims to compile a complete list of genes and their definitions [4, 42]. For many genes, however, the definition of their exact gene structure is non-trivial [43]. Additionally, gene annotation depends on proteogenomic information, and the rapidly developing field of proteogenomics means that a higher false-positive rate is inevitable, which may result in misannotations [44, 45]. Furthermore, recent investigations demonstrated extensive transcriptional overlap between genes, and identifying genuine overlaps is relatively challenging [46, 47]. Therefore, the gene-defining problem has attracted wide attention within the field of bioinformatics. A recent review of gene annotation has highlighted these issues [48]. Constant updates to annotations inevitably produce conflicting annotations and affect the application of transcriptional signatures.
To resolve this issue, we developed a qualitative prognostic signature including 40 gene pairs (40-GPS) that were stable across 11 versions of GENECODE for resected stage I LUAD. This signature was validated in three datasets across different platforms. For patients in stage IB with controversial treatment regimens [15], 40-GPS identified high-risk patients who may require further therapy. Moreover, we also applied 40-GPS to 73 normal samples, which could be regarded as ‘low-risk’ samples, derived from TCGA and GSE30219, and found that all the normal samples were classified into the low-risk group. The result indicated the good specificity of our signature for determining the low-risk patients, which could avoid the overtreatment for stage I patients. In benchmark comparisons, 40-GPS not only performed as well or better than other signatures at predicting prognosis but also exhibited concordant risk classifications across all annotations. Notably, 40-GPS accurately predicted a patient’s prognostic risk from FFPE materials. This source material historically challenges the application of transcriptional signatures because of increased RNA degradation and decreased poly(A) binding affinity [49]. Additionally, although quantitative signatures require normalization of gene expression profiles (Z-score and variance-stabilizing transformation) [19, 20], REO-based qualitative signatures only involve pairwise comparison within the gene expression profile of a sample, thus eliminating the need to collect a set of samples for data normalization [25, 26]. Thus, our prognostic signature can be robustly applied at an individualized level to predict the survival of early stage LUAD and may be readily translated into clinical practice. Notably, 40-GPS and the other published gene expression signatures considered all transcripts of a gene jointly. Currently, it is widely accepted that cancers are often caused by over- or under-expression of particular transcripts within a gene [50, 51]. Therefore, it is worth to further explore transcript-based qualitative signatures for LUAD, which would probably enhance the accuracy of patient classification.
However, despite improvements in signature design, 40-GPS may still be dynamically modified by gene annotation updates. Although an extensive effort has been made to achieve accurate structural annotation of genes, there remains a large gap in our understanding of the human genome [48]. If genes in 40-GPS are re-annotated with respect to gene length and/or gene overlap, the estimate of gene expression following RNA-sequencing may change and propagate to risk classifications made by this signature. An alternative solution in clinical application would be to quantify gene expression based on the annotation from which the signatures were defined. However, whether the best prognostic accuracy can be achieved by fixed gene annotation requires further investigation.
Our results clearly demonstrate that reference genome and gene annotation updates have a large impact on the applicability of existing expression signatures. The proposed REO-based qualitative signature, 40-GPS, largely circumvents this issue and successfully identifies high-risk patients with stage I LUAD who should be administered adjuvant therapy after surgery. This signature is also well suited for estimating prognosis from FFPE tissues, which is useful as transcriptomics of FFPE tissues become a vanguard of precision medicine. Therefore, our signature merits further validation in a prospective multi-centre clinical trial.
Availability of data and materials
The RNA-sequencing data generated from the 30 stage I samples and corresponding clinical information in this study have been deposited in the GEO and are accessible through GEO Series accession number GSE143486 (https://www.ncbi.nlm.nih.gov/geo/query/acc.cgi?acc=GSE143486).
Expression-based prognostic signatures may be inaccurate when their RNA-sequencing results are based on updated reference genomes or annotations, which may hinder their translation to clinical applications.
We advocate developing REO-based prognostic signatures for cancer patients, as REO of a gene pair is more robust than the absolute measurement of a single gene, which could largely circumvent the impact of reference genomes and annotations updates.
We identified a stable REO-based prognostic signature for OS of stage I lung adenocarcinomas, which could achieve reliable risk classification for gene expression profiles based on different annotations and have the unique advantage for individualized clinical application.
40-GPS effectively predicted survival from severely degraded clinical samples.
Acknowledgements
The authors thank Professor Zheng Guo (College of Bioinformatics Science and Technology, Harbin Medical University, Harbin, China) for supervising this work and providing significant insights.
Funding
National Natural Science Foundation of China (81872396 to L.Q., 61701143 to L.Q., 61673143 to Y.G., and 81672931 to Q.M.).
Conflict of Interest statement
The authors declare no potential conflicts of interest.
Zheyang Zhang is a postgraduate student in bioinformatics at Harbin Medical University, China. His research is focused on high-throughput omics data analysis.
Sainan Zhang is a postgraduate student in bioinformatics at Harbin Medical University, China. Her research is focused on tumour clone evolution.
Xin Li is a PhD candidate in bioinformatics at Harbin Medical University, China. Her research is focused on transcriptomics and metabolomics analysis of lung cancer.
Zhangxiang Zhao is a PhD candidate in bioinformatics at Harbin Medical University, China. His research is focused on high-throughput omics data analysis.
Changjing Chen is an undergraduate student in bioinformatics at Harbin Medical University, China. Her research is focused on high-throughput omics data analysis.
Juxuan Zhang is a postgraduate student in bioinformatics at Harbin Medical University, China. Her research is focused on identification of lung cancer subtypes.
Mengyue Li is a postgraduate student in bioinformatics at Harbin Medical University, China. Her research is focused on identification of immune cells with abnormal metabolism.
Zixin Wei is a medical doctor in medical oncology at Harbin Medical University Cancer Hospital, China. Her research is focused on early screening and comprehensive treatment of advanced lung cancer.
Wenbin Jiang is a postgraduate student in bioinformatics at Harbin Medical University, China. His research is focused on identification of plasma methylation markers for lung cancer diagnosis.
Bo Pan is a professional oncologist at the Department of Medical Oncology, Harbin Medical University Cancer Hospital, China. Her research is focused on the microenvironment of lung cancer, especially the mechanism of metastasis in lung cancer.
Ying Li is a postgraduate student in bioinformatics at Harbin Medical University, China. Her research is focused on identification of molecular mechanism and target for lung adenocarcinoma resistant to immunotherapy.
Yixin Liu is a PhD candidate at the Basic Medicine College, Harbin Medical University, China. His research is focused on prognostic analysis of lung cancer based on imaging omics.
Yingyue Cao is a graduate student in medical oncology at Harbin Medical University Cancer Hospital, China. Her research is focused on the mechanism of metastasis in lung adenocarcinoma.
Wenyuan Zhao, PhD, is a professor of bioinformatics at Harbin Medical University, China. Her research is focused on understanding the relationship between inflammation and cancer.
Yunyan Gu, PhD, is a professor of bioinformatics at Harbin Medical University. Her research is focused on studying the collaborative relationship between genomic/epigenomic alternations.
Yan Yu is a professor and chief physician at the Department of Medical Oncology, Harbin Medical University Cancer Hospital, China. Her research is focused on the relationship between tumour immune microenvironment and tumour metastasis.
Qingwei Meng works as a professor in the Department of Medical Oncology at Harbin Medical University Cancer Hospital. His research is focused on the mechanism of antitumor drug resistance in lung cancer.
Lishuang Qi is a professor of bioinformatics at Harbin Medical University, China. Her research is focused on discovering biomarkers for cancer for clinical application.
References
Author notes
Zheyang Zhang and Sainan Zhang contributed equally to this work.
