


Abstract
Reversible post-translational modification (PTM) orchestrates various biological processes by changing the properties of proteins. Since many proteins are multiply modified by PTMs, identification of PTM crosstalk site has emerged to be an intriguing topic and attracted much attention. In this study, we systematically deciphered the in situ crosstalk of ubiquitylation and SUMOylation that co-occurs on the same lysine residue. We first collected 3363 ubiquitylation-SUMOylation (UBS) crosstalk site on 1302 proteins and then investigated the prime sequence motifs, the local evolutionary degree and the distribution of structural annotations at the residue and sequence levels between the UBS crosstalk and the single modification sites. Given the properties of UBS crosstalk sites, we thus developed the mUSP classifier to predict UBS crosstalk site by integrating different types of features with two-step feature optimization by recursive feature elimination approach. By using various cross-validations, the mUSP model achieved an average area under the curve (AUC) value of 0.8416, indicating its promising accuracy and robustness. By comparison, the mUSP has significantly better performance with the improvement of 38.41 and 51.48% AUC values compared to the cross-results by the previous single predictor. The mUSP was implemented as a web server available at http://bioinfo.ncu.edu.cn/mUSP/index.html to facilitate the query of our high-accuracy UBS crosstalk results for experimental design and validation.
Introduction
Most of the cellular functions are regulated by cell signaling pathways involving in the proteins, which are constantly modified by reversible post-translational modification (PTM), whereas PTM plays crucial roles in regulating cellular biological processes and molecular functions, such as gene expression, protein functions and protein–protein interactions [1–4]. However, many proteins can be multiplied modified, while a growing number of studies indicate that some of these modifications could work together to achieve specific biological outcomes, which is called PTM crosstalk [5–8]. Overall, the crosstalk between different PTMs can regulate the biological processes through three distinct mechanisms [9]. First, two different PTMs could co-occur in the same proteins and crosstalk in a cis-regulatory manner. For example, the Lys372 methylation via Set9 on p53 inhibits the Smyd2-mediated Lys370 methylation, which suppresses the p53 activity as a consequence [10]. Moreover, by changing the status of its cognate enzymes and vice versa, one PTM can influence another PTM in a trans-regulatory manner [11]. Third, PTMs crosstalk may own a competitive basis, in which different PTMs can ‘in situ’ crosstalk by competitively modifying same residues and result in the conferral of opposite or different fates on the substrate. For example, it was found that lysine methylation and acetylation compete at K382 position for modulating the p53 transcription activity [12]. In addition, ubiquitylation and SUMOylation plays critical roles in protein translocation, cell cycle progression and DNA damage response [13]. In situ crosstalk of ubiquitylation and SUMOylation has been reported and functionally studied. For example, inhibitor of nuclear factor-jB (IjBa) was degraded upon its phosphorylation-induced ubiquitylation on Lys21 and Lys22, whereas SUMOylation on Lys21 stabilizes the protein [14]. Lamoliatte et al. observed a decrease of ubiquitylation that was correlated with an increase of SUMOylation at K121, while the ubiquitylation status of H2B is critical for the transcriptional process [15]. Accumulating shred of evidences revealed the significance of PTM crosstalk in multiple biological pathways.
Recently, progresses in the identification of PTM sites by mass spectrometry-based proteomics experiments such as high-throughput liquid chromatography/mass spectrometry (LC-MS) techniques provided a great opportunity to analyze PTM in situ crosstalk on a larger scale. For example, Weinert et al. demonstrated that succinylation and acetylation extensively co-occupied at the same residues from prokaryotes and eukaryotes, while 66% of Escherichia coli, 56% of Saccharomyces cerevisiae and 57% of mouse liver succinylation sites were overlapped with acetylation [16]. Also, Hendriks et al. systematically identified more than 4300 SUMOylation sites in human cells and revealed the phenomenon of in situ crosstalk between SUMOylation and other PTMs [17]. The relationship between phosphorylation and O-GlcNAcylation was systematically explored from mouse synaptosomes, while the interplay between phosphorylation and lysine acetylation was investigated by the deletion perturbations in the mycoplasma pneumonia genome [18, 19]. But mass spectrometry-based experimental approaches for identifying PTM crosstalk events were sometimes costly and time-consuming, the identification of PTM crosstalk proteome-wide remains a great challenge. Some attempts on the exploration of PTM in situ crosstalk have also been made computationally. For example, Gray et al. concluded that mutations of lysine with multi-PTMs underwent much greater purifying selection against singly modified lysine residues [20]. Pan et al. also performed systematic analyses of the in situ crosstalk of tyrosine modifications and revealed there was no additional natural selection on multiply-modified residues [9]. Also, the study for predicting PTM crosstalk sites has emerged to be an intriguing topic and attracted much attention. Yao et al. used sequence features and GO features to predict O-GlcNAcylation and phosphorylation crosstalk sites by the use of the SVM model [21]. Moreover, with a naïve Bayes classifier integrating different features of PTM crosstalk pairs, Huang et al. built a predictor called ptm-x to discover crosstalk for the pairwise combination of PTM sites [22, 23].
In this study, 121 742 ubiquitylation and 8115 SUMOylation sites, the most widely studied ubiquitin family conjugations, were collected from PLMD database. By integrating these two data sets, 3363 in situ crosstalk of ubiquitylation and SUMOylation (UBS) sites on 1302 proteins were detected. Based on the data set, the sequence motifs enrichment and evolutionary conservation between in situ crosstalk and single modification sites were analyzed. Also, the distribution of the three structural information i.e. accessible surface area (ASA), local backbone angles (LBA) and secondary structure (SS) were investigated between in situ crosstalk and single modification sites. It was found that UBS crosstalk sites have great differences in the prime sequence characteristics, local sequence evolutionary and structural annotations compared to the single modification sites. Thus, we integrated sequence characteristics, evolutionary information and structural information with a two-step feature selection strategy by recursive feature elimination approach to predict UBS crosstalk sites, which enhances feature representation and contributes to performance improvement. After exhaustively testing, random forest (RF) classification algorithm with 100-dimension representative features was implemented as the mUSP classifier. The performance of the mUSP was evaluated by serial n-fold cross-validations (CVs), and the result showed that our method achieved an average area under the curve (AUC) value of 0.8416. Compared to cross-results by previous single predictor, the mUSP lead to better prediction with the 38.41 and 51.48% AUC values improvement. A user-friendly web server (http://bioinfo.ncu.edu.cn/mUSP/index.html) was implemented to allow user to query of our high-accuracy map of the UBS crosstalk results.
Materials and methods
There are three steps to build and assess the mUSP (Figure 1): we (i) compiled the benchmark data set of UBS crosstalk site and single modifications sites to train and test the mUSP models; (ii) formulated the protein sequences in the benchmark data set with effective mathematical encodings by sequence-derived, evolutionary-derived and structural-derived features (see Supplementary Table S1 available online at https://dbpia.nl.go.kr/bib) and (iii) performed the two-step feature optimization method to extract the optimal features, evaluate the mUSP models and develop the mUSP web server.
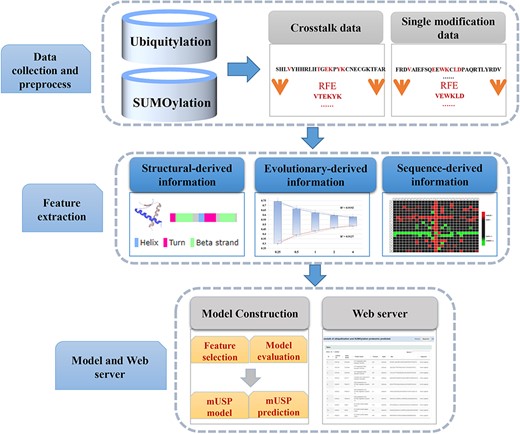
The workflow of mUSP.
Data collection and processing
In this study, ubiquitylation and SUMOylation, the most widely studied ubiquitin family conjugations, were investigated. From a home-built database of PLMD [24], we collected 121 742 and 8115 lysine ubiquitylation and SUMOylation sites. By integrating these two data sets, 3363 UBS crosstalk sites in 1302 proteins were detected. In our system, a local sliding window size of a maximum number of 31 residues flanking each lysine was chosen. We used multiply-modified sites as the positive data, but it would be difficult to prove definitively that a lysine residue not have occurred crosstalk under any conditions. To solve this problem of choosing the negative sets, the single modification sites were used as negative data. Therefore, in this study, we can develop a model to determine whether experimental ubiquitination site can be regulated by SUMOylation, or vice versa. And such a procedure can efficiently exclude potentially non-functional UBS crosstalk mainly generated by chance. Eventually, the positive set was composed of 3363 crosstalk sites, whereas the negative sets included 123 131 single modification sites. All of the benchmark data sets can be downloaded from http://bioinfo.ncu.edu.cn/mUSP/Download.html.
Sequence-derived characteristics
Binary
Composition of K-spaced amino acid pairs
Amino acid composition
Enhanced amino acid composition
The enhanced amino acid composition (ENAC) encoding [29] represents the local AAC for the fixed-length sequence window (we set the window as 5) that continuous slides from the 5′ to 3′ terminus of each protein sequence. For more information on this approach, please refer to AAC feature encoding. Thus, a UCS (15, 15) corresponded to 21 * (31 – 5 + 1) sliding windows and its vector dimension of the EAAC encoding was 21 × 27 = 567.
Evolutionary-derived information
Structural-derived information
Accessible surface area
Local backbone angles
Secondary structure
Two-step feature selection strategy via recursive feature elimination
Feature selection was a critical step to eliminate the noisy features and improve performance. In this study, we performed a two-step feature selection method to capture the most prominent features and then to construct the final model with the optimal feature group. In the first step, the chi-square statistics [33] between every feature variable and the target labels were calculated to explore the feature important. If the feature was independent of the target, we discard the feature variable. Otherwise, the feature was considered important and reserved. This procedure could generate an index of feature ranking regarding their classification importance. In the second step, the method of recursive feature elimination was adopted to determine the optimal feature representations by recursively eliminating a small number of weakest features per loop [34]. More specifically, to determine the optimal group, features from the ranked index were group eliminated ten-by-ten from lower rank to higher rank each time, whereas the least important features are gradually pruned. The remaining features were selected to rebuild random forests (RF)-based prediction model on the 10-fold CV repeatedly. Finally, the feature subset with the best performance was selected as the optimal feature subset to build the prediction model. The methodology of the strategy was illustrated as follows:
| Inputs: |
| Training data set D. |
Set of i features F = {f1, f2, …, fi}. |
| Ranking method R (D, F). |
| Outputs: |
| Final ranking FR. |
| Algorithms: |
| Repeat for k in {1: F}: |
| Rank set F using R (D, F) |
| f* = last ranked feature in F. |
| FR (F – K + 1) = f *. |
| F = F – f *. |
| Inputs: |
| Training data set D. |
Set of i features F = {f1, f2, …, fi}. |
| Ranking method R (D, F). |
| Outputs: |
| Final ranking FR. |
| Algorithms: |
| Repeat for k in {1: F}: |
| Rank set F using R (D, F) |
| f* = last ranked feature in F. |
| FR (F – K + 1) = f *. |
| F = F – f *. |
| Inputs: |
| Training data set D. |
Set of i features F = {f1, f2, …, fi}. |
| Ranking method R (D, F). |
| Outputs: |
| Final ranking FR. |
| Algorithms: |
| Repeat for k in {1: F}: |
| Rank set F using R (D, F) |
| f* = last ranked feature in F. |
| FR (F – K + 1) = f *. |
| F = F – f *. |
| Inputs: |
| Training data set D. |
Set of i features F = {f1, f2, …, fi}. |
| Ranking method R (D, F). |
| Outputs: |
| Final ranking FR. |
| Algorithms: |
| Repeat for k in {1: F}: |
| Rank set F using R (D, F) |
| f* = last ranked feature in F. |
| FR (F – K + 1) = f *. |
| F = F – f *. |
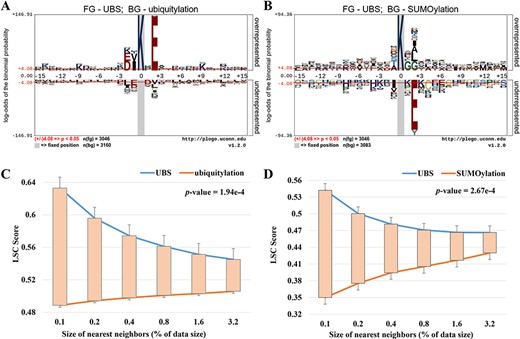
Sequence logo illustration generated by pLogo to show the amino acids with statistically significant differences surrounding the UBS crosstalk sites with ubiquitylation (A) or SUMOylation (B) data as background. (C, D) The comparison of LSC scores between UBS crosstalk sites and ubiquitylation (C) or SUMOylation (D) data.
The implementation of the web service
The online service of mUSP was constructed in an easy-to-use manner using PHP and JavaScript. Many annotated information was integrated into mUSP. In addition to a ‘general search’ option, where you can retrieve information for all columns by imputing keyword, researchers can search each column individually, and multiple columns or multiple conditions search at the same time. The website of mUSP was extensively tested on various web browsers including Internet Explorer, Mozilla Firefox and Google Chrome to provide a robust service. For convenience, the online service of mUSP was implemented and freely available at http://bioinfo.ncu.edu.cn/mUSP/index.html.
Results
Motifs analysis for the UBS crosstalk site compared to single modification
Based on the data sets, the graphical sequence logo (P-value <0.05) was generated by pLogo tool to reveal the statistical differences of position-specific amino acid frequencies between the UBS crosstalk and single modification sites (Figure 2A, B). Compared to ubiquitylation sites, we found lysine (K), glutamic acid (E), aspartic acid (D) and valine (V) were significantly enriched in the fragments containing UBS crosstalk sites, whereas ubiquitylation modification fragments contained a large number of leucine (L) in the protein sequence. When using SUMOylation modification data as the background, it was found that glycine (G), leucine (L) and alanine (A) were significantly enriched in the crosstalk fragments. Moreover, UBS crosstalk events might be facilitated by specific consensus sequences or motifs that have biological significances. Therefore, using MEME tool, we analyzed the UBS crosstalk data against the background set of single modification sequences individually and three significant motifs of UBS crosstalk were discovered, respectively [35] (see Supplementary Figure S1 available online at https://dbpia.nl.go.kr/bib). From the result, ΨKxE is the most predominant motif of UBS crosstalk sites compared to ubiquitylation sites (where Ψ represents hydro-phobic amino acid) such as IKxE and VKxE. In addition, GTYG with remarkable enrichment of glycine (G) at upstream of the UBS crosstalk was also detected as the most consensus motif with SUMOylation data as the background. The analysis suggests that sequence patterns of the flanking regions of UBS crosstalk sites were more conservative with higher specificity than those of single modification sites.
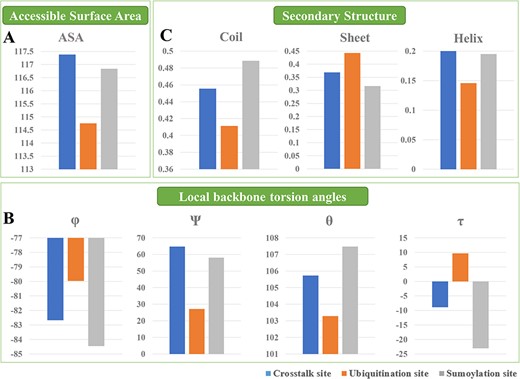
The structural annotations regarding the accessible surface area (A), local backbone angles (B) and SS (C) between UBS crosstalk and ubiquitylation or SUMOylation data.
LSC scores analysis between UBS crosstalk and single modification site
The Local Sequence Clusters (LSC) scores can measure whether a query sequence is more similar to the UBS crosstalk sequence or not. A higher LSC score always means that the query sequence was more similar to the positive samples, whereas a lower LSC score means that the query sequence was more likely to the negative samples. Figure 2C, D compared the LSC score between UBS crosstalk and single modification sequences individually. More specifically, the average LSC scores of UBS crosstalk with different sizes of nearest neighbors were within 0.55–0.63 and 0.47–0.54. From the result, we found there were statistically significant differences among the various size of nearest neighbors of the LSC score between UBS crosstalk and ubiquitylation (P-value, 1.94e − 4) or SUMOylation sites (P-value, 2.67e − 4). UBS crosstalk sequences own larger LSC scores than single modification sequences. Hence, the local sequences surrounding identified UBS crosstalk sites were more similar to their nearest neighbors in the positive set. In other words, for query sequence, a high LSC score always means an increased likelihood that the site was to be some known UBS crosstalk sites. This result confirms that UBS crosstalk-related clusters exist in local sequences around crosstalk sites. For single modification sites, it was not surprising that the average LSC scores were comparatively low, which demonstrated that the global sequences in the negative set were not mainly similar to the nearest neighbors in either the positive or the negative data sets. Sequences in the negative data set possess the same opportunities to find nearest neighbors in either the positive or the negative data set. In summary, the LSC scores can capture the cluster information in the local sequence around UBS crosstalk sites and hence distinguish them from the negative data. Therefore, LSC score was adopted as features for UBS crosstalk site prediction.
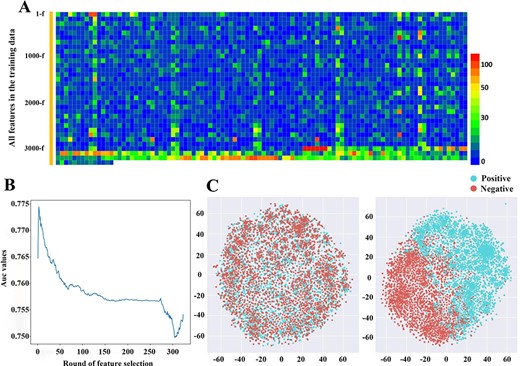
(A) The correlation between every feature vector in the training data and the corresponding label based on chi-square statistics. (B) The AUC value of 10-fold cross-validation with the decrease of feature dimension. (C) The t-distributed Stochastic Neighbor Embedding (t-SNE) visualization of the benchmark data set in a 2D feature space before and after feature optimization.
Structural annotations between UBS crosstalk and single modification site
Structural annotations regarding the SS, accessible surface area and local backbone angles between UBS crosstalk and single modification site were explored (Figure 3). For the results, it was found that UBS crosstalk sites existed a higher accessible surface area value compared to ubiquitylation and SUMOylation sites, whereas ubiquitylation site has the lowest value (Figure 3A). For the local backbone torsion angles, our results show that UBS crosstalk was at an intermediate value between ubiquitylation and SUMOylation in terms of the properties of φ, θ and τ and do not show special fluctuation. But for the Ψ, we found that UBS crosstalk sites owned a higher value compared to ubiquitylation and SUMOylation sites (Figure 3B). The SS represents the local 3D structure of proteins. Each residue can contribute to one of the three defined local structures of a protein, i.e. helix, strand and coil. The information of protein SS can provide a potent trail towards understanding their general 3D configuration. In this study, the SS between the UBS crosstalk and single modification was compared. It was found that UBS crosstalk tends to have a slightly higher helix structure probability, whereas the prediction probability of the strand and coil structure were located in between ubiquitylation and SUMOylation (Figure 3C). Taken together, the results of structural annotations demonstrated that there are structural differences between UBS crosstalk and single modification site and can be used to build models to distinguish positive and negative samples.
Two-step feature selection strategy to determine the optimal feature subset
As demonstrated above, the UBS crosstalk sites exhibited great difference on the primary sequence’s motifs, local evolutionary scores and structural annotations compared to single modification site. But multiple features include many dimensions, which were not equivalently important for the model performance, and some of the feature vectors might be unwanted noise. In this study, a two-step feature selection method was used via the recursive feature elimination to select the optimal feature group. First, we use the chi-square statistics to calculate the correlation between every feature vector and the corresponding label to quantify its important (Figure 4A). The least important features are gradually pruned round by round. We plotted the change of AUC value based on 10-fold CV with the decrease of feature dimension (Figure 4B). We observed the performance of the model increased quickly at the beginning, then reached the highest point of performance and gradually decreasing, which suggested that the recursive feature elimination contributes feature representation and was effective to improve performance. To explore the inner cause of performance improvement, the distribution of feature space between the initial and optimal status was investigated and visualized using t-distributed Stochastic Neighbor Embedding (t-SNE) (Figure 4C). We first adopted principal components analysis method to reduce the number of dimensions of all features to 50-dimensions. We then computed the t-SNE implemented in scikit-learn 0.22.1 with the default parameters (n_components = 2, perplexity = 30, and learning rate = 200). The distribution of positive and negative samples in the two-dimensional (2D) feature space was illustrated. We found a clear inhomogeneity without clear border in the distribution pattern of positive (UBS crosstalk sites) and negative data (single modification sites), indicating that the original feature discriminating capability was less. By implementing the recursive feature elimination process, the feature space tends to be relatively stable, in which the distinction between the positive samples and negative samples in feature space was clearer.
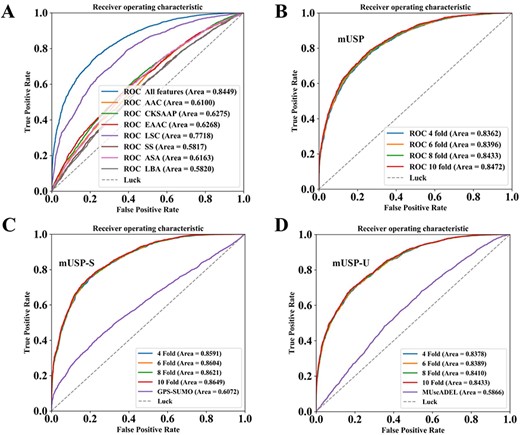
The performance evaluation and comparison of mUSP, mUSP-S and mUSP-U, based on multiple cross-validations. For the models of mUSP-U and mUSP-S, the negative samples in training data only contained ubiquitylation and SUMOylation sites. (A) The performance comparison between the integration of optimal features and the individual feature. (B) The ROC curves and AUC values of mUSP based on multiple cross-validations. (C) The ROC curves and AUC values of mUSP-S and comparison of the mUSP-S with GPS-SUMO. (D) The ROC curves and AUC values of mUSP-U and comparison of the mUSP-U with MUscADEL.
Construction and evaluation of mUSP predictor
After exhaustively testing, RF classification algorithm with 100-dimension representative features was implemented as the mUSP classifier. To assess the prediction performance of mUSP, the 4-, 6-, 8- and 10-fold CVs were applied and the ROC curves were drawn (Figure 5B) and the corresponding AUC values were calculated as 0.8362 (4-fold), 0.8396 (6-fold), 0.8433 (8-fold) and 0.8472 (10-fold), respectively. Since the prediction performance of the 4-, 6-, 8- and 10-fold CVs were closely similar and average AUC values of various CVs also as high as 0.8416, it is evident that the model was a robust predictor. In fact, researchers can directly input some ubiquitylation or SUMOylation sites to the SUMOylation or ubiquitylation prediction tools to cross-detect the potential UBS crosstalk sites. But this is often inaccurate and biased due to the original intention of these tools. Therefore, to exhibit the reliability of mUSP, another two-gold data sets with only negative data that contain only ubiquitylation and SUMOylation sites were constructed, which was used to train two new models mUSP-U and mUSP-S, separately. The 4-, 6-, 8- and 10-fold CVs were performed, and the ROC curves were drawn for the two new models (Figure 5C, D). The average AUC values of mUSP-U and mUSP-S were calculated as 0.8616 and 0.8404. Multiple CV results of these two models were high congruence, which indicates the promising accuracy and the two models are robust. Moreover, the benchmark data set of mUSP-U and mUSP-S were directly submitted to MUscADEL [36] and GPS-SUMO [37], i.e. two most popular prediction tools for identifying the lysine ubiquitylation and SUMOylation sites for cross-prediction, and the cross-prediction results were 0.6072 and 0.5866 for the GPS-SUMO and MUscADEL. The mUSP achieved significantly better performance with the 38.41 and 51.48% AUC values improvement compared to the results by GPS-SUMO and MUscADEL in the benchmark data. Overall, our results demonstrated the robustness and superiority of mUSP, mUSP-U and mUSP-S.
Discussion
Recent studies impressively demonstrated that various PTMs can work together to regulate specific biological pathways [38,39]. The combination of different PTMs on protein surfaces can create a ‘PTM code’, which regulated protein functions and cellular signaling, represent just another level of complexity and pose a major challenge to ongoing and future PTM research. Ubiquitylation and SUMOylation are the discrete modifications, which can bring different outcomes. In situ crosstalk of ubiquitylation and SUMOylation has been identified and functionally studied. For example, mono-ubiquitylated at Lys164 of proliferating cell nuclear antigen (PCNA) facilitates translation synthesis, a DNA repair pathway that is prone to error; however, construction of a poly-ubiquitin chain at this site promotes an error-free repair process by PCNA. Conversely, SUMOylation at Lys164 during S-phase prevents PCNA-induced DNA recombination [40].
In this study, we systematically explored the in situ crosstalk of ubiquitylation and SUMOylation co-occurring on the same residue. In total, 3363 UBS crosstalk sites in 1302 proteins were detected from the housekeeping of PLMD database. By investigating sequence information, we found UBS crosstalk sites exhibited great differences in the prime sequence characteristics, local sequence evolutionary scores compared to the single modification sites. Also, there was a difference for the distribution of structural annotations between UBS crosstalk and single modification sites either on central modification sites or on crosstalk sequences. Thus, we integrated sequence-derived characteristics, local sequence evolutionary scores and structural annotations with a two-step feature selection strategy via recursive feature elimination approach to build the mUSP model for predicting UBS crosstalk sites.
Our analysis provided important clues to the feature selection and led to the satisfying predictive performance. We observed that the two-step feature selection strategy enhances feature representation and contributes to performance improvement for the in situ crosstalk of ubiquitylation and SUMOylation prediction. The following performance evaluation showed that our method achieved relatively high satisfaction. With the mUSP model, 11 444 high-confidence potential UBS crosstalk sites were excavated and added to the mUSP web server along with annotation information for researchers to query. With the great development of mass spectrometry-based proteomics experiment, a mass of ubiquitylation and SUMOylation sites was experimentally verified, but their crosstalk and its properties remain to be systematically characterized. Thus, it is anticipated that the classifiers constructed in this work could be useful for biomedical research and guide the related experimental validations.
Reversible post-translational modification (PTM) crosstalk plays important role in regulating diverse biological processes. This study conducted a comprehensive survey of properties of UBS crosstalk regarding the sequence motifs, local evolutionary scores and distribution of structural annotations.
Two-step feature selection strategy enhances feature representation and contributes to performance improvement for the in situ crosstalk of ubiquitylation and SUMOylation prediction.
A web portal (http://bioinfo.ncu.edu.cn/mUSP/index.html) has been made available to facilitate the query of our high-accuracy map of the UBS crosstalk results.
Funding
National Natural Science Foundation of China (21665016 and 21175064).
Conflict of interest
The authors declare that they have no competing interests.
Hao-Dong Xu is a graduate student at the department of chemistry, Nanchang University. His research interest includes machine learning & deep learning algorithms development and database construction.
Ru-Ping Liang is a professor at the department of chemistry, Nanchang University.
You-Gan Wang is a graduate student at the department of chemistry, Nanchang University. His research interest includes machine learning and database construction.
Jian-Ding Qiu is a professor at the department of chemistry, Nanchang University. His research interest includes the development of novel algorithms, online tools, and databases for protein structure and function prediction.
