


Abstract
erectile dysfunction is associated with mortality, whereas the association between low testosterone (T) and higher mortality remains controversial. Sexual dysfunction and low T often coexist, but the relative importance of sexual symptoms versus low T in predicting mortality is not known. We studied the interrelationships between sex steroids and sexual symptoms with all-cause mortality in a large prospective cohort of European men.
survival status was assessed in 1,788 community-dwelling men, aged 40–79, who participated in the European Male Ageing Study (EMAS). Sexual symptoms were evaluated via a validated questionnaire (EMAS-SFQ). Sex steroids were measured by mass spectrometry. Cox proportional hazard models were used to study the association between hormones, sexual symptoms and mortality.
about 420 (25.3%) men died during a mean follow-up of 12.6 ± 3.1 years. Total T levels were similar in both groups, but free T was lower in those who died. Men with three sexual symptoms (erectile dysfunction, reduced morning erections and lower libido) had a higher mortality risk compared with men with none of these symptoms (adjusted hazard ratio (HR) and 95% confidence intervals: 1.75 (1.28–2.40, P = 0.001)). Particularly, erectile dysfunction and poor morning erections, but not lower libido, were associated with increased mortality (HR 1.40 (1.13–1.74, P = 0.002), 1.28 (1.04–1.59, P = 0.023) and 1.12 (0.90–1.39, P = 0.312), respectively). Further adjusting for total T, free T or oestradiol did not influence the observed risk.
sexual symptoms, in particular erectile dysfunction, predict all-cause mortality independently of sex steroids and can be an early warning sign of a poor health status.
Key Points
We prospectively investigated the interrelationships between sexual symptoms and sex steroids with all-cause mortality in a large cohort of middle-aged and older men followed up for >12 years.
Sexual symptoms, in particular erectile dysfunction, predict all-cause mortality independently of sex steroids.
Sexual symptoms can thus be an early warning sign of a poor health status in ageing men.
Introduction
The large difference in life expectancy between men and women continues to exist: men tend to die on average 5 years earlier than women [1]. This gender disparity remains poorly understood, even though ageing-related changes that could contribute to worse health and earlier death in men have been extensively explored [2].
Erectile dysfunction (ED) is a frequent health problem in ageing men, affecting >50% of men between 40 and 70 years of age [3]. ED has been associated with an increased mortality risk [4–6]. Data from a recent meta-analysis indeed indicate that men with ED have a 24% higher risk of all-cause mortality compared with men without ED [6]. As total testosterone (T) levels in men gradually decline with ageing, several studies have also investigated the association between low total T and all-cause and cardiovascular mortality. However, these studies yielded conflicting results and it remains debated if low total T is an independent risk factor to disease/mortality or a nonspecific risk marker of poor health [7].
Sexual dysfunction and low T often coexist. The European Male Ageing Study (EMAS) showed that the age-related decline of T levels is predominantly associated with sexual symptoms in community-dwelling men [8]. It is, however, unclear if the observed increased mortality risk in men with ED is related or not to their lower T levels. Only one study in men older than 70 suggested that the association between ED and increased mortality risk may be confounded by T levels [5].
The aim of this study was to investigate prospectively the interrelationships between selected sexual symptoms and sex steroids with all-cause mortality in a large cohort of middle-aged and older community-dwelling European men followed up for >12 years. This allowed us to investigate the relative importance of sexual symptoms versus low T in predicting mortality risk in ageing men.
Methods
Original study design and participants
The design of EMAS has been described previously [9]. Between 2003 and 2005, 3,369 men, aged 40–79 years, were recruited for participation in EMAS in eight European centres: Manchester, United Kingdom; Leuven, Belgium; Malmö, Sweden; Tartu, Estonia; Lodz, Poland; Szeged, Hungary; Florence, Italy and Santiago de Compostela, Spain. After a median follow-up time of 4.3 years, 2,736 men participated in phase 2, whereas 193 men had died and 440 were lost to follow-up. In each centre, ethical approval for the study was obtained according to local requirements. All men provided written informed consent.
Mortality data
Updated mortality data were obtained in April 2018. The centres in Tartu, Lodz, Florence and Santiago included men from the original cohort, whereas the centre in Leuven only included subjects who participated in phase 2, due to limitations in the informed consent at baseline. The centres in Manchester, Malmö and Szeged could not provide recent mortality data because of local personal confidentiality restrictions. Where necessary, a protocol addendum approval was obtained from the local ethical committee before the updated mortality data were collected.
Acquisition of mortality data varied slightly between centres, based on local health care organisation and the availability and accessibility of national mortality registers. Several methods were used to retrieve survival status: review of electronic health records, review of national mortality registers, contacting the general practitioner of the subject, contacting the subject himself or a relative specified by the subject upon inclusion to the study. The specific cause of death was not available.
Assessments
At inclusion, a postal questionnaire was used to obtain information on demographic factors, smoking habits and alcohol consumption, general health, comorbidities and the use of prescription and nonprescription medication. Anthropometric measurements and Reuben’s Physical performance test (time to walk 50 feet) [10] were performed according to standardised methods [9]. Sexual symptoms were assessed by using the EMAS Sexual Function Questionnaire [11]. From previous analysis of the EMAS data, ED, morning erection frequency and frequency of sexual thoughts were strongly associated with decreased T levels [8], and these symptoms were included in the current analysis. Physical activity was scored using the Physical Activity Scale for the Elderly (PASE). Men were classified as having a low physical activity level when the PASE score was below 67.8, normal activity level when the PASE score was between 67.8 and 223.8 and a high activity level when the PASE score was higher than 223.8 [12, 13]. Comorbidities were self-reported and included history of a heart condition, stroke, high blood pressure, bronchitis, asthma, peptic ulcer, epilepsy, diabetes, cancer, liver conditions, kidney conditions, prostate diseases and thyroid disorders.
Laboratory measurements
At baseline, a single fasting morning venous blood sample was obtained from each subject. Haematological and biochemical parameters were assessed at the local health care facility. Total T was measured by liquid chromatography–tandem mass spectrometry as described previously [14]. The lower limit of quantification (LOQ) was 0.25 nmol/L. The coefficients of variation were <10% within assay runs and between assay runs. Total oestradiol (E2) was measured by gas chromatography-tandem mass spectrometry as described previously (LOQ 0.07 nmol/L, intra-assay and inter-assay coefficients of variation were <5%) [15]. Sex hormone binding globulin (SHBG) was measured by the E170 platform electrochemiluminescence immunoassay (Roche Diagnostics). Calculated free T was derived from total T, SHBG and albumin levels by the Vermeulen formula [16].
Statistical analysis
Baseline characteristics are presented as mean (standard deviation) for continuous variables and percentage for categorical variables. Smoking status was categorised as active smoking versus never/ex-smokers. Alcohol intake was stratified as 4 days or less per week versus 5 or more days per week. Decreased frequency of sexual thoughts was defined as thinking about sex less than once a week, decreased morning erection frequency as waking up with a full erection less than two times in the past month and ED as never or sometimes having a sufficient erection for sexual intercourse. Men taking PDE5 inhibitors (n = 8) were classified as having ED. Baseline differences between men who survived and men who died were assessed using t-tests for continuous variables and Chi-squared tests for categorical variables. For this analysis specifically, a variable was constructed to identify men with a history of a heart condition or stroke. A second variable for other comorbid conditions (high blood pressure, bronchitis, asthma, peptic ulcer, epilepsy, diabetes, cancer, liver conditions, kidney conditions, prostate diseases and thyroid disorders) was categorised into <2 and ≥ 2 comorbidities. In all other models, the total number of comorbidities was included as a continuous variable.
Cox proportional hazard models were used to study the association between sexual symptoms, hormones and mortality. As the age range at inclusion was very broad (40–79 years old) and men were followed up for a long time, survival depends on age at inclusion rather than follow-up time. Therefore, age was used as the underlying time scale in the statistical analysis instead of follow-up time adjusted for age. This means that subjects enter the analysis at their baseline age and exit at time of death or when the censor date are reached. Using age as time-scale is recommended in large-scale longitudinal cohort studies [17–19].
First, the association between the number of sexual symptoms as well as the presence of a specific sexual symptom and the all-cause mortality risk was investigated. These models were tested unadjusted and after adjusting for centre, body mass index (BMI), alcohol intake, smoking, physical activity level and the number of comorbidities at baseline. Additional adjustments were made for total T, free T, E2 or SHBG that were included as continuous variables.
Second, total T, free T, SHBG and E2 were divided into quintiles to investigate the association between sex steroids and mortality. To investigate the influence of total or free T combined with the presence of sexual symptoms, total T was stratified as normal (≥11 nmol/L) and low (<11 nmol/L) and free T as normal (≥220 pmol/L) and low (<220 pmol/L) [8]. Total T strata and the presence of sexual symptoms were combined in one variable with total T ≥ 11 nmol/L and no sexual symptoms as the reference group. This was also done for free T, with free T ≥ 220 pmol/L and no sexual symptoms as the reference group. The models were tested unadjusted and adjusted for centre, BMI, alcohol intake, smoking, physical activity level and the number of comorbidities at baseline.
Results were expressed as hazard ratios (HRs) with 95% confidence intervals. P-values <0.05 were considered statistically significant. All statistical tests were performed using STATA version 15.1 (StataCorp, College Station, TX).
Results
Of the 3,369 EMAS subjects recruited at baseline, the participants from Manchester, Malmö and Szeged were excluded (n = 1,236) because these centres could not provide information on current survival status of the participants. In the five other centres, there were 91 men with unknown survival status and these men were also excluded. From the 2,042 men in whom mortality data could be obtained, 104 men were excluded due to pituitary, testicular or adrenal disease or interfering drugs at baseline. In addition, 25 men were excluded due to missing T measurements at baseline and 125 men because baseline data on sexual symptoms were missing, leaving 1,788 men in the analytical sample (Figure 1). Of those, 420 men (23.5%) had died, whereas 1,368 men (76.5%) were alive, after a mean follow-up time of 12.6 years (±3.1).
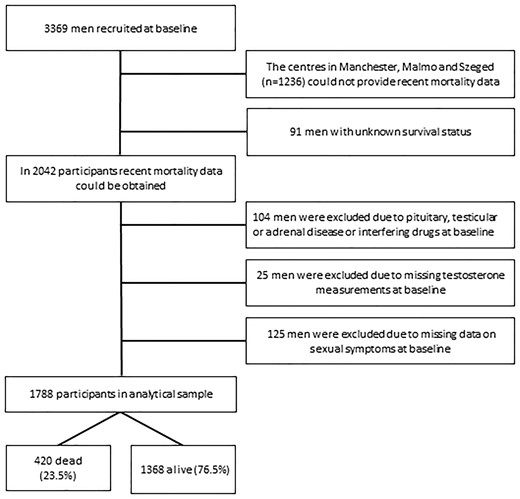
Flowchart of participants.
Baseline characteristics of the cohort are presented in Table 1. As expected, the men who died were older, had a higher BMI and waist circumference, were less physically active and had more comorbidities at baseline compared with the men who survived. Of note, alcohol consumption was less frequent in the men who died, but there was no difference in smoking status. Sexual symptoms were more prevalent in the men who died. Total T levels were not different between the two groups, but those who died had lower free T and higher SHBG (Table 1).
Baseline characteristics of the study sample
| Entire cohort (n = 1,788) | Survived (n = 1,368; 76.5%) | Died (n = 420; 23.5%) | P-value | |
|---|---|---|---|---|
| Mean (SD) | Mean (SD) | Mean (SD) | ||
| Age (years) | 59.4 (10.8) | 57.0 (10.1) | 67.1 (9.4) | <0.0001 |
| Weight (kg) | 82.4 (13.9) | 82.6 (13.4) | 81.7 (15.6) | 0.233 |
| Height (cm) | 172.8 (7.3) | 173.4 (7.2) | 170.6 (7.1) | <0.0001 |
| BMI | 27.6 (4.1) | 27.5 (3.9) | 28.0 (4.6) | 0.0136 |
| Waist circumference (cm) | 97.8 (11.0) | 97.0 (10.6) | 100.1 (12.0) | <0.0001 |
| Alcohol (≥5 days/week) (%) | 23.9 | 25.1 | 19.9 | 0.028 |
| Active smoking (%) | 24.7 | 23.8 | 27.6 | 0.114 |
| Physical activity level (PASE) | <0.0001 | |||
| Low activity level (%) | 9.1 | 6.4 | 17.9 | |
| Normal activity level (%) | 52.6 | 50.7 | 59.1 | |
| High activity level (%) | 38.3 | 42.9 | 23.1 | |
| History of heart condition or stroke (%) | 18.0 | 13.7 | 32.2 | <0.0001 |
| ≥2 other comorbidities (%)b | 16.5 | 12.7 | 28.9 | <0.0001 |
| Sexual symptoms | ||||
| % with EDa | 30.9 | 23.8 | 54.3 | <0.0001 |
| % with infrequent morning erections | 40.7 | 34.6 | 60.7 | <0.0001 |
| % with infrequent sex thoughts | 25.2 | 19.8 | 42.6 | <0.0001 |
| % with 3 sexual symptoms | 12.4 | 7.3 | 28.8 | <0.0001 |
| Hormones | ||||
| Total T (nmol/L) | 17.4 (6.1) | 17.4 (5.9) | 17.4 (6.7) | 0.9303 |
| Free T (pmol/L) | 304.2 (86.2) | 313.2 (85.6) | 274.9 (81.7) | <0.0001 |
| SHBG (nmol/L) | 43.4 (19.8) | 41.1 (17.8) | 50.9 (24.0) | <0.0001 |
| Total E2 (pmol/L) | 74.5 (25.2) | 72.7 (23.5) | 80.2 (29.3) | <0.0001 |
Values are reported as mean (standard deviation) for continuous variables and percentage for categorical variables. P-value: t-test for continuous variables and Chi2 test for categorical variables.
BMI: body mass index, PASE: physical activity scale for the elderly, T: testosterone, SHBG: sex hormone binding globulin.
aMen taking PDE5 inhibitors (n = 8) were classified as having ED.
bComorbid conditions included self-reported high blood pressure, bronchitis, asthma, peptic ulcer, epilepsy, diabetes, cancer, liver conditions, kidney conditions, prostate diseases and thyroid disorders.
Statistically significant values are indicated in bold.
Men with three sexual symptoms had an increased mortality risk compared with men with no sexual symptoms. In particular, ED and poor morning erections, but not low libido, were associated with increased mortality. Further adjusting for total T, free T, total E2 or SHBG did not influence the observed HRs (Figure 2).
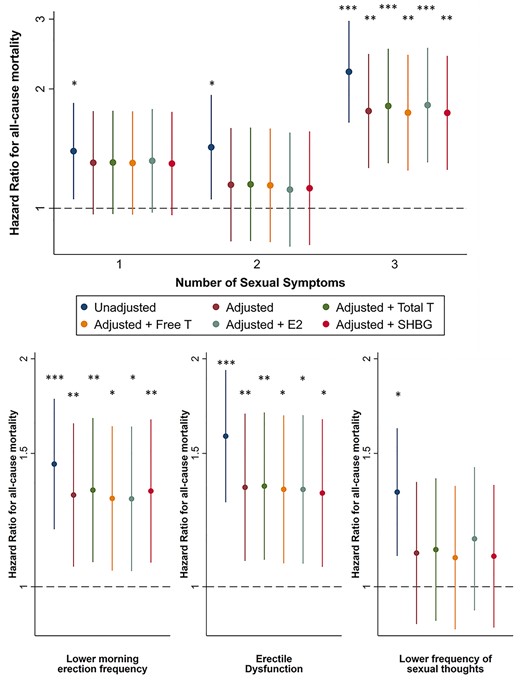
Influence of sexual symptoms on risk of all-cause mortality. Top: association between the number of sexual symptoms and the risk of all-cause mortality, compared to men without sexual symptoms. Bottom: association between the presence of a specific sexual symptom and the risk of all-cause mortality compared with men not having this symptom. Cox proportional hazard models were used to study the association between sexual symptoms and all-cause mortality with age at inclusion as the underlying time scale. Data are reported as HRs with 95% confidence intervals, unadjusted, adjusted (centre, BMI, alcohol intake, smoking, physical activity, number of comorbidities), adjusted + total testosterone, adjusted + free testosterone, adjusted + estradiol and adjusted + SHBG. *P < 0.05, **P < 0.01, ***P < 0.001.
Mortality risk was not different across total and free T quintiles. In the unadjusted model, the highest quintile of SHBG had a higher mortality risk than the middle quintile, but this was no longer significant after adjusting for confounders. For E2, mortality risk was lower in the second lowest quintile compared with men with the highest E2 levels (Table 2).
Influence of sex steroids and SHBG on the risk of all-cause mortality
| Quintile 1 | Quintile 2 | Quintile 3 | Quintile 4 | Quintile 5 | |
|---|---|---|---|---|---|
| Total T | |||||
| Unadjusted | 0.98 (0.73; 1.32) | 1.00 (0.74; 1.34) | 0.87 (0.64; 1.18) | 0.85 (0.62; 1.15) | Ref |
| Adjusted | 0.87 (0.62; 1.22) | 0.93 (0.67; 1.29) | 0.89 (0.63; 1.24) | 0.92 (0.67; 1.28) | Ref |
| Free T | |||||
| Unadjusted | 1.32 (0.95; 1.84) | 1.03 (0.73; 1.45) | 0.91 (0.63; 1.30) | 1.06 (0.74; 1.52) | Ref |
| Adjusted | 1.14 (0.79; 1.65) | 1.07 (0.73; 1.56) | 1.05 (0.72; 1.55) | 1.17 (0.80; 1.71) | Ref |
| SHBG | |||||
| Unadjusted | 1.08 (0.76; 1.53) | 0.77 (0.55; 1.09) | Ref | 1.12 (0.83; 1.52) | 1.37 (1.03; 1.82)* |
| Adjusted | 1.10 (0.75; 1.63) | 0.80 (0.55; 1.17) | Ref | 1.24 (0.89; 1.74) | 1.38 (1.00; 1.92) |
| Total E2 | |||||
| Unadjusted | 0.84 (0.62; 1.14) | 0.58 (0.42; 0.80)** | 0.83 (0.63; 1.11) | 0.96 (0.73; 1.27) | Ref |
| Adjusted | 0.89 (0.64; 1.23) | 0.56 (0.40; 0.79)** | 0.96 (0.71; 1.31) | 1.05 (0.78; 1.42) | Ref |
Cox proportional hazard models were used to study the association between sex steroids and SHBG and all-cause mortality with age at inclusion as the underlying time scale. Data are reported as HRs with 95% confidence intervals, unadjusted and after adjustments for centre, BMI, alcohol intake, smoking, physical activity and the number of comorbidities.
*P < 0.05,
**P < 0.01,
***P < 0.001. Statistically significant values are indicated in bold.
In men with normal total T, the presence of sexual symptoms increased mortality risk. However, men with low total T but no sexual symptoms did not have a higher risk. Also men with low total T and sexual symptoms had a higher mortality risk compared with men with normal total T and no sexual symptoms, but this association was lost after adjustments (Table 3).
Influence of total or free T combined with the presence of sexual symptoms on the risk of all-cause mortality
| n | Deaths N (%) | Unadjusted | Adjusted | |
|---|---|---|---|---|
| Total T and sexual symptoms | ||||
| Total T ≥ 11 nmol/L, no sexual symptoms | 709 | 80 (11%) | Reference group | Reference group |
| Total T ≥ 11 nmol/L, with sexual symptoms | 857 | 280 (33%) | 1.69 (1.30–2.19)*** | 1.45 (1.09; 1.92)* |
| Total T < 11 nmol/L, no sexual symptoms | 78 | 13 (17%) | 1.69 (0.94–3.05) | 1.50 (0.81; 2.79) |
| Total T < 11 nmol/L, with sexual symptoms | 144 | 47 (33%) | 1.54 (1.06–2.24)* | 1.17 (0.77; 1.78) |
| Free T and sexual symptoms | ||||
| Free T ≥ 220 pmol/L, no sexual symptoms | 712 | 76 (11%) | Reference group | Reference group |
| Free T ≥ 220 pmol/L, with sexual symptoms | 795 | 234 (29%) | 1.64 (1.25–2.14)*** | 1.38 (1.03; 1.84)* |
| Free T < 220 pmol/L, no sexual symptoms | 75 | 17 (23%) | 1.71 (1.01–2.90)* | 1.24 (0.68; 2.26) |
| Free T < 220 pmol/L, with sexual symptoms | 206 | 93 (45%) | 2.02 (1.47–2.79)*** | 1.43 (1.00; 2.04)* |
With sexual symptoms: men with ED, lower libido or poor morning erections.
Cox proportional hazard models were used to study the association between testosterone levels + sexual symptoms and all-cause mortality with age at inclusion as the underlying time scale. Data are reported as HRs with 95% confidence intervals, unadjusted and after adjustments for centre, BMI, alcohol intake, smoking, physical activity and the number of comorbidities.
*P < 0.05,
**P < 0.01,
***P < 0.001. Statistically significant values are indicated in bold.
In men with normal free T, having sexual symptoms was related to an increased mortality risk compared with men with normal free T and no sexual symptoms. Finally, in men with low free T and sexual symptoms, the observed higher mortality risk remained after adjusting for confounders, whereas this was not confirmed for men with low free T without sexual symptoms (Table 3).
Discussion
We confirmed that the presence of sexual symptoms, in particular ED, is a strong predictor for all-cause mortality. This association between ED and mortality appears to be robust and is not influenced by total T, free T, oestradiol or SHBG. Furthermore, when combining sexual symptoms and T levels together, men with normal total T (≥11 nmol/L) and sexual symptoms had a higher mortality risk compared with men with normal total T without sexual symptoms. A similar association was observed for men with normal free T (≥220 pmol/L) and sexual symptoms.
ED and mortality
This is the first large European study demonstrating that sexual symptoms, in particular ED, are a more important predictor for mortality than T levels in middle-aged and ageing men. Our results are in line with other prospective cohort studies that have linked ED with higher mortality [4, 20–22]. However, only one Australian cohort study in men aged 70 and older included sex steroids and SHBG as covariates in their analysis and observed only a borderline nonsignificant association between ED and mortality after 7 years of follow-up [5].
ED is very frequent in ageing men. In the Massachusetts Male Ageing Study, >50% of men between 40 and 70 years old reported to have mild, moderate or severe ED [3]. Also in our cohort, 56% of men reported to have ED, infrequent morning erections and/or lower libido. It is well-known that ED is a predictor for the development of cardiovascular disease and mortality [4, 23]. Both conditions share risk factors, such as hypertension and diabetes, as well as underlying pathophysiological mechanisms, such as endothelial dysfunction and atherosclerosis [23, 24]. ED can precede a major cardiovascular event by 2–5 years. Of note, the relative risk of cardiovascular disease and mortality associated with ED is higher in men with an intermediate cardiovascular disease risk score and in younger men [23, 25]. Our results confirm that ED is an important clinical marker of a worse general health status and mortality. This may have important clinical or preventative implications since sexual dysfunction can easily be diagnosed via a sexual history or questionnaire and does not require clinic attendance or extensive and expensive additional diagnostic testing in most men. Further research should focus on the value of sexual symptoms in the field of preventive medicine e.g. including ED in risk scores for cardiovascular prevention in men.
Low testosterone, SHBG and mortality
Although previous analysis of the EMAS data showed that low total and free T are associated with sexual symptoms [8] and that men with late-onset hypogonadism (low T and sexual symptoms) have a higher mortality risk [26], we did not observe a significant mortality risk in men with only low total T or low free T. Several population-based longitudinal cohort studies in ageing men have investigated if low T is predictive of higher mortality, however with inconsistent results, also in studies that used mass spectrometry to measure total T [7, 27–30]. A recent analysis from the UK Biobank including almost 150,000 men showed that men in the lowest quintile of testosterone had a modestly increased mortality risk, both for all-cause and cancer related mortality, but not cardiovascular disease-related mortality [31]. None of these studies included sexual symptoms as confounding factors. Our study strongly suggests that the underlying mechanism of higher mortality is not related to lower T levels, but illustrates that ED is the most important predictor for a higher mortality risk in middle-aged and ageing men. In contrast, lowered libido, which is more closely related to T levels, showed a weaker association with increased mortality.
Men with the highest SHBG levels had a slightly higher mortality risk, but this became borderline nonsignificant after adjusting for confounders (P = 0.051). A recent publication on the UK Biobank data showed that men with a lower SHBG had a lower all-cause, cancer and cardiovascular disease (CVD)-related mortality risk, independently of testosterone [31]. Also in a recent study from Germany, SHBG was directly associated with all-cause mortality in men and women, albeit with a borderline significance [32]. Whether SHBG could be considered as a biomarker for general health or directly modulates mortality risk remains unclear. Nevertheless, the observed association between ED and mortality was independent of SHBG levels.
Strengths and limitations
A major strength of our study is the inclusion of a large cohort of community-dwelling European men with a broad age range. Mortality data were collected up until 14 years after inclusion. Until now, most of the published prospective studies included only older men or had a shorter follow-up. Furthermore, sexual symptoms were investigated by a detailed questionnaire and a substantial proportion of men reported one or more sexual symptoms at inclusion. Finally, sex steroids were measured by state-of-the-art mass spectrometry-based methods. This allowed for a combined analysis of sensitive and specific T measurements and sexual symptoms.
As this is an observational cohort study, we cannot draw firm conclusions about the underlying mechanism. As our primary aim was to investigate the interrelationships between sexual symptoms and sex steroids with all-cause mortality, we provide strong evidence that lowered sex steroid levels are not associated with higher mortality in men with sexual symptoms. We were unable to ascertain survival status in a proportion of subjects recruited to the baseline survey and it is possible that our results may therefore over- or underestimate the true mortality experience of the cohort. It seems unlikely, however, that this would influence our main findings, which were based on an internal comparison of those who contributed data. It was also not possible to obtain specific information about the cause of death, so we cannot distinguish between cardiovascular disease related mortality and other causes.
Data concerning T levels were based on single as opposed to repeated measurement; however, the key hormone of interest, T, is not a labile analyte. Single measurements of T on morning samples can provide representative and reliable data in large epidemiological studies [33]. Our estimate of free T was based on calculation rather than direct measurement, but it has been shown that the Vermeulen method has an excellent correlation with measured free T [34]. Finally, our results, accrued from a community-dwelling European population, should be extrapolated beyond this setting only with caution.
Conclusion
Men with sexual symptoms, especially ED, have a higher mortality risk, but this risk is not influenced by their sex steroid levels. In community dwelling men, sexual symptoms can thus be an early warning sign of a poor or worsening health status, and an indication of an increased risk for mortality irrespective of T levels.
Declaration of Conflicts of Interest
L.A. participated on Advisory boards for Galapagos/Gilead and received conference support from Pfizer, Ipsen, Novartis, Novo Nordisk.
Declaration of Sources of Funding
The European Male Ageing Study is funded by the Commission of the European Communities Fifth Framework Programme ‘Quality of Life and Management of Living Resources’ Grant QLK6-CT- 2001–00258. The study was supported by Versus Arthritis (grant number 21,755) and the NIHR Manchester Biomedical Research Centre. The views expressed are those of the authors alone and not necessarily those of the NHS, the NIHR, the Department of Health and Social Care or Public Health England.
Acknowledgements
We thank the men who participated and the research and nursing staff in all EMAS centres. Part of this research was presented at the annual meeting of the Endocrine Society 2020 (online abstract) and LA was awarded with an ‘Outstanding Abstract Award’. It was also presented at the annual meeting of the Belgian Endocrine Society 2020 (oral presentation during livestream meeting) and LA received a ‘Young Investigator Award’. We also acknowledge the members of the European Male Ageing Study Group: Gianni Forti, Luisa Petrone, Giovanni Corona, Giulia Rastrelli, Mario Maggi (Florence), Dirk Vanderschueren, Jos Tournoy, Herman Borghs, Leen Antonio (Leuven), Krzysztof Kula, Jolanta Slowikowska-Hilczer, Renata Walczak-Jedrzejowska (Łódz), Ilpo Huhtaniemi (London), Aleksander Giwercman (Malmö), Frederick Wu, Alan Silman, Terence O’Neill, Joseph Finn, Stephen Pye, (Manchester), Felipe Casanueva, Ana B Crujeiras (Santiago), Gyorgy Bartfai, Imre Földesi, Imre Fejes (Szeged), Margus Punab, Paul Korrovitz (Tartu).
References
Author notes
The European Male Ageing Study Group: Gianni Forti, Luisa Petrone, Giovanni Corona, Giulia Rastrelli, Mario Maggi (Florence), Dirk Vanderschueren, Jos Tournoy, Herman Borghs, Leen Antonio (Leuven), Krzysztof Kula, Jolanta Slowikowska-Hilczer, Renata Walczak-Jedrzejowska (Łódz), Ilpo Huhtaniemi (London), Aleksander Giwercman (Malmö), Frederick Wu, Alan Silman, Terence O’Neill, Joseph Finn, Stephen Pye, (Manchester), Felipe Casanueva, Ana B. Crujeiras (Santiago), Gyorgy Bartfai, Imre Földesi, Imre Fejes (Szeged), Margus Punab, Paul Korrovitz (Tartu).

Comments