


Abstract
Time to surgery (TTS) increases mortality risk in old patients with proximal femur fractures (PFFs). Orthogeriatric care pathways reduce mortality and length of stay, but the interaction between TTS and geriatric intervention remains unclear.
To identify organisational variables—including geriatric intervention—that are predictive of 90-day mortality and explore their interactions with TTS.
This retrospective study included 7756 PFFs aged over 60 who underwent surgery between 2005 and 2017. Organisational factors influencing 90-day mortality (main outcome) were identified in an administrative database using log-rank tests. Variables such as a mobile geriatric team (MGT) intervening in the emergency department were screened. Selected variables were included in a Cox model alongside TTS and the AtoG score, a validated multidimensional prognostic tool (from 0 no comorbidity to ≥5). Statistical interactions between TTS and organisational variables were calculated.
MGT was one of the rare organisational variables with a protective effect: hazard ratio (HR) = 0.81, CI 95% [0.68–0.98], P = 0.03. MGT’s strongest effect was for TTS up to 1 day (HR = 0.70, CI95% [0.53–0.92], P = 0.01) and then decreased beyond 2 days (HR = 0.97, CI95% [0.73–1.3], P = 0.08). In patients with an AtoG score ≤ 2, MGT was the strongest parameter: HR = 0.76, CI95% [0.60–0.93], P = 0.03, while the HR for TTS was 1.01 CI 95% [0.99; 1.02], P = 0.15. In patients with an AtoG>2, there was a synergic interaction between MGT and reduced TTS (P = 0.05).
Geriatric intervention modulated the effect of TTS on 90-day mortality up to a TTS of 2 days. MGT had a positive impact on both vulnerable and earthier patients.
Key points
Geriatric intervention modulates the effect of time to surgery on 90-day mortality.
In less vulnerable patients, geriatric intervention outweighed the effect of time to surgery.
In most vulnerable patients, there was a synergic interaction between geriatric intervention and reduced time to surgery.
The effects of the geriatric intervention diminish beyond a time to surgery of 2 days.
Introduction
Managing proximal femur fractures (PFFs) is demanding, requiring diverse medical and paramedical resources such as nurses, physiotherapists and social workers [1]. Speed of care is a crucial aspect of management. Hospitals worldwide are evaluating innovative care models to accelerate surgery and optimise management [2–4]. The current recommended ideal time to surgery (TTS, from admission to the emergency department to surgery) is 36–48 hours, depending on guidelines [5, 6].
Orthogeriatric pathways, emerging in the 2000s, revolutionised care, meeting two key objectives: resources and speed. These pathways lower mortality and length of stay [7–11], with potential benefits such as fewer complications, better mobility, psychological health and reduced costs [2, 9, 12–15].
The definition of orthogeriatric structures varies between hospitals. It can be a genuine medical-surgical unit or occasional specialised consultations [7–9, 16, 17].
Between the ideal of 48-hour surgery in a specialised environment and real practice, many factors cause variations, such as anticoagulation therapy or limited hospital resources, especially access to the operating theatre [18–20]. Hospital resources and organisations are unique, intertwined in territorial grids and contextual within a specific population.
The individual benefits of TTS and orthogeriatric pathways are well-established, yet their interaction remains uncertain. The principles of preoperative medical optimisation and clearance for surgery are particularly crucial for the most vulnerable patients. However, optimisation can sometimes be time-consuming, potentially delaying TTS. It is still unclear whether such optimisation provides significant advantages or if prioritising a faster TTS is more important [21]. France has many national healthcare databases. Medically, the ‘Échantillon Généraliste des Bénéficiaires’ (Generalist Sample of Beneficiaries, GSB) allows for complex analyses of medical outcomes based on coding [22]. Healthcare facilities publish their resources annually in the Annual Statistics of Care Facilities (ASCF) register, with over 4500 parameters, including beds, operating theatres and staff [23]. The merging of GSB data with ASCF data is possible, enabling the analysis of the impact of organisational factors and resources on the management of PFFs.
The objective of this study was to identify organisational variables predicting mortality in the ASCF databases and then study the interactions with TTS.
Material and methods
Study design and setting
This retrospective longitudinal study uses the French National Social Security database (GSB), created in 2005. GSB is a 1/97 representative sample of the French population; the number of participants steadily increased from 507 000 in 2005 to 602 000 in 2011. Preliminary studies confirmed that GSB represents the French population by age and gender [22]. GSB aggregates data from multiple administrative databases. The GSB holds primary diagnoses, associated comorbidities and surgical procedures for care facility admissions. Diagnoses are coded using the International Classification of Diseases (ICD). GSB also includes civil data such as birth and death dates (updated periodically).
GSB participants are blindly selected based on a unique characteristic of their social security number. Once entered, civil and medical data from 2005 to 2018 were regularly updated. Patients never exit GSB; the deceased remain, but their data stop updating.
GSB access is strictly regulated and restricted to accredited researchers. Under French law, Ethics Committee review is not needed as access is permanently certified.
Participants
The selection criteria were patients over 60 years old admitted to a care facility who underwent any surgery to treat a PFF on a native hip between 2005 and 2017. The selection was performed using the combination of ICD-10 code S72 for the diagnosis and the coding of surgical treatment within a coherent panel of procedures. Initially, there were 8026 fractures in 7561 patients. As detailed in two previous studies on the same dataset, it was not possible to merge clinical information for some fractures, and the analyses for the current study were conducted on 7756 fractures [24, 25].
Outcomes and follow-up
The primary outcome was mortality up to 90 days postoperatively. Follow-up was extended until December 2018 for this primary outcome; the GSB thoroughly assesses death with no missing values.
The secondary outcomes included medical complications during hospitalisation and length of stay. Associated diagnoses to the main fracture diagnosis were collected and triaged according to their severity. The Clavien–Dindo classification for complication seriousness was used [26], ranging from 1 (minor complication) to 5 (death).
Variables and their sources
This study aimed to identify organisational prognostic variables. These databases describe healthcare facilities with ~4500 variables across 50 spreadsheets (sector-dependent), updated annually. The key element is the establishment ID, identical to GSB, allowing GSB-ASCF data merging. ASCF databases on personnel (medical/paramedical), activity volume, geriatric teams and facility type (public/private) were used; 265 variables were screened. Other variables were parameters previously identified as significant prognostic factors for mortality in two previous studies using the GSB database. Among them, the AtoG prognostic score was developed and validated beforehand; its performance is superior to the Charlson comorbidity score [24]. The fundamental principles of AtoG are simplicity, with 1 point per item, and multidimensionality in accordance with Rockwood's comprehensive geriatric assessment [27]. AtoG is the abbreviation for ABCDEFG, meaning Age, any Brain or neurological pathology, any severe Comorbidity such as organ failure, unDernutrition, Environment and social issues, other Fractures and male Gender. AtoG is, therefore, a score ranging from 0 to 7, with 0 representing patients without comorbidities; upper ranges were gathered (≥5). TTS (from admission to ED to surgery, in days) was also confirmed as a powerful prognostic factor in the GSB. Patients with long-term use of anticoagulants were detected using the ICD code Z921.
Bias
The primary source of bias was missing data for the explanatory variables; as mentioned earlier, there were no missing data for the mortality. All missing data are described in Table 1. In the ASCF, data are updated annually, so the LOCF technique (Last Observation Carry Forward) was used to reconstruct missing values using previous years' data (for instance, ‘Mobile Geriatric Team’ coded 1 in 2016 and ‘NA’ in 2017). Second, some variables are similar, for example, the number of consultations by an MGT and the presence of an MGT; missing values for key variables were reconstructed using related variables.
Description of the numeric and categorical variables
| Variable | n | Missing | Mean | Median | SD | Q1 | Q3 | Min | Max |
|---|---|---|---|---|---|---|---|---|---|
| Age | 7756 | 0 | 83.12 | 84 | 8.56 | 78 | 89 | 60 | 108 |
| Follow-up | 7756 | 0 | 1274.03 | 1002.5 | 1095.95 | 394 | 1909 | 0 | 5442 |
| Length of Stay | 7756 | 0 | 12.02 | 10 | 7.59 | 8 | 14 | 0 | 139 |
| Surgical delay (days) | 6516 | 1240 | 2.24 | 1 | 3.89 | 1 | 3 | 0 | 185 |
| Follow-up (years) | 7756 | 0 | 3.48 | 3 | 3.03 | 1 | 5 | 0 | 15 |
| Variable | Level | Count | Proportion | ||||||
| Gender | Female | 5533 | 5533/7204 (76.8%) | ||||||
| Male | 1671 | 1671/7204 (23.2%) | |||||||
| Missing | 552 | 552/7756 (7.12%) | |||||||
| Type Of Treatment | Arthroplasties | 3013 | 3013/6773 (44.49%) | ||||||
| Trochanteric Fixations | 3760 | 3760/6773 (55.51%) | |||||||
| Missing | 983 | 983/7756 (12.67%) | |||||||
| AtoG score | 0 | 1840 | 1840/7204 (25.54%) | ||||||
| 1 | 2661 | 2661/7204 (36.94%) | |||||||
| 2 | 1768 | 1768/7204 (24.54%) | |||||||
| 3 | 684 | 684/7204 (9.49%) | |||||||
| 4 | 215 | 215/7204 (2.98%) | |||||||
| ≥ 5 | 36 | 36/7204 (0.5%) | |||||||
| Missing | 552 | 552/7756 (7.12%) | |||||||
| Medical complications (Clavien Dindo) | 0 | 4088 | 4088/7204 (56.75%) | ||||||
| 1 | 178 | 178/7204 (2.47%) | |||||||
| 2 | 2110 | 2110/7204 (29.29%) | |||||||
| 3 | 209 | 209/7204 (2.9%) | |||||||
| 4 | 375 | 375/7204 (5.21%) | |||||||
| 5 | 244 | 244/7204 (3.39%) | |||||||
| Missing | 552 | 552/7756 (7.12%) | |||||||
| Death at last FU | No | 2979 | 2979/7756 (38.41%) | ||||||
| Yes | 4777 | 4777/7756 (61.59%) | |||||||
| Missing | 0 | 0/7756 (0%) | |||||||
| 90 day mortality | No | 6934 | 6934/7756 (89.4%) | ||||||
| Yes | 822 | 822/7756 (10.6%) | |||||||
| Missing | 0 | 0/7756 (0%) | |||||||
| Type of Structure | Public | 5866 | 5866/7756 (75.63%) | ||||||
| Semi Private | 1628 | 1628/7756 (20.99%) | |||||||
| Private | 262 | 262/7756 (3.38%) | |||||||
| Missing | 0 | 0/7756 (0%) | |||||||
| Orthogeriatrics | No | 1403 | 1403/5516 (25.44%) | ||||||
| Yes | 4113 | 4113/5516 (74.56%) | |||||||
| Missing | 2240 | 2240/7756 (28.88%) | |||||||
Through sensitivity analysis, the robustness of the results was tested for missing values. Missing data were reconstructed using multiple imputation methods (MICE R package, Random Forest method) [28]. Twenty alternative scenarios were produced. The models were tested in the original dataset (complete case analysis) and in the 20 alternative datasets. Coefficients and P-values were pooled. The results were considered robust if the coefficients and P-values remained stable.
Statistical methods
Numerical variables were described with their mean, median, standard deviation (SD) and count of missing values. Categorical variables were described with the count of observations per level, their proportion relative to the total population and the number of missing values.
The first step was selecting variables in the ASCF databases, individually tested for 90-day mortality using log-rank tests. Variables significantly associated with 90-day mortality were pre-selected and then tested for their clinical and statistical relevance; the threshold was a P-value <0.05 with the log-rank test. Clinical relevance meant that the variables had to have a clinical relationship with PFFs. For example, if the ‘number of operating rooms’ or ‘24/7 trauma theatre’ were pre-selected, they were entered in the multivariable analysis, while the ‘number of urologic procedures’ was not. Statistical relevance corresponded to the absence of collinearity between variables, meaning that there was no association whatsoever between variables (such associations bias the estimates). For example, the presence of a mobile geriatric unit and the number of geriatric evaluations by the mobile geriatric unit were collinear. In the case of collinear variables, the ones most significantly associated with mortality and with the fewest missing data were retained. Variable collinearity was tested using Student's t-tests or chi-square tests.
A final database was created by merging the GSB database with the selected ASCF variables. The selected variables were then tested in multivariable Cox regressions for 90-day mortality. TTS and the AtoG score were forced into the models because they were identified as significant prognostic factors. However, there is proven collinearity between AtoG and TTS (patients with comorbidities had longer TTS). To account for both TTS and AtoG in the same model, stratification on TTS was performed: ≤1, ≤2, ≤3; AtoG was included as a continuous variable among the explanatory variables. Interactions between different prognostic variables were sought in the regressions.
Selected variables were then tested for in-hospital complications and length of stay. Generalised logistic regressions were used.
Risks were expressed with HRs for 90-day survival and odds ratios (ORs) for medical complications. The alpha risk was set at 5%. For sensitivity analyses, pooled HRs, ORs and P-values will be noted as HRpooled, ORpooled and ppooled, respectively.
Results
Cohort characteristics are detailed in Table 1. The mean age was 83 years (SD: 8.5), with 5533/7756 women (71%). There were 3760/6773 (55.51%) treatments for trochanteric fractures and 3013/6773 (44.49%) arthroplasties. A total of 543/7756 patients had long-term anticoagulants.
Selection of variables in the Annual Statistics of Care Facilities databases
Of the 265 ASCF variables screened, nine were pre-selected. After eliminating variables without clinical relevance, 4/9 variables were selected: the presence of at least one geriatric unit in the facility, ‘MGT’: the presence of an MGT intervening in emergencies, the number of evaluations performed by the MGT and the number of junior surgeons in the orthopaedic department. Since MGT and the two other related variables were entirely dependent on each other, only MGT was retained. The number of junior surgeons will be subject to dedicated analysis in a subsequent study.
Facilities with an MGT had higher surgical activity: +3.64 fractures on average over the period 2005–2017 CI 95% [2.5; 4.8] P < 10−4 in the GSB, or about 30 more fractures per year in the total population.
Risk factors for 90-day mortality in the overall cohort
AtoG was already known as a risk factor for 90-day mortality: HR = 17, CI 95% [16;18] P < 10−4 (Table 2). MGT was a protective factor for 90-day mortality: HR = 0.82 CI 95% [0.68;0.98] P = 0.03 (Figure 1). With sensitivity analysis, HRpooled = 0.83 CI 95% [0.69;0.99] ppooled = 0.04.
Variables associated to the 90-day mortality (ref = reference for categorical variables)
| Variable | Level | HR | 95% CI | P Value |
|---|---|---|---|---|
| Age | 1.06 | 1.050, 1.070 | <10−4 | |
| Gender | Ref Females | - | - | - |
| Males | 1.751 | 1.507, 2.035 | <10−4 | |
| Type Of Treatment | Ref Arthroplasties | - | - | - |
| Trochanteric Fixations | 1.047 | 0.903, 1.215 | 0.542 | |
| Charlson’s Comorbidity Index | 1.089 | 1.073, 1.106 | <10−4 | |
| AtoG score | 1.693 | 1.598, 1.793 | <10−4 | |
| Surgical delay (days) | 1.015 | 1.007, 1.023 | <10−4 | |
| Type of Structure | Ref Public | - | - | - |
| Semi Private | 0.955 | 0.805, 1.132 | 0.595 | |
| Private | 0.928 | 0.627, 1.373 | 0.708 | |
| Orthogeriatrics | Ref No | - | - | - |
| Yes | 0.821 | 0.687, 0.981 | 0.030 | |
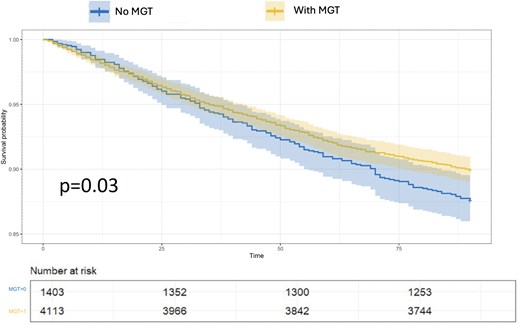
90-day survival curves based on the presence of an MGT or not.
MGT was not associated with the AtoG score (P = 0.27), and these two variables were thus entered into the Cox regression with stratification on TTS. MGT and AtoG maintained a significant association with 90-day mortality: HR = 0.81 CI 95% [0.68;0.98] P = 0.03 and HR = 1.69 CI95%[1.58; 1.81] P < 10−4 for MGT and AtoG, respectively. The result for AtoG was robust: HRpooled = 1.68 CI 95% [1.58;1.78] ppooled < 10−4; for MGT, HRpooled was similar, but ppooled did not reach the significance threshold: HRpooled = 0.86 CI 95% [0.73;1.01] ppooled = 0.06. MGT's effect was strongest for patients with TTS up to 24 hours: HR = 0.70 CI 95% [0.53; 0.92] P = 0.01; HRpooled = 0.75 C I9 5% [0.58;0.97] ppooled = 0.03 (Figure 2). The effect of MGT was weaker and less robust for TTS ≤2 and ≤ 3 days: HR = 0.82 CI 95% [0.64;1.04] P = 0.1 and HR = 0.80 CI 95% [0.64;1] P = 0.05, respectively (HRpooled = 0.80 CI95%[0.63;1.02] ppooled = 0.07 and HRpooled = 0.79 CI95%[0.64;0.96] ppooled = 0.02). Overall, MGT had no effect on 90-day mortality after adjustment with AtoG, with a TTS beyond 2 days: HR = 0.97 CI 95% [0.73;1.3] P = 0.08; HRpooled = 0.92 CI 95% [0.69;1.2] ppooled = 0.62 (Figure 3). The overall MGT/TTS interaction did not reach the significance threshold (P = 0.07).
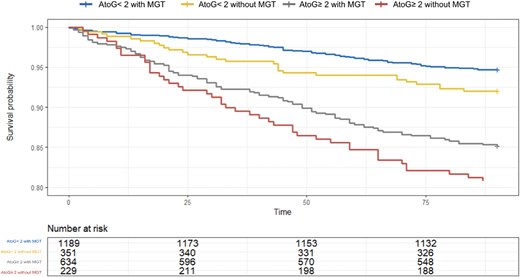
90-day survival curve based on AtoG and the presence of an MGT for a TTS of less than 2 days. There is a significant decrease in mortality with MGT, for all figures of AtoG.
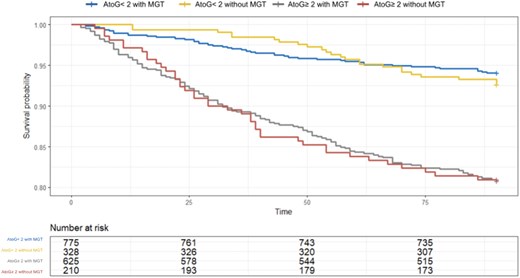
90-day survival curve based on AtoG and the presence of an MGT for a TTS from 2 days onwards. There is no longer a decrease in mortality with MGT.
The most and less vulnerable patients
A total of 1478 fractures had an AtoG score > 2, meaning that they were above the third quartile; these patients were considered the most vulnerable. In this subgroup, MGT was a non-significant protective factor (HR = 0.77 CI 95% [0.56;1.01] P = 0.11). Similarly, a TTS of less than 2 days was also a non-significant protective factor (HR = 0.77 CI 95% [0.58;1.01] P = 0.06). However, there was a significant interaction term between TTS and MGT, indicating that the combination of a TTS of less than 2 days and MGT produced an even more protective effect: HR = 0.51 CI 95% [0.26;1] P = 0.05. The interaction effect disappeared beyond a TTS of 3 days.
Among the most vulnerable patients, 1375/1478 were not on long-term anticoagulation, so it was assumed that the TTS was not related to anticoagulation. Similar results were found for this subgroup, with a significant interaction effect for the combination TTS less than 2 days and MGT: HR = 0.48 CI 95% [0.23;1] P = 0.05.
The interaction age/MGT did not reach significance (P = 0.06), but the effect of MGT tended to decrease with age: HR = 0.44 CI95%[0.17;1.1] P = 0.09, HR = 0.64 CI 95% [0.42;0.99] P = 0.04 and HR = 0.87 CI95%[0.71;1.1] P = 0.18, for age range 60–70, 71–80 and > 80, respectively.
For fractures with an AtoG score ≤ 2 (less vulnerable), MGT was the strongest prognostic factor for mortality: HR = 0.76 CI 95% [0.60;0.93] P = 0.03 (HRpooled = 0.80 CI 95% [0.65;0.99] ppooled = 0.04); the HR for TTS was 1.01 CI 95% [0.99;1.02] P = 0.15 (HRpooled = 1.01 CI95% [1.01;1.02] ppooled = 0.001).
Inpatient complications and length of stay
Of the 3116 patients with complications, 619 had life-threatening complications (Clavien–Dindo ≥4). MGT did not affect the occurrence of postoperative complications, regardless of the type of complication: OR = 1.01 CI 95%[0.89;1.15] P = 0.84 and ORpooled = 1.04 CI 95%[0.89;1.23] ppooled = 0.56. MGT was associated with a mean decrease of 0.7 days in the length of stay CI 95%[−1.2;-0.3] P = 0.003 (ppooled = 0.005).
Discussion
According to the official definition, MGT is ‘necessarily multidisciplinary, it includes a senior geriatric physician, a registered nurse, a part-time social worker, a secretary, and a part-time occupational therapist. This team provides geriatric advice for the care of frail older adults. It intervenes at the request of emergency departments and all hospital services’ [23]. MGT significantly protected against 90-day mortality, most notably for TTS ≤2 days, with a diminishing effect beyond. In the most vulnerable patients, MGT and TTS <2 days acted synergistically. The interaction remained in patients without long-term anticoagulation, where surgical delay was likely unrelated. In less vulnerable patients, TTS had little effect on 90-day mortality, but MGT remained strongly protective. MGT did not lower complications but significantly reduced hospital stays.
Most studies show that geriatric intervention reduces hospital stay, TTS and mortality [7–11]. Postoperative confusion is often described as reduced [9, 11]. However, reductions in complications and financial costs remain uncertain [2, 9, 12]. Our study supports reduced length of stay and mortality. We found no complication reduction, but improved MGT management likely enhanced mortality. Sletvold et al. suggested that orthogeriatric pathways benefit younger, more functional patients most in terms of mortality [29]. Patients with low AtoG, minimal TTS and MGT showed the best survival, supporting Sletvold et al. Our study showed that MGT’s protective effect vanished with prolonged TTS; benefits remained up to 3 days, peaking at 1 day. More studies are needed to clarify MGT’s declining effect beyond 2 days. A balance likely exists between MGT, complications and patient performance status decline. This balance of factors is not so clear; Fluck et al. did not find any significant increase in pressure ulcers with TTS [30], and Vidán et al. did not find a significant relationship between delay and complication after adjusting for initial acute conditions causing delay [31].
This study of orthogeriatric pathways is closely tied to TTS. The impact of TTS on mortality remained debated until around 2010, and the development of national databases allowed for a clear link between TTS and mortality to be established [32–35]. The literature generally establishes a maximum TTS of 24 to 48 hours [36]. TTS and geriatric intervention are among the few modifiable factors. Ravery et al. demonstrated that organisational causes were the most frequent for explaining delays, notably a problem accessing the operating room in about 20% of cases [18]. Luke et al. found that a lack of personnel was an important cause of delay in care, especially showing a proportional relationship between reduced night staff in emergency and increased delay [19]. TTS is a sensitive variable from a medico-legal perspective, and there are situations where rapid surgical intervention is not feasible. An Australian study found 35% operated after 24 hours [37]; our rate was 50%. Our results suggest that up to 2 days, geriatric intervention modulates TTS effects, especially in patients with few comorbidities.
The fast-track concept is widely debated. This principle, from Anglo-Saxon countries, focuses on reducing TTS by expediting operating room access after ‘medical clearance’ [4, 38]. ‘Fast track’ may misleadingly suggest a race to cut TTS; it must also include geriatric care and optimisation. As Ng et al. detailed, while staying within reasonable TTS, the additional time required for optimisation is not detrimental [21]. Optimisation involves the prevention and management of initial complications of fractures. The Association of Anaesthetists of Great Britain and Ireland provides a list of seven acceptable reasons for delaying surgery, such as haemoglobin <80 g/L or a chest infection [6]. The original sense of the orthogeriatric pathway is the presence of a dedicated unit for perioperative geriatric care (POGC) where geriatrics and orthopaedics coexist in collaboration with anaesthesia and paramedical staff such as physiotherapists or nutritionists. In one of the original definitions of POGC in 2014, there was the key notion of rapid care with triage starting in emergencies. The speed of multidisciplinary care—starting in emergency departments for early optimisation—remains a central concept today [3, 6, 39–41]. Some hospitals are still studying options for optimising multidisciplinary care pathways, including before emergencies [2, 3]. As detailed above, the ‘MGT’ intervenes at the request of emergency departments; this reinforces the importance of early geriatric intervention.
The MGT does not perfectly match the POGC definition as a dedicated unit, and POGC was not coded in ASCF databases. It is likely that some hospitals coded with an MGT also had a POGC, but it is also possible that some establishments coded with an MGT only had an MGT. This leads to variations in the definition of orthogeriatric intervention in the literature. There are POGC-type interventions where patients are hospitalised in geriatrics with orthopaedic consultation or in orthopaedics with geriatric opinion [7–9, 16, 17, 42]. Grigoryan et al. showed in a meta-analysis that the model with geriatric consultation is effective and allows for a significant reduction in mortality [7]. Our data support at least a geriatric opinion.
Registers have many limitations. There may be coding errors or omissions. It is possible that procedures or primary or secondary diagnoses were not coded during this period. The imprecision involves, for instance, the operated side or the inability to clearly distinguish femoral neck from trochanteric fractures. Huff et al. found that trochanteric fractures were at a higher risk of mortality [43], which did not emerge in this study. The second limitation involves the unclear care pathway of patients before and after admission. For example, Erivan et al. demonstrated that institutionalised patients have an increased risk of mortality [44]. A lack of power might seem to explain the non-significant MGT/TTS interaction, but retrospective calculations show that with over 1000 fractures, power would reach 100% (R Package powerSurvEpi). Since these calculations are based on our data without external validation, the power remains debatable. The loss of information during data manipulation—as detailed in the methods section—is one of the reasons for the reduced statistical power. We assume that it was a ‘completely at random’ information loss, but there is no formal proof. Finally, the inclusion period from 2005 to 2017 is a limitation. Medical practices evolved significantly over this period, and as mentioned earlier, the emergence of orthogeriatric structures falls within this timeframe. It is likely that care has changed even further between 2017 and 2025.
Conclusion
In PFFs, early geriatric intervention modulates TTS’s effect on 90-day mortality, especially in less fragile patients. In vulnerable patients, it synergizes with expedited TTS. Its benefit declines with TTS >2 days, but TTS remains crucial; the best mortality outcomes occur with few comorbidities, TTS <2 days and an MGT. ‘Fast-tracking’ is not just shortening TTS—it requires transdisciplinary geriatric care.
Declaration of Conflicts of Interest:
None.
Declaration of Sources of Funding:
None.

Comments