


Abstract
clinical trials dedicated to the older patients with cancer are essential to help to define optimal cancer therapy for this rapidly growing population. Our study aimed to analyse the characteristics and the evolution of older-patient-specific oncological trials registered in ClinicalTrials.gov.
a dataset of 61,120 oncological trials registered in ClinicalTrials.gov between 2000 and 2019 was downloaded. Characteristics of older-patient-specific trials were compared with characteristics of age-unspecified trials. Chronological shifts in older-patient-specific trials were also analysed.
of the 49,273 interventional trials eligible for analysis, only 490 (1.0%) were older-patient-specific. More than half of the older-patient-specific trials were phase 2 and enrolled less than 100 patients. Compared with age-unspecified trials, older-patient-specific trials were less likely to be funded by industry (26.9 vs 37.1%), and more likely to be conducted in Europe (44.5 vs 28.3%). During the two time periods between 2000 and 2009, and 2010 and 2019, the proportion of supportive care-oriented trials increased from 1.9 to 13.9%. Concerningly, the use of clinically meaningful end points in older patients such as disease-specific survival, patient-reported outcomes and functional status as a primary end point was uncommon (0.4, 8.1 and 7.3%, respectively). There was no correlation between the number of trials for a given cancer type and relative incidence and mortality. 196/490 (40.0%) of the trials were conducted for patients with haematological cancer.
our study helps us to better understand the current state of older-patient-specific oncological trials and provide insights for future development, resulting in the improvement of the care of older patients with cancer.
Key Points
We present a first snapshot of older-patient-specific clinical trials in the field of oncology.
Of 49,273 oncological interventional trials registered in ClinicalTrials.gov, only 1.0% were older-patient specific.
There were significant variations between the older-patient-specific and age-unspecific trials.
The distribution of trial density across cancer types did not parallel the respective distribution of disease burden.
The results provide insights for future development that can improve the care of older patients with cancer.
Introduction
The burden of cancer has been increasing throughout the world, especially among the older population with demographic ageing. More than 60% of cancers occur in people aged 65 years or older, and about 70% of the deaths due to cancers occur in this age group [1]. This results in health and socio-economic challenges. However, oncologists currently have little evidence-based information for the management of older cancer patients in clinical practice, leading to under-treatment or over-treatment of this increasingly growing population [2]. This is mainly because older patients are under-represented in oncological clinical trials [3–5], even though a series of guidelines have been established to increase and improve clinical research in the field of geriatric oncology by medical societies such as the European Organization for Research and Treatment of Cancer (EORTC), the American Society of Clinical Oncology (ASCO) and the International Society for Geriatric Oncology (SIOG) [6–9].
Current data on the management of older cancer patients are mostly extracted from subgroup analyses in age-unspecified clinical trials, which can only be regarded as preliminary evidence. It has been shown that oncological trials specific to older patients can provide better quality care and help to define the optimal cancer therapy in the older population. Older patients who participate in older-patient-specific trials experience lower rates of adverse events (AEs) and achieve comparable survival advantages, compared to those who are recruited in age-unspecific trials [10, 11]. However, data about the current state of clinical trials conducted specifically in older patients are lacking. ClinicalTrials.gov (https://clinicaltrials.gov/) is the largest database of clinical trials worldwide, and is now recognised as a promising source of information to facilitate the systematic assessment of clinical trials to improve clinical practice [12, 13]. In this cross-sectional analysis, we aimed to characterise the features of clinical trials specifically focused on the population of geriatric patients with cancer using the ClinicalTrials.gov database.
Methods
Creation of the ClinicalTrials.gov dataset
We conducted a cross-sectional analysis of oncological trials focusing on older patients registered in ClinicalTrials.gov (https://clinicaltrials.gov/). The ClinicalTrials.gov query and data download were performed on 17 December 2019, two decades after the launch of the registry. This study was considered exempt by the Institutional Review Board of Union Hospital, Tongji Medical College, Huazhong University of Science and Technology as it did not represent human participant research. We searched ClinicalTrials.gov using the keyword ‘Cancer’ as recruitment. In total, 61,119 registered clinical studies were identified. Two oncologists manually and independently reviewed all the trials, and a third one was consulted to resolve any disagreements. Finally, we restricted our analysis to interventional oncological trials registered between 1 January 2000, and 17 December 2019 (n = 49,273) (Figure 1).
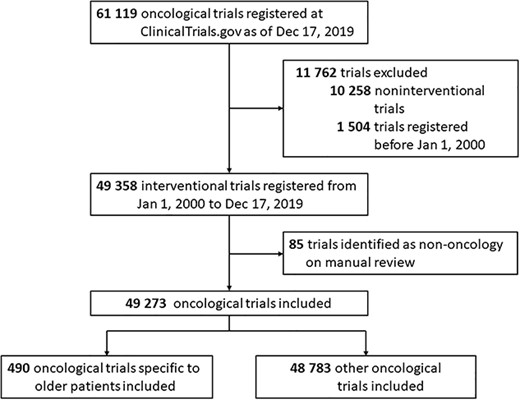
Flowchart identifying trials registered on ClinicalTrials.gov from 2000 to 2019.
In order to classify these trials as older-patient-specific, we used the field of ‘minimum age’. Trials using a lower age limit of 65 years or older were considered older-patient specific and were divided into two temporal subsets (1 January 2000, to 31 December 2009, and 1 January 2010, to 17 December 2019) to investigate the chronological shifts.
Study variables
The following 18 trial characteristics were assessed: (i) whether the trial was registered before participant enrollment; (ii) presence or absence of a data monitoring committee; (iii) trial phase; (iv) number of enrolled patients; (v) number of study arms; (vi) blinding methods; (vii) allocation; (viii) primary purpose of intervention; (ix) sponsor; (x) number of facilities; (xi) number of regions; (xii) trial site regions; (xiii) recruitment status; (xiv) type of intervention; (xv) sex of participants; (xvi) cancer types that each trial targeted; (xvii) lower age limits and upper age limits; and (xviii) end points. Funding sources were identified as National Institutes of Health (NIH), industry and other based on the submitted information of the field of ‘sponsor’, which comprised lead sponsors and collaborators. A trial was classified as NIH-funded if its lead sponsor or one of its collaborators were from the NIH without any from the industry, and industry-funded if its lead sponsor or one of its collaborators was from the industry without any from the NIH. The remaining were classified as ‘other’, which represented the trials funded by other government or academic institutions.
Definition of trial end points
Two oncologists manually and independently identified all primary and secondary end points using the fields of ‘outcome-title’, ‘outcome-description’ or the detailed information of the submitted trials. Similarly, if there was any disagreement, the third oncologist was consulted. End points were divided into standard and patient-centred ones. The former included overall survival (OS), disease-specific survival (DSS), composite and tumour-centred end points, biological parameters, AEs, pharmacokinetics and pharmacodynamics (PK-PD). The latter included completion of treatment, patient-reported outcomes (PROs), functional, cognitive and nutritional status, healthcare utilisation and economical end points. OS was defined as the period from randomisation/initiation to death from all causes, and DSS as the period from randomisation/initiation to death from specific cancer. Composite end points were a combination of different ones in a defined end point (Supplementary Table 1). Tumour-centred end points contained all measures of tumour evolution (including radiological assessment and biological markers evolution). AEs were defined as medical problems that occurred during treatment due to therapies or other factors, and completion as achieving the planned dose intensity of treatment, as well as compliance. Biological parameters included laboratory, genetic and tumour biology outcomes. As defined by the Food and Drug Administration, PROs referred to any report of health condition status that came directly from the patient, without interpretation by a clinician or anyone else [14]. Healthcare utilisation included healthcare use, readmission, length of hospital stay and other resources.
Statistical analysis
Categorical variables are described as frequencies and percentages, whereas continuous ones as medians and interquartile ranges (IQRs). Missing values were excluded from the analyses unless they could be inferred based on other related data. To compare trial characteristics and the evolution over the two temporal subsets, the Pearson’s χ2 test was used, as well as Fisher’s exact test, if indicated. Data regarding cancer incidence and mortality in older cancer patients (age ≥ 65 years old) in 2017 were obtained from the Surveillance, Epidemiology and End Results Program (SEER). The number of older-patient-specific trials by cancer type was compared with the relative incidence and mortality for that cancer type. The correlation between the number of trials for a given type of cancer and the corresponding incidence or mortality was calculated using Spearman rank correlation statistic. Statistical significance was set at P < 0.05 (two-sided). All analyses were performed using SPSS version 23.0 (IBM Corp).
Results
Age eligibilities of older-patient-specific oncological trials
Of the 49,273 registered interventional oncological trials registered between 1 January 2000, and 17 December 2019, 1.0% (n = 490) were specific to older patients (Figure 1). The most frequently used thresholds to define age were 70 years (44.9%), and 65 years (42.9%) (Supplementary Figure 1).
Characteristics of older-patient-specific oncological trials
Table 1 shows the trial design characteristics of the oncological trials included in this study. Phase 2 trials accounted for the highest proportion of trials specific to older patients as well as other oncological trials (58.7 vs 43.4%, respectively). Older-patient-specific trials were significantly less likely to be phase 1 (8.7 vs 24.5%; P < 0.001) and more likely to be larger scale studies than other oncological trials. The median number of patients per trial was 73.5 (IQR, 38.0–180.0) for trials specific to older patients and 51.0 (IQR, 25.0–128.0) for other oncological trials. Regarding the primary purpose of the study, trials specific to older patients were more likely to be supportive care oriented (10.0 vs 5.8%; P < 0.001) and less likely to be diagnostic (2.4 vs 5.8%; P < 0.001) compared to other oncological trials. Moreover, trials specific to older patients were less likely to be funded by the industry (26.9 vs 37.1%; P < 0.001) or the NIH (14.9 vs 17.6%; P < 0.001), but more likely to be funded by other governmental or academic resources (58.2 vs 45.4%; P < 0.001). Geographical region differences were also evident. Trials specific to older patients were more likely to be conducted in Europe (44.5 vs 28.3%; P < 0.001), and less likely to be conducted in the United States or Canada (43.4 vs 60.2%; P < 0.001) and Asia (16.8 vs 21.5%; P = 0.014). Only 4.5% of the trials specific to older patients were conducted in multiple geographic regions ( ≥2), which was less common than that of other oncological trials (9.4%).
Comparison of trial design characteristics between older-patient-specific trials and other oncological trials registered on ClinicalTrials.gov from 1 January 2000 to 17 December 2019
| Characteristics | No./Total no. (%) | P valueb | ||
|---|---|---|---|---|
| Older-patient-specific trials (n = 490)a | Other oncological trials (n = 48,783)a | |||
| Registration before participant enrollment | 252/488 (51.6) | 27,374/48,434 (56.5) | 0.031 | |
| With a DMC | 206/394 (52.3) | 20,621/38,734(53.2) | 0.706 | |
| Phase | ||||
| Early Phase 1 | 0/366 (0) | 732/38,640 (1.9) | <0.001 | |
| Phase 1 | 32/366 (8.7) | 9,463/38,640 (24.5) | ||
| Phase 1/Phase 2 | 26/366 (7.1) | 4,513/38,640 (11.7) | ||
| Phase 2 | 215/366 (58.7) | 16,752/38,640 (43.4) | ||
| Phase 2/Phase 3 | 10/366 (2.7) | 755/38,640 (2.0) | ||
| Phase 3 | 67/366 (18.3) | 5,216/38,640 (13.5) | ||
| Phase 4 | 16/366 (4.4) | 1,209/38,640 (3.1) | ||
| Enrollment no. of patients | ||||
| Median (IQR) | 73.5 (38.0–180.0) | 51.0 (25.0–128.0) | <0.001 | |
| <50 | 167/473 (35.3) | 21,777/45,930 (47.4) | ||
| 50–100 | 130/473 (27.5) | 10,430/45,930 (22.7) | ||
| >100 | 176/473 (37.2) | 13,723/45,930 (29.9) | ||
| Sex of participants | ||||
| All | 412/490 (84.1) | 38,453/48,781 (78.8) | 0.002 | |
| Female only | 63/490 (12.9) | 7,020/48,781 (14.4) | ||
| Male only | 15/490 (3.1) | 3,308/48,781 (6.8) | ||
| No. of study arms | ||||
| 1 | 251/460 (54.6) | 24,164/45,735 (52.8) | 0.014 | |
| 2 | 177/460 (38.5) | 16,247/45,735 (35.5) | ||
| 3 | 14/460 (3.0) | 2,812/45,735 (6.1) | ||
| ≥4 | 18/460 (3.9) | 2,512/45,735 (5.5) | ||
| Masking | ||||
| None (open label) | 436/480 (90.8) | 40,782/47,252 (86.3) | 0.004 | |
| Blind | 44/480 (9.2) | 6,470/47,252 (13.7) | ||
| Allocation | ||||
| Non-randomised | 274/478 (57.3) | 29,158/46,708 (62.4) | <0.022 | |
| Randomised | 204/478 (42.7) | 17,550/46,708 (37.6) | ||
| Primary purpose | ||||
| Treatment | 378/490 (77.1) | 38,301/48,212 (79.4) | <0.001 | |
| Supportive care | 49/490 (10.0) | 2,802/48,212 (5.8) | ||
| Prevention | 14/490 (2.9) | 1,899/48,212 (3.9) | ||
| Diagnostic | 12/490 (2.4) | 2,799/48,212 (5.8) | ||
| Health Service Research | 9/490 (1.8) | 445/48,212 (0.9) | ||
| Screening | 5/490 (1.0) | 533/48,212 (1.1) | ||
| Basic science | 3/490 (0.6) | 479/48,212 (1.0) | ||
| Other c | 20/490 (4.1) | 954/48,212 (2.0) | ||
| Recruitment status | ||||
| Completed | 195/490 (39.8) | 20,247/48,783 (41.5) | 0.001 0.797 0.924 0.324 0.324 0.123 0.135 0.078 0.007 | |
| Recruiting | 105/490 (21.0) | 10,222/48,783 (21.0) | ||
| Active, not recruiting | 48/490 (9.8) | 4,716/48,783 (9.7) | ||
| Terminated | 42/490 (8.66) | 4,833/48,783 (9.9) | ||
| Not yet recruiting | 17/490 (3.5) | 2,139/48,783 (4.4) | ||
| Withdrawn | 10/490 (2.0) | 1,604/48,783 (3.3) | ||
| Suspended | 5/490 (1.0) | 2,57/48,783 (0.5) | ||
| Enrolling by invitation | 5/490 (1.0) | 2,29/48,783 (0.5) | ||
| Unknown status | 63/490 (12.9) | 4,536/48,783 (9.3) | ||
| Intervention type | <0.001 | |||
| Drug | 318/490 (64.9) | 29,564/48,783 (60.6) | ||
| Behavioural | 32/490 (6.5) | 2,062/48,783 (4.2) | ||
| Procedure | 26/490 (5.3) | 3,770/48,783 (7.7) | ||
| Biological | 21/490 (4.3) | 4,991/48,783 (10.2) | ||
| Radiation | 23/490 (4.7) | 1,973/48,783 (4.0) | ||
| Device | 12/490 (2.4) | 2,128/48,783 (4.4) | ||
| Dietary supplement | 3/490 (0.6) | 610/48,783 (1.3) | ||
| Diagnostic Test | 2/490 (0.4) | 321/48,783 (0.7) | ||
| Genetic | 1/490 (0.2) | 204/48,783 (0.4) | ||
| Combination product | 0/490 (0) | 143/48,783 (0.3) | ||
| Other | 52/490 (10.6) | 3,017/48,783 (6.2) | ||
| Funding source | ||||
| Industry | 132/490 (26.9) | 18,084/48,783 (37.1) | <0.001 | |
| NIH | 73/490 (14.9) | 8,572/48,783 (17.6) | ||
| Other | 285/490 (58.2) | 22,127/48,783 (45.4) | ||
| No. of facilities | ||||
| 1 | 250/465 (53.8) | 25,498/45,193 (56.4) | 0.113 | |
| 2 | 30/465 (6.5) | 3,634/45,193 (8.0) | ||
| ≥3 | 185/465 (39.8) | 16,061/45,193 (35.5) | ||
| Region f | ||||
| United States or Canada | 202/465 (43.4) | 27,210/45,191 (60.2) | <0.001 | |
| Europe | 207/465 (44.5) | 12,781/45,191 (28.3) | <0.001 | |
| Asia | 78/465 (16.8) | 9,695/45,191 (21.5) | 0.014 | |
| Other g | 17/465 (3.7) | 2,916/45,191 (6.5) | 0.014 | |
| No. of regions | ||||
| 1 | 444/465 (95.5) | 40,947/45,191 (90.6) | 0.004 | |
| 2 | 10/465 (2.2) | 2,123/45,191 (4.7) | ||
| 3 | 4/465 (0.9) | 1,075/45,191 (2.4) | ||
| 4 | 7/465 (1.5) | 1,046/45,191 (2.3) | ||
Abbreviations: DMC, Data monitoring committee; NIH, National Institutes of Health.
aDifferent denominators were the number of trials with available data for different variables.
bCalculated using the χ2 test or the Fisher exact test if indicated.
cOther primary purposes include educational/counselling/training, device feasibility and others.
dThis status includes trials marked as ‘recruiting’, ‘active, not recruiting’, ‘not yet recruiting’, ‘enrolling by invitation’ or ‘suspended’ in the field of ‘recruitment status’ in the database.
eThis status includes trials marked as ‘terminated’ or ‘withdrawn’ in the field of ‘recruitment status’ in the database.
fThe sums of the percentages exceed 100 because there may be more than one region for every trial and the categories are not exclusive.
gOther regions included South America, North America other than US/Canada, Central America, Oceania and Africa.
Chronological shifts in older-patient-specific trial characteristics
Supplementary Figure 2 shows the number of oncological trials specific to older patients registered on ClinicalTrials.gov per year and the proportion of these trials in all oncological trials per year. An upward trend of this proportion was observed from 2000 (0.4%) to 2013 (1.3%), peaking at 1.3% in 2013. This was followed by a downward trend which reached the lowest level in 2017 (0.7%).
Table 2 shows the characteristics of oncological trials divided by two temporal subsets (1 January 2000 to 31 December 2009, and 1 January 2010 to 17 December 2019). Generally, the proportion of trials specific to older patients remained stable at 1.0% between these two time periods. Treatment-oriented trials decreased significantly from 91.9 to 70.0% (P < 0.001) over the two time periods, whereas supportive care-oriented trials increased from 1.9 to 13.9% (P < 0.001). Trials in the second period between 2010 and 2019 were less likely to include drug (57.0 vs 81.3%; P < 0.001) and biological (2.7 vs 7.5%; P < 0.001) interventions, but behavioural (7.9 vs 3.8%; P < 0.001), radiation (6.4 vs 1.3%; P < 0.001) and device (3.6 vs 0.0%; P < 0.001) interventions were more likely. Over the two time periods, industry-funded trials decreased from 34.4 to 23.3% (P = 0.004) and NIH-funded ones from 18.1 to 13.3% (P = 0.004). Older-patient-specific trials conducted in Asia increased from 10 out of 155 (6.5%) to 56 out of 310 (18.1%) (P = 0.001) between the two time periods.
Trend changes in characteristics of older-patient-specific trials registered on ClinicalTrials.gov between 1 January 2000 to 31 December 2009 and 1 January 2010 to 17 December 2019
| Characteristics | No./Total no. (%) | P valueb | ||
|---|---|---|---|---|
| 2000–2009 (n = 160)a | 2010–2019 (n = 330)a | |||
| The proportion of older-patient-specific trials | 160/16,526 (1.0) | 330/32,747 (1.0) | 0.676 | |
| Registration before participant enrollment | 50/158 (31.6) | 202/532 (61.2) | <0.001 | |
| With a DMC | 54/98 (55.1) | 152/478 (51.4) | 0.519 | |
| Phase | ||||
| Phase 1 | 8/150 (5.3) | 24/216 (11.1) | 0.342 | |
| Phase 1/Phase 2 | 8/150 (5.3) | 18/216 (8.3) | ||
| Phase 2 | 95/150 (63.3) | 120/216 (55.6) | ||
| Phase 2/Phase 3 | 4/150 (2.7) | 6/216 (2.8) | ||
| Phase 3 | 29/150 (19.3) | 38/216 (17.6) | ||
| Phase 4 | 6/150 (4.0) | 10/216 (4.6) | ||
| Enrollment no. of patients | ||||
| Median (IQR) | 60.0 (31.0–126.0) | 78 (40–197) | 0.036 | |
| <50 | 61/151 (40.4) | 106/322 (32.9) | ||
| 50–100 | 46/151 (30.5) | 84/322 (26.1) | 0.044 | |
| >100 | 44/151 (29.1) | 132/322 (41.0) | ||
| Sex of participants | 0.195 | |||
| All | 131/160 (81.9) | 281/330 (85.2) | ||
| Female only | 26/160 (16.3) | 37/330 (11.2) | ||
| Male only | 3/160 (1.9) | 12/330 (3.6) | ||
| No. of study arms | ||||
| 1 | 58/101 (57.4) | 162/328 (49.4) | 0.547 | |
| 2 | 37/101 (36.6) | 140/328 (42.7) | ||
| 3 | 2/101 (2.0) | 12/328 (3.7) | ||
| ≥4 | 4/101 (4.0) | 14/328 (4.3) | ||
| Allocation | ||||
| Non-randomised | 91/149 (61.1) | 183/329 (55.6) | 0.264 | |
| Randomised | 58/149 (38.9) | 146/329 (44.4) | ||
| Masking | ||||
| None (open label) | 147/151 (97.4) | 289/329 (87.8) | =0.001 | |
| Blind | 4/151 (2.6) | 40/329 (12.2) | ||
| Primary purpose | ||||
| Treatment | 147/160 (91.9) | 231/330 (70.0) | <0.001 | |
| Supportive care | 3/160 (1.9) | 46/330 (13.9) | ||
| Diagnostic | 3/160 (1.9) | 9/330 (2.7) | ||
| Prevention | 2/160 (1.3) | 12/330 (3.6) | ||
| Screening | 2/160 (1.3) | 3/330 (0.9) | ||
| Health Service Research | 0/160 (0.0) | 9/330 (2.7) | ||
| Basic science | 0/160 (0.0) | 3/330 (0.9) | ||
| Other c | 3/160 (1.9) | 17/330 (5.2) | ||
| Recruitment status | ||||
| Completed | 108/160 (67.5) | 87/330 (26.4) | <0.001 <0.001 <0.001 0.031 0.003 0.030 0.725 0.118 0.324 | |
| Recruiting | 1/160 (0.6) | 104/330 (31.5) | ||
| Active, not recruiting | 3/160 (1.9) | 45/330 (13.6) | ||
| Terminated | 20/160 (12.5) | 22/330 (6.7) | ||
| Not yet recruiting | 0/160 (0.0) | 17/330 (5.2) | ||
| Withdrawn | 2/160 (0.8) | 14/330 (2.6) | ||
| Suspended | 2/160 (1.3) | 3/330 (0.9) | ||
| Enrolling by invitation | 0/160 (0.0) | 5/330 (1.5) | ||
| Unknown status | 24/160 (15.0) | 39/330 (11.8) | ||
| Intervention type | <0.001 | |||
| Drug | 130/160 (81.3) | 188/330 (57.0) | ||
| Behavioural | 6/160 (3.8) | 26/330 (7.9) | ||
| Procedure | 10/160 (6.3) | 16/330 (4.8) | ||
| Biological | 12/160 (7.5) | 9/330 (2.7) | ||
| Radiation | 2/160 (1.3) | 21/330 (6.4) | ||
| Device | 0/160 (0.0) | 12/330 (3.6) | ||
| Other f | 0/160 (0.0) | 58/330 (17.6) | ||
| Funding source | ||||
| Industry | 55/160 (34.4) | 77/330 (23.3) | 0.004 | |
| NIH | 29/160 (18.1) | 44/330 (13.3) | ||
| Other | 76/160 (47.5) | 209/330 (63.3) | ||
| No. of facilities | ||||
| 1 | 74/155 (47.7) | 176/310 (56.8) | 0.164 | |
| 2 | 10/155 (6.5) | 20/310 (6.5) | ||
| ≥3 | 71/155 (45.8) | 114/310 (36.8) | ||
| Region g | ||||
| United States or Canada | 71/155 (45.8) | 117/310 (40.6) | 0.095 | |
| Europe | 71/155 (45.8) | 126/310 (40.6) | 0.288 | |
| Asia | 10/155 (6.5) | 56/310 (18.1) | 0.001 | |
| Other h | 3/155 (1.9) | 11/310 (3.5) | 0.403 | |
| No. of regions | ||||
| 1 | 146/155 (94.2) | 298/310 (96.1) | 0.060 | |
| 2 | 7/155 (4.5) | 3/310 (1.0) | ||
| 3 | 1/155 (0.6) | 3/310 (1.0) | ||
| 4 | 1/155 (0.6) | 6/310 (1.9) | ||
Abbreviations: DMC, Data monitoring committee; NIH, National Institutes of Health.
aDifferent denominators were the number of trials with available data for different variables.
bCalculated using the χ2 test or the Fisher exact test if indicated.
cOther primary purposes include educational/counselling/training, device feasibility and others.
dThis status includes trials marked as ‘recruiting’, ‘active, not recruiting’, ‘not yet recruiting’, ‘enrolling by invitation’ or ‘suspended’ in the field of ‘recruitment status’ in the database.
eThis status includes trials marked as ‘terminated’ or ‘withdrawn’ in the field of ‘recruitment status’ in the database.
fOther intervention types include combination product, diagnostic test, dietary supplement and genetic.
gThe sums of the percentages exceed 100 because there may be more than one region for every trial and the categories are not exclusive.
hOther regions included South America, North America other than US/Canada, Central America, Oceania and Africa.
Evolution of end points in older-patient-specific trials
In this analysis, trials with missing data regarding ‘phase’ (n = 123) or ‘end points’ (n = 9) in ClinicalTrials.gov were excluded. Thus, a total of 358 trials specific to older patients were included. Figure 2 shows the distribution of end points over the two time periods 2000–2009 and 2010–2019. Supplementary Figure 3 shows the comparison of proportions of end points reported among each phase and Supplementary Table 2 shows the distribution of end points in the two temporal subsets 2000–2009 and 2010–2019 in each phase in detail.
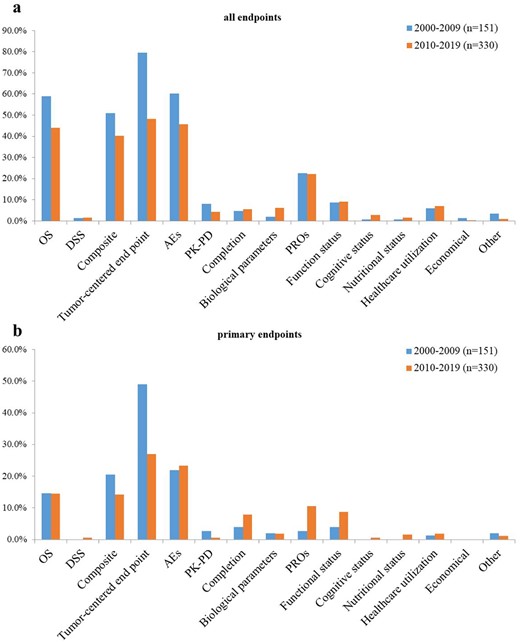
Evolution of end points used in older-patient-specific trials. (a) All end points. (b) Primary end points. The proportion of trials reported each end point category was reported for the first time period (2000–2009, blue) and second time period (2010–2019, orange). OS, overall survival; DSS, disease-specific survival; AEs, adverse events; PK-PD, pharmacokinetic–pharmacodynamic end point; PROs, patient-reported outcomes.
In total, in terms of all end points, OS (58.9 vs 43.9%; P = 0.005), composite end points (51.0 vs 40.3%; P = 0.028), tumour-centred end points (79.5 vs 48.2%; P < 0.001) and AEs (60.3 vs 45.8%; P = 0.003) were decreased significantly over the two time periods. In contrast, patient-centred end points did not change significantly with time (43.0 vs 47.9%, P < 0.324), such as completion (4.6 vs 5.5%; P = 0.707), PROs (22.5 vs 22.1%; P = 0.093), functional (8.6 vs 9.1%; P = 0.864), cognitive (0.7 vs 2.7%; P = 0.141) and nutritional status (0.7 vs 1.5%; P = 0.434), as well as healthcare utilisation (6.0 vs 7.0%; P = 680). PROs accounted for the majority (48.0%) of these patient-centred end points. In terms of primary end points, the use of composite end points, tumour-centred end points and PK-PD decreased over time, of which composite end points (20.5 vs 14.2%; P = 0.001) and tumour-centred end points fell significantly (49.0 vs 27.0%; P < 0.001), while patient-centred end points exhibited an increase over time (11.9 vs 31.2%; P < 0.001), especially the use of PROs that increased considerably from 2.6 to 10.6% (P = 0.003), although their proportions remained lower than those of standardised end points. In addition, the use of clinically meaningful end points in the older patients, such as DSS, PROs, and functional status, as a primary end point were uncommon (0.4, 8.1 and 7.3%, respectively).
In phase 1 trials, AEs were the most frequently used end points. The majority of phase 2 trials involved at least one OS, composite end point, tumour-centred end point and AEs. Significant increases in OS (57.1 vs 74.2%; P = 0.009), and composite end point (51.6 vs 73.3%; P = 0.020), vs were seen, with a considerable decrease in tumour-centred end points (92.3 vs 73.3%; P < 0.001) between the two time periods. All patient-centred end points of phase 2 trials, both primary and secondary, exhibited an upward trend (42.9 vs 83.3%; P < 0.001), especially in PROs (24.2 vs 38.3%; P = 0.029), vs and cognitive status (0.0 vs 5.0%; P = 0.030). In phase 3 trials, OS remained the most frequently reported end point (89.1%), followed by composite end points (75.0%), tumour-centred end points (70.3%), AEs (56.3%) and PROs (34.4%). No differences in the use of all end points or primary end points were observed between the two time periods.
Representation and characteristics of older-patient-specific trials among cancer subtypes
Supplementary Figure 4 shows the distribution of common cancer types registered in ClinicalTrials.gov. In trials exclusively for the older patients, 40.0% (n = 196) were conducted in patients with haematological malignancies, followed by those with breast (15.3%), lung (9.4%) and colorectal (8.0%) cancers. Haematological malignancies were studied more often in older-patient-specific trials (40.0%) than other oncological trials (14.5%). Figure 3 shows the top 15 cancer types by proportion of trials conducted and their extent of matching with corresponding incidences and mortalities in older cancer patients in 2017 from data of SEER Program. There was no correlation between the number of trials on a given type of cancer and relative incidence or mortality (Spearman rank correlation coefficient, 0.146 [P = 0.604] and −0.445 [P = 0.096], respectively). The representation for leukaemia, at 27.3% of all trials specific to older patients, was much higher than either its incidence or mortality (3.1 and 2.9%, respectively). Lymphoma, which represented 15.3% of all trials specific to older patients, was also unproportionate to its incidence (4.6%) and mortality (4.4%). Meanwhile, melanoma had a low representation, at 0.1% of all trials specific to older patients despite incidence and mortality rates of 5.9% and 3.2%, respectively. Bladder cancer had an incidence and mortality rate of 5.8 and 5.5%, respectively, but it was the focus of only 0.4% of older-patient-specific trials. Supplementary Table 3 shows the detailed characteristics of trials specific to older patients based on common cancer types.
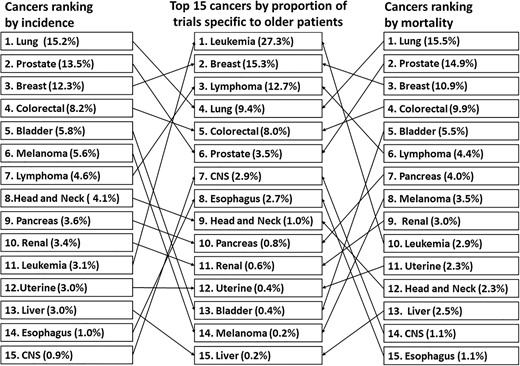
Top 15 cancers by proportion of older-patient-specific trials on ClinicalTrials.gov and their extent of matching with corresponding incidences and mortalities in older cancer patients in 2017. CNS. Central nervous system.
Discussion
Cancer is a disease of old age. As human life expectancy continues to increase in the 21st century, oncologists will be faced with increasing numbers of older patients with cancer. Cancer societies, such as ASCO, EORTC, SIOG, have urged the development of clinical trials for older patients and improved research quality in the field of geriatric oncology [6–9]. However, our results suggest that current clinical trials are unlikely to significantly improve our knowledge of the optimal treatment for older patients since trials specific to older patients account for only a minority (1.0%) of all oncological studies. There were significant variations between the older-patient-specific and age-unspecified trials, and the use of clinically meaningful end points in older patients as a primary end point was uncommon. Moreover, the number of trials for a given cancer type did not correspond to the relative incidence or mortality rates.
Previous studies have reviewed the evolution of inclusion of older patients and the use of end points in clinical trials for older cancer patients [15, 16]. Another study analysed trial characteristics for older patients with haematological cancer [17]. Yet, none have focused on trials specific to older patients. To our knowledge, this study is the first comprehensive overview of the characteristics of oncological trials specific to older patients in the geriatric population.
Our study showed that earlier-phase trials (phases 1 and 1/2) were relatively less common among older-patient-specific ones. Earlier-phase trials are indispensable for older patients, as the geriatric population is often accompanied by comorbidities and age-related physiological dysfunctions in absorption, first-pass metabolism and excretory organs, which can negatively affect the PK-PD. It may be reasonable to focus more on earlier phase trials in the future.
The proportions of industry-funded older-patient-specific trials were relatively low and decreased significantly over time compared to those of other oncological trials. This might be explained by the fact that despite the significant market potential of the older population, an enhanced risk of toxicity and AEs would limit the financial interests and industrial enthusiasm for sponsorship of such trials. The increasing trend of older-patient-specific trials conducted in Asia between the two time periods 2000–2009 and 2010–2019 might be due to an increased interest in geriatric oncology from Asian countries, but more probably due to an increased rate of registration in ClinicalTrial.gov from these regions.
We found that standard end points were predominantly used, despite the fact that their proportion was decreased with time. For example, more than half of the trials used OS as their end point. However, it is recommended that DSS should also be assessed in trials of older cancer patients because the risk of non-cancer deaths resulting from other comorbidities and AEs occur much more frequently in the older population [11]. With improvements in living standards, older patients with cancer are more likely to pay attention to the quality of life and symptom burden. This means that they are unwilling to prolong life with limited dignity [18–20]. In other words, patient-centred outcomes such as PROs and functional status are important for the older population and should be included more often as end points in older-patient-specific trials [21, 22]. Concerningly, our results showed that the use of DSS, PROs and functional status as a primary end point was still limited, although an upward trend was seen in PROs.
In our study, the number of older-patient-specific trials did not align with the global burden of relevant cancer subtypes [23, 24]. We found that haematological malignancies were the most frequently studied, yet their incidence and mortality were not among the most common ones [25]. Their ‘over-representation’ may be explained by the perception that the quantity of research should be in line with abilities to improve human health instead of disease burden [26]. In recent years, advances in genetic profiling, risk stratification, novel therapies including targeted therapy and immunotherapy, offer great promise of incremental gains in remission and survival of haematological malignancies [27], which can greatly motivate cancer experts. However, the true reasons underlying the issue of representation need to be further explored.
Our study has several limitations. First, we exclusively focused on clinical trials from ClinicalTrials.gov, which does not include all trials or the seven other registries used worldwide. Nevertheless, it is the most robust to date, accounting for 70–80% of the unique clinical trials in the World Health Organization records [12]. Second, listing a trial on ClinicalTrials.gov does not mean that the validity of the submitted information has been evaluated by the National Library of Medicine. Third, there was a possibility of potential misclassification, although all characteristics and subgroups were crosschecked by two authors. Fourth, like most of the studies focusing on clinical trials for older patients, we only included interventional trials for our analysis. Thus, non-interventional trials specific to older patients, especially those focusing on geriatric assessment, were not analysed in our study. Fifth, large age-unspecified clinical trials, which contain preplanned subgroup analyses of older patients and can offer a certain level of information on older patients, were not reviewed and analysed in our study. This is because preplanned subgroup analyses are not always recorded in ClinicalTrials.gov by the investigators. Despite these limitations, our analysis of the data from ClinicalTrials.gov could provide population-based evidence for clinical practices and policymaking, and ultimately benefit public health and scientific research [28].
Conclusions
In conclusion, this is the first study to evaluate portfolios of registered, clinical trials specific to older patients with cancer. Our results showed that the number of older-patient-specific trials remained low. Between the older-patient-specific and age-unspecified trials, there were significant variations. The distribution of trial density across cancer types did not parallel the respective distribution of disease burden. Through this comprehensive study, we expect the patients, cancer experts, geriatric clinicians, policymakers and sponsors across countries and regions, to work together in order to overcome existing barriers. Our results can help perfect trial designs and conduct optimal pragmatic clinical research in geriatric oncology, which would shape decision-making in clinical practice, and improve older patients’ healthcare by advancing the development of evidence.
Acknowledgements
We are grateful to Y.Z., Y.Z., Y.Z. and S.Z. for their suggestions in background knowledge and statistic methods. The interpretation and reporting of these data are the sole responsibility of the authors. The authors acknowledge the efforts of the National Cancer Institute and the SEER Program tumour registries in the creation of the SEER database.
Declaration of Conflicts of Interest
None.
Declaration of Sources of Funding
None.
References
Author notes
Yun Yang and Mingxing Xie equally contributed to this paper.

Comments