


Abstract
to investigate the efficacy of addition of inspiratory muscle training (IMT) to the whole body vibration (WBV) on functional outcomes, physical performance, muscle strength and metabolism in pre-frail older women.
this study was a randomized double-blind trial. Forty-two older women aged 60–80 years who meet the Cardiovascular Health Study frailty criteria for pre-frailty were randomly allocated to IMT + WBV, IMTsham + WBV or Sham groups. IMT + WBV group received 12 weeks of both trainings, whereas IMTsham + WVB received 12 weeks of WBV alone. Sham group received 12 weeks of IMT with a low fixed load and were positioned at the vibratory platform without therapeutic effect. Participants were evaluated before and after the intervention for the following outcomes: 6-min walk test distance (6MWD), balance using Tinetti test, functional mobility using timed up and go test (TUG), handgrip strength (HGS) and peripheral muscle metabolism (glucose and lactate levels).
after the training, both groups IMT + WBV and IMTsham + WBV improved 6MWD [mean percentage changes = 20.31 (SD = 14.62) and 13.02 (SD = 12.14), respectively] compared with Sham [0.27 (SD = 6.51)], P <0.01. There was also a significant decrease of mean percentage changes on time of the TUG for IMT + WBV [−21.87 (SD = 7.87)] and IMTsham + WBV [−11.15 (SD = 13.64)] compared with Sham [−4.25 (SD = 13.25)], P <0.01. IMT + WBV group improved balance when compared with IMTsham + WBV and Sham groups (P <0.05 and < 0.01, respectively). HGS and levels of lactate and glucose were similar between groups.
the addition of IMT to the WBV was effective to improve functionality, balance and physical performance in pre-frail older women.
Key points
Inspiratory muscle training and whole body vibration were effective to improve functionality in older women.
Pre-frailty can be prevented with the addition of inspiratory muscle training to the whole body vibration.
Muscle metabolism and strength were not affected by the interventions proposed.
Introduction
Prevalence of pre-frailty in older adults is considerably high in different populations, with an increased risk of declining to frailty [1–3]. Furthermore, pre-frailty is strongly associated with mortality in all age groups [1], with a greater tendency for progression among women [2].
Evidence advocates that the frailty syndrome is potentially reversible through non-pharmacological approaches, with physical interventions recommended as preventive or modifying strategies [4]. From this perspective, new training modalities such as whole body vibration (WBV) and inspiratory muscle training (IMT) are alternatives to traditional exercises (aerobic and resistance) for older pre-frail with difficulties in adapting to the usual physical training protocols.
The WBV is a new type of training that uses a vibrating platform that emits sinusoidal vibrations that act directly on muscle spindles, resulting in the activation of alpha motor neurons that evoke reflex muscle contractions [5, 6]. This intervention modality seems to be effective in improving overall health and peripheral muscle strength. Also, it does not apply joint load intensity being a promising alternative for several populations [7]. To complement the benefits of a training program for peripheral muscles, IMT can be an additional tool since it can be performed even in those with limitations to traditional training.
Literature supports that WBV improves balance and physical performance in older adults [8]. IMT has also shown beneficial effects in respiratory strength and function [9, 10], exercise capacity [11], balance and physical performance in older adults [12, 13]. Notwithstanding, few studies [14–16] have investigated the effects of IMT combined with other training practices on muscle strength and physical performance in older adults.
Furthermore, no studies have investigated the effects of WBV and IMT, combined or not, in pre-frail older women. Thus, this study aimed to investigate the efficacy of WBV and IMT on muscle strength, functional outcomes and physical performance in pre-frail older women.
Methods
Study design
This study was a randomized double-blind trial with a concealed allocation, conducted at the Cardiopulmonary Physiotherapy Laboratory at Physiotherapy Department at Federal University of Pernambuco (UFPE) in Recife, Brazil, between September 2018 and January 2019. Informed and signed consent was obtained from all volunteers. The study was approved by the Research Ethics Committee of the Research Ethics Committee of the Health Sciences Center of the UFPE (1.898.812) and registered at ClinicalTrials.gov (NCT03688932).
Participants
The eligibility criteria for recruiting volunteers were pre-frail community-dwelling older women aged between 60 and 80 years who were able to walk without assistance and with good understanding to perform the proposed tests, as assessed through the Mini-Mental State Examination [17]. A trained physical therapist screened the pre-frail volunteers when the volunteers presented one or two criteria of the physical frailty phenotype [18].
Randomization and blinding
Block randomization was performed by randomization.com software. Participants were allocated into three groups: IMT + WBV; Inspiratory muscle training Sham plus whole body vibration (IMTsham + WBV); or Sham: IMTsham + WBVsham. This process was carried out by a third researcher who was blinded and did not participate of this study. The distribution of the volunteers was placed in opaque and numbered envelopes.
Sample size
The sample size was determined based on 6-min walk test distance (6MWD) data from a pilot study involving five volunteers in each group. The G*Power3 statistical program [19] was used considering a power (1-β) of 90% and an α of 5% to detect an increment of 10.31 ± 14.62 m between IMT + WBV group and Sham, and an increment of 13.01 ± 12.14 m between IMTsham + WBV and Sham. Considering a follow-up loss of 20%, a total of 14 volunteers were allocated to each group.
Interventions
The IMT + WBV group received both IMT and WBV training. The IMTsham + WVB received WBV alone. Sham group received IMT with a low fixed load and they were positioned on the vibratory platform without therapeutic effect. All training was performed under the supervision of an experienced physical therapist.
IMT
IMT was carried out once daily (7 days) for 12 consecutive weeks. Participants had to perform 60 repetitions throughout the day. The training was mainly executed at home; however, participants performed one IMT session with therapist supervision once a week to ensure adequate training and to instruct the participants regarding further training at home. Two therapists not involved with the evaluation procedures monitored the training. The IMT was performed using a linear resistance device (POWERBreathe® Classic series 1st generation; Gaiam Ltd, Southam, UK) with a load of 40% maximum inspiratory pressure (MIP). The load intensity was adjusted weekly by a revaluation of MIP. IMTsham was performed using the same training protocol; however, the load intensity was fixed at 10 cmH2O.
WBV training
WBV training was conducted 3 days per week for 12 weeks. The training time increased as shown in Supplementary Table 1. The WBV was performed by using the MY3 vibratory platform (Power Plate®, MY3, United Kingdom) with three axes and vibration frequency established at 35 Hz. Participants stood barefoot with their knee joint semi-flexed at 15° [20]. WBVsham was performed using a patented device (BR102016006148–2 A2) coupled to the platform which emits a vibrating effect with a minimum frequency without therapeutic effect. The participant’s position in the WBT sham was similar to that performed in the experimental group.
Outcomes
Participants were evaluated at two different times: pre-intervention and post-intervention. All assessment procedures were performed by an experienced physical therapist who was unaware of the volunteer allocation group. The assessment procedures were carried out on two separate days.
Primary outcome
Six-minute walk test
The 6-min walk test (6MWT) was performed according to the American Thoracic Society recommendations [21]. Total distance covered (6MWD) in meters was recorded and compared with predicted values for the Brazilian population [22] and the percent predicted 6MWD was calculated as follows: 6MWD/predicted 6MWD × 100. The following clinical parameters were measured before and immediately after 6MWT: heart rate (HR), systolic (SBP) and diastolic blood pressure (DBP). In addition, the percentage change of the 6MWD was calculated as follows: (after–baseline 6MWD)/6MWD baseline. HR, SBP and DBP variations (after–before 6MWT values) were calculated to observe cardiovascular responses after interventions and used in the analysis.
Secondary outcomes
Functional mobility and balance
The functional mobility was assessed by the timed up and go test (TUG test). Participants were instructed to rise from a chair, walk as fast as possible for 3 m, turn and return to the chair and sit down. Three attempts were performed, and the lowest value in seconds was registered [23]. Balance was assessed by using the Tinetti test that assesses static (Tinettiest) and dynamic balance (Tinettidin). The total score (Tinettitot) is the sum of these two subscales that range from 0 to 28, with the Tinettiest score ranging 0–16 and Tinettidin ranging 0–12 [24].
Muscle strength
The handgrip strength (HGS) was assessed using a handheld hydraulic dynamometer (Smedley, Saehan, South Korea) on the dominant limb. Three manoeuvres were performed with the highest value registered [25].
Peripheral muscular metabolism
Peripheral glucose and lactate levels were obtained from capillary blood before and immediately after 6MWT using a portable lactate analyser Accutrend Plus® (Roche Accutrend Plus, New York) and an Accu-Chek Performa® home glucose monitor (Roche, New York). The variations in values (after–before 6MWT values) of glucose and lactate levels were used in analyses.
Covariates
Respiratory muscle strength
Respiratory muscle strength was assessed by measuring the MIP and maximum expiratory pressure (MEP) using a digital manometer (MVD300, Globalmed, Brazil). At least five measurements were evaluated until three acceptable and reproducible measurements were obtained (a difference of <10% between them). The highest value reached was used, and then compared with reference values for the Brazilian adult population [26].
Pulmonary function
Pulmonary function was assessed using a portable device (Micro Medical, Microloop, MK8, England). The measurements included forced vital capacity (FVC), forced expiratory volume in the first second (FEV1), forced expiratory flow 25–75% (FEF25–75%) and FEV1/FVC assessed according to the American Thoracic Society/European Respiratory Society criteria [21]. The values reached were compared with reference values from the Brazilian adult population [27].
Anthropometric measures
Body weight (kg) and height (m) measurements were performed using a scale with a height rod (Balance W300 A, Welmy, Brazil). Body mass index (BMI) was calculated using the body mass/height2 (kg/m2).
Adverse effects
The volunteers were asked about the presence of adverse effects of the intervention throughout the training protocol, such as itching, fatigue, headache, dizziness, nausea, among others.
Statistical analysis
Data normality and homogeneity of the sample were tested by Shapiro–Wilk and Levene tests. The one-way ANOVA test with Tukey post hoc for the parametric variables was used for comparisons between groups (IMT + WBV, IMTsham + WBV and Sham), and the Kruskal–Wallis test with the Mann–Whitney post hoc test was used groups for nonparametric data (Tinettitot, Tinetties, Tinettidin). Intention-to-treat was performed using the last observation carried forward [28]. The analysis was conducted using the Statistical Package for the Social Sciences for Windows (version 20.0, Chicago, IL), and a significance level of P < 0.05 was established.
Results
A total of 42 older women were included in the study (Figure 1). General characteristics of the participants are shown in Table 1.
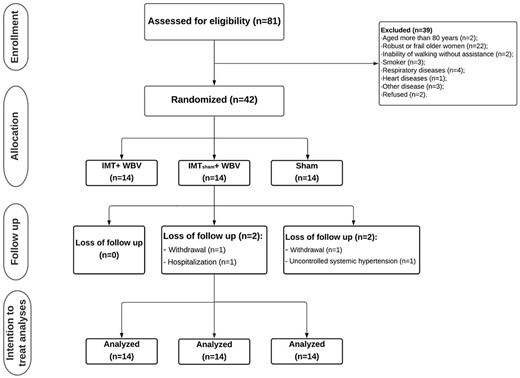
Flowchart of participants.
Clinical characteristics according interventions groups
| IMT + WBV | IMTsham + WBV | Sham | P-value | ||||
|---|---|---|---|---|---|---|---|
| Variables | Mean ± SD | CI 95% | Mean ± SD | CI 95% | Mean ± SD | CI 95% | |
| Age (years) | 68.71 ± 4.27 | (66.25–71.18) | 68.78 ± 4.56 | (66.15–71.42) | 67.71 ± 3.95 | (65.43–69.99) | 0.76 |
| Weight (kg) | 67.71 ± 8.33 | (62.90–72.53) | 74.36 ± 12.34 | (67.23–81.48) | 72.2 ± 12.4 | (65.04–79.36) | 0.29 |
| Height (m) | 1.56 ± 0.04 | (1.54–1.58) | 1.56 ± 0.06 | (1.52–1.59) | 1.55 ± 0.07 | (1.51–1.60) | 0.98 |
| BMI (kg/m2) | 27.71 ± 3.04 | (25.95–29.46) | 30.16 ± 4.61 | (27.49–32.82) | 29.75 ± 4.92 | (26.91–32.59) | 0.28 |
| MEEM | 28.07 ± 1.68 | (27.10–29.04) | 28.43 ± 1.65 | (27.47–29.38) | 28.21 ± 1.25 | (27.49–28.94) | 0.83 |
| FEV1%pred | 89.78 ± 11.52 | (83.13–96.44) | 87.71 ± 11.19 | (81.25–94.17) | 82.43 ± 6.96 | (78.41–86.45) | 0.15 |
| FVC %pred | 85 ± 9.14 | (79.72–90.28) | 83.21 ± 10.27 | (77.29–89.14) | 81.43 ± 5.34 | (78.34–84.51) | 0.55 |
| FEV11/FVC%pred | 111 ± 4.04 | (108.67–113.33) | 111.21 ± 9.02 | (106.00–116.42) | 108.64 ± 9.58 | (103.11–114.17) | 0.64 |
| FEF25–75%pred | 122.78 ± 29.74 | (105.61–139.96) | 115.21 ± 28.07 | (99.01–131.42) | 103.78 ± 21.51 | (91.37–116.20) | 0.18 |
| Gait speed (s) | 1.07 ± 0.74 | (1.03–1.11) | 1.06 ± 0.12 | (1.00–1.13) | 1.09 ± 0.17 | (1.00–1.19) | 0.80 |
| MIP (cmH2O) | 79.08 ± 16.65 | (63.46–88.68) | 70.00 ± 11.59 | (63.31–76.69) | 74.22 ± 16.86 | (64.48–83.94) | 0.46 |
| MIP%pred | 102.11 ± 19.82 | (90.67–113.56) | 90.60 ± 13.99 | (82.52–113.56) | 95.48 ± 21.64 | (82.98–107.97) | 0.44 |
| MEP (cmH2O) | 82.29 ± 14.33 | (74.02–90.55) | 81.43 ± 14.91 | (72.82–90.04) | 71.79 ± 17.02 | (61.96–81.61) | 0.18 |
| MEP%pred | 110.52 ± 17.86 | (101.20–121.83) | 110.49 ± 18.79 | (99.64–121.34) | 96.60 ± 22.90 | (83.38 to 109.83) | 0.13 |
BMI: body index mass; MEEM: Mini Mental State Examination; FVC: forced vital capacity; FEV1: forced expiratory volume in the first second; FEV1/FVC: ratio of forced expiratory volume in the first second and forced vital capacity; FEF25–75: forced expiratory flow 25–75; MIP: maximum inspiratory pressure; MEP: maximum expiratory pressure; Variable%pred: reference values from Brazilian population.
Comparisons of 6MWD, percent predict 6MWD and percentage change of 6MWD predicted values are shown in Figure 2. The IMT + WBV group had a higher 6MWD after the intervention when compared with Sham (Figure 2a). In addition, the IMT + WBV group had a higher percentage of predicted values than Sham group (P < 0.01) (Figure 2b). As seen in Figure 2c, both IMT + WBV and IMTsham + WBV groups had a significant improvement (P < 0.01) in 6MWD compared with Sham.
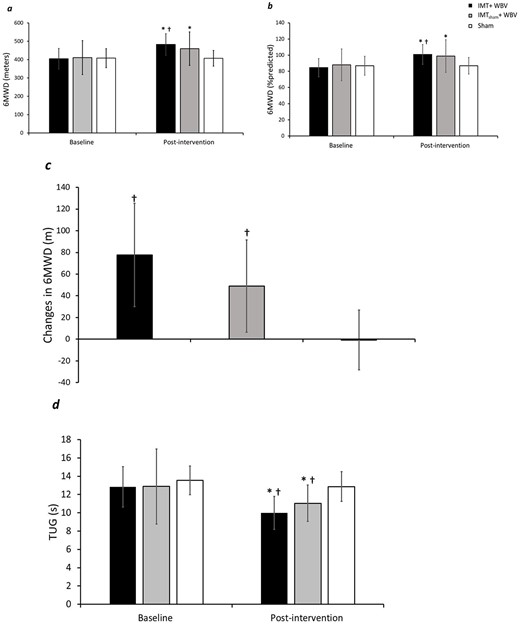
(a) Six-meter walk distance comparisons between the IMT + WBV, IMTsham + WBV and Sham groups. (b) Six-meter walk distance predicted values comparisons between groups. (c) Change in 6-m walk test comparisons between the IMT + WBV, IMTsham + WBV and Sham groups. (d) Timed up and go results between IMT + WBV, IMTsham + WBV and Sham groups. † Significant difference from Sham group. *P < 0.01 for pairwise comparisons.
The percentage changes of 6MWD were higher in IMT + WBV group (20.31 ± 14.62%) compared with Sham (0.27 ± 6.51%) (P < 0.01), and in IMTsham + WBV (13.02 ± 12.14%) compared with Sham (P < 0.01). There were no differences in walked distance, changes and percentage of 6MWD in the comparisons between IMT + WBV and IMTsham + WBV.
Figure 2d also depicts the results of the time of TUG before and after intervention. IMT + WBV group and IMTsham + WBV showed a significant reduction in TUG time after intervention (P < 0.01). Comparisons between groups showed that both IMT + WBV and IMTsham+WBV had lower TUG time values than Sham after completing intervention (P < 0.01 and = 0.02, respectively) (Figure 2d).
Percentage changes in TUG time were higher in IMT + WBV group (−21.87 ± 7.87%) compared with Sham (−4.25 ± 13.25%) (P < 0.01), and in IMTsham + WBV (−11.15 ± 13.64%) compared with Sham (P <0.01). IMT + WBV and IMTsham + WBV groups were similar in terms of change of TUG.
About balance, we observed that IMT + WBV group improved Tinettitot score after intervention and this improvement was also greater than in IMTsham + WBV and Sham (P < 0.05 and < 0.01, respectively). Static balance was similar between groups after interventions. Tinettidin test showed improvement after intervention compared with baseline only in IMT + WBV group (P < 0.05); this improvement was also greater than in IMTsham + WBV (P < 0.05) and Sham (P < 0.01) (Table 2).
Differences in HGS between groups were not observed (Table 2). The variations in HR, blood pressure, lactate and glucose levels were similar between groups (Table 3).
Adverse effects reported by volunteers during the intervention period ceased a few minutes after beginning the training session. Adverse effects were reported by 57% of participants in IMT + WBV (8 individuals) and 64% of IMTsham + WBV group (9 volunteers). The reported effects were itching of the nose, upper and/or lower limbs (88.2%), or cramps (2 volunteers). However, these effects stopped a few minutes after the training session started. There were no reports of adverse reactions during the WBV intervention protocol in the Sham group. In addition, 14.29% of the IMT + WBV participants reported mild dyspnea during the WBV training at the end of the training series during the initial 2 weeks, whereas one volunteer (7.14%) from IMTsham + WBV and two (14.29%) from Sham reported nausea during home sessions.
Discussion
Our results revealed that WBV associated with IMT is effective to improve 6MWD, TUG test and balance in pre-frail older women. Also, the isolated training of WBV showed beneficial repercussions on TUG scores. However, the interventions did not modify HGS or muscle metabolism variables.
The IMT + WBV and IMTsham + WBV groups showed an increase of |$\sim$|20% and 13%, respectively, in 6MWD in relation to the Sham. This result reinforces our hypothesis that these two established training protocols are effective in improving physical performance in a population vulnerable to the frailty process, despite no previous studies that have investigated the 6MWD in pre-frail older adults.
Older adults with knee osteoarthritis seem to benefit from WBV [29, 30], which is consistent with our findings. The literature regarding the impact of IMT on 6MWD in older adults is scarce. A systematic review found that only two studies assessed the 6MWD after IMT, and the results were contradictory between them [9]. Although the IMT + WBV and IMTsham + WBV groups were similar in terms of 6MWD, the IMT + WBV group presented an average change of 77 m, which is above what is considered as meaningful clinical change for older adults [31].
Final TUG test scores were lower in IMT + WBV and IMTsham + WBV compared with Sham, agreeing with results from previous studies that applied WBV in older frail [32, 33]. Moreover, IMT + WBV (21.87%) and IMTsham + WBV (11.15%) treatment effects are comparable to other studies; healthy older adults have reported improvements of 9 [34]–13.16% [35] in TUG after WBV training, whereas these increments ranged from 7.3 [33] to 25.5% [36] in frail older adults.
Baseline and post-intervention values for balance, peripheral and respiratory muscle strength
| Outcomes | Interventions | Baseline | Post-intervention | Mean difference (baseline – post) | 95% CI | % change |
|---|---|---|---|---|---|---|
| Tinettitotal | IMT + WBV | 26.15 ± 1.80 | 27.43 ± 1.09¥* | −1.29 ± 1.00 | −1.86 to −0.72 | 5.17 ± 4.28 |
| IMTsham + WBV | 24.5 ± 2.60 | 25.72 ± 2.34* | −1.22 ± 1.63 | −2.16 to −0.28 | 5.34 ± 7.45 | |
| Sham | 24.93 ± 2.44 | 25.58 ± 2.38 | −0.65 ± 1.16 | −1.31 to 0.03 | 2.72 ± 4.75 | |
| Tinettiest | IMT + WBV | 14.43 ± 1.40 | 15.5 ± 0.86†* | −1.08 ± 0.83 | −1.55 to −0.60 | 7.96 ± 6.54 |
| IMTsham + WBV | 13.43 ± 2.14 | 14.43 ± 1.99* | −1.00 ± 1.42 | −1.82 to −0.19 | 8.31 ± 12.47 | |
| Sham | 13.65 ± 1.60 | 14.08 ± 1.74 | −0.43 ± 1.66 | −1.39 to 0.53 | 3.75 ± 12.02 | |
| Tinettidin | IMT + WBV | 11.65 ± 0.64 | 11.93 ± 0.27¥* | −0.29 ± 0.47 | −0.56 to −0.02 | 2.67 ± 4.38 |
| IMTsham + WBV | 11.08 ± 0.92 | 11.29 ± 0.83 | −0.22 ± 0.43 | −0.47 to 0.04 | 2.1 ± 4.19 | |
| Sham | 11.36 ± 1.55 | 11.15 ± 1.36 | 0.22 ± 0.81 | −0.25 to 0.68 | −1.54 ± 5.73 | |
| HGS | IMT + WBV | 23.54 ± 3.21 | 24.86 ± 3.93 | −1.33 ± 2.58 | −2.82 to 0.17 | 5.85 ± 10.62 |
| IMTsham + WBV | 24.74 ± 5.03 | 25.98 ± 5.21* | −1.24 ± 1.76 | −2.25 to −0.22 | 5.36 ± 8.72 | |
| Sham | 22.59 ± 4.15 | 21.7 ± 3.71 | −0.89 ± 2.32 | −2.23 to 0.45 | 4.40 ± 13.29 |
¥Significantly different from IMTsham + WBV and Sham (P <0.05).
*Significantly different from baseline P <0.05.
†Significantly different from Sham (P <0.01).
Cardiovascular and peripheral muscle metabolism responses after intervention period
| Outcomes | Mean ± SD | Mean difference | 95% CI | ||
|---|---|---|---|---|---|
| Cardiovascular variables | |||||
| HR | IMT + WBV | 14.72 ± 11.25 | IMT + WBV vs. IMTsham + WBV | 1.21 | −11.4 to 13.83 |
| IMTsham + WBV | 13.50 ± 12.53 | IMT + WBV vs. Sham | −5.43 | −18.05 to 7.19 | |
| Sham | 20.15 ± 16.72 | IMTsham+WBV vs. Sham | −6.64 | −19.26 to 5.97 | |
| SBP | IMT + WBV | 6.50 ± 5.70 | IMT + WBV vs. IMTsham + WBV | −6.36 | −20.45 to 7.74 |
| IMTsham + WBV | 12.86 ± 14.95 | IMT + WBV vs. Sham | −13.21 | −27.31 to 0.88 | |
| Sham | 19.72 ± 21.14 | IMTsham+WBV vs. Sham | −6.86 | −20.95 to 7.24 | |
| DBP | IMT + WBV | 1.72 ± 7.97 | IMT + WBV vs. IMTsham + WBV | −8.43 | −18.38 to 1.52 |
| IMTsham + WBV | 10.15 ± 9.16 | IMT + WBV vs. Sham | −6.21 | −16.17 to 3.74 | |
| Sham | 7.93 ± 14.25 | IMTsham+WBV vs. Sham | 2.21 | −7.74 to 12.17 | |
| Peripheral muscle metabolism variables | |||||
| Lactate | IMT + WBV | 0.61 ± 1.56 | IMT + WBV vs. IMTsham + WBV | −0.28 | −1.32 to 0.76 |
| IMTsham + WBV | 0.89 ± 0.98 | IMT + WBV vs. Sham | −0.13 | −1.17 to 0.91 | |
| Sham | 0.74 ± 0.66 | IMTsham+WBV vs. Sham | 0.15 | −0.89 to 1.19 | |
| Glucose | IMT + WBV | −19.43 ± 20.54 | IMT + WBV vs. IMTsham + WBV | 3.36 | −18.56 to 25.28 |
| IMTsham + WBV | −22.79 ± 33.00 | IMT + WBV vs. Sham | −5.57 | −27.49 to 16.35 | |
| Sham | −13.86 ± 13.76 | IMTsham+WBV vs. Sham | −8.93 | −30.85 to 12.99 |
HR: heart rate; SBP: systolic blood pressure; DBP: diastolic blood pressure.
Thus, the robust effect of our findings suggests that WBV is a modifying strategy for adverse functional outcomes in pre-frail older women. Moreover, IMT also has a positive impact on functional mobility; for example, IMT training showed an improvement on TUG test ranging from 5.3 to 11% (11, 40), which is in line with our results for IMT + WBV group.
Some possible mechanisms may be involved in the improvement in mobility after interventions. We suggest that the direct action of vibration on muscle spindles with reflex muscle contractions develops better muscle performance during training with increased strength of the lower limbs, in addition to proprioceptive benefits, which is reflected in increased walking speed [37]. In addition, IMT training is also related to the respiratory pump increment generating better pulmonary ventilation and consequent improvement in oxygen supply to peripheral muscles with lower energy expenditure [13], which could help to explain the greater improvement in the 6MWD and TUG in the IMT + WBV group.
Total scores for the Tinetti balance scale were higher in the IMT + WBV compared with the IMTsham + WBV and Sham. These results were unusual since we expected the same behaviour for IMTsham + WBV in relation to Sham. However, it is important to note that the initial scores observed in our volunteers indicated that the sample had no balance deficiency and that the three groups had an increase in the final test score, being more expressive in IMT + WBV. A study that conducted WBV training for 8 months did not observe changes in balance similar to our findings [38]; however, other authors showed that osteopenic older women showed improvements in static balance (+6.8%) [39] after 12 months of WBV.
IMT training has also recently been related to improved balance in older adults. For example, an improvement of 24% [12] and 18% [40] has been reported in balance, which is in line with our results. These findings might suggest that adding IMT training to older pre-frail adults could result in additional benefits in terms of balance.
There were no differences between groups regarding HGS values after the implemented intervention protocol. Similar to our findings, a training program with a weekly frequency of 2 days of IMT did not alter the HGS values in older women [38]. A recent study noted that IMT does not interfere with muscle activation with strength development of wrist extensor and handgrip muscles in healthy men [41]. Although HGS is considered to be a predictor of overall muscle strength and prognosis for mortality [42], few participants in this study had low HGS as a frailty criterion, suggesting that more expressive therapeutic effects on HGS are developed in more deficient populations (institutionalized, fragile or with confirmed clinical sarcopenia) and/or with a longer period of interventions.
The findings showed that the 12-week protocol carried out in this study does not influence the glucose and lactate variation in pre-frail older women during submaximal exercise. The literature shows that there is a decrease in the glucose level and an increase in the blood lactate concentration during IMT [43]. This could be a response to the energy expenditure increment during the exercise which decreases the basal glucose levels, and the successive muscle contractions induced by the vibratory tonic reflex that increases the release of muscle lactate [43]. However, the absence of glycemic and lactate changes between the groups reinforces the idea that 12 weeks of WBV may not be enough to generate chronic adaptations induced by exercise on muscle and liver metabolism.
The adverse effects reported by the volunteers ceased a few minutes after beginning the training session, indicating that the instituted protocol seems to be a safe procedure that may only induce mild transient adverse effects on this population.
Limitations
One limitation of this study was that the sample was composed of diabetic participants in the three groups, which may have influenced the metabolic responses observed. However, the sensitivity analysis carried out on the data through intention-to-treat and the profile of the sample studied (with usual geriatric comorbidities), causes the external variability of our findings to be extrapolated to clinical scenarios.
Also, we have used as the method for the intention-to-treat analyses the last observation carried forward, we have known there is some concern regarding whether it is appropriate to use this technic [44]. However, our data met the two basic assumptions for use since the participants’ responses were constant from the last observed value and, missing values were missing completely at random which could minimize possible bias sources [45]. Finally, our sample was composed only by older women, which can affect the generalizability of our findings.
Conclusion
The association of WBV and IMT is effective as a preventive strategy for frailty syndrome, bringing beneficial repercussions on functionality, balance and physical performance in pre-frail older women. There were no changes in HGS and muscle metabolism.
Declaration of Conflicts of Interest
None.
Declaration of Sources of Funding
This work was supported by CNPq—Edital Universal (grant number 42884/2018–0). This study was also financed in part by the Coordenação de Aperfeiçoamento de Pessoal de Nível (CAPES)—Finance Code 001.

Comments