


Abstract
The success and sustainability of U.S. EPA efforts to reduce, refine, and replace in vivo animal testing depends on the ability to translate toxicokinetic and toxicodynamic data from in vitro and in silico new approach methods (NAMs) to human-relevant exposures and health outcomes. Organotypic culture models employing primary human cells enable consideration of human health effects and inter-individual variability but present significant challenges for test method standardization, transferability, and validation. Increasing confidence in the information provided by these in vitro NAMs requires setting appropriate performance standards and benchmarks, defined by the context of use, to consider human biology and mechanistic relevance without animal data. The human thyroid microtissue (hTMT) assay utilizes primary human thyrocytes to reproduce structural and functional features of the thyroid gland that enable testing for potential thyroid-disrupting chemicals. As a variable-donor assay platform, conventional principles for assay performance standardization need to be balanced with the ability to predict a range of human responses. The objectives of this study were to (1) define the technical parameters for optimal donor procurement, primary thyrocyte qualification, and performance in the hTMT assay, and (2) set benchmark ranges for reference chemical responses. Thyrocytes derived from a cohort of 32 demographically diverse euthyroid donors were characterized across a battery of endpoints to evaluate morphological and functional variability. Reference chemical responses were profiled to evaluate the range and chemical-specific variability of donor-dependent effects within the cohort. The data-informed minimum acceptance criteria for donor qualification and set benchmark parameters for method transfer proficiency testing and validation of assay performance.
New approach methods (NAMs) are defined as any in silico, in chemico, in vitro, or ex vivo technology, methodology, approach, or combination that can inform chemical hazard and risk assessment without the use of animals (EPA, 2021). The Frank R. Lautenberg Chemical Safety for the 21st Century Act (Lautenberg Chemical Safety Act), an amendment to the Toxic Substances Control Act, directs the Environmental Protection Agency to develop and implement methods that reduce the reliance on vertebrate animal testing (H.R.2576—114th Congress, 2016). Components of these efforts include developing a list of current NAMs that are “scientifically reliable, relevant, and capable of providing information of equivalent or better scientific reliability and quality to that which would be obtained from vertebrate animal testing,” as well as strategic frameworks to further the development, validation, and acceptance of NAMs that fill critical information gaps (H.R.2576—114th Congress, 2016). Similar trajectories are on course in the European Union where the European Chemicals Agency has developed guidance on meeting the Registration, Evaluation, Authorisation and Restriction of Chemicals requirements for chemical registration (EC (European Commission), 2006). The guidance promotes the use of alternatives to animal testing by using existing information to fulfill data requirements, identify gaps, and implement validated in vitro methods, quantitative structure-activity relationship models, and read-across categories to meet these requirements—using animal testing as an absolute last resort (Andersson et al., 2018).
There is a regulatory need in the EPA Endocrine Disruptor Screening Program (EDSP) to identify and evaluate chemicals that may disrupt the thyroid endocrine system. One primary emphasis is evaluating the potential impacts of chemical exposures on maternal, fetal, and early childhood thyroid hormone imbalance and subsequent neurodevelopmental outcomes. A systematic review of human data supports the association of altered maternal thyroid hormones (eg, fT4, thyroid-stimulating hormone [TSH]) with increased risk for child neurodevelopmental impairment (Sauer et al., 2020). Continuing in the framework of the EDSP Comprehensive Management Plan (EPA, 2014), and the thyroid conceptual framework presented to the Federal Insecticide, Fungicide, and Rodenticide Act science advisory panel in 2017 (EPA, 2017), there have been ongoing efforts to address needs in thyroid screening with further development and application of mechanistic high-throughput screening (HTS) assays to increase data coverage across data-poor chemicals using a tiered testing strategy (Thomas et al., 2019). Several molecular thyroid targets relevant to hormone synthesis dynamics (OECD, 2017) have been adapted to HTS assays to rapidly evaluate the ToxCast/Tox21 chemical inventories for potential thyroid disrupting chemicals (Dong et al., 2020; Hornung et al., 2018; Olker et al., 2019, 2021; Paul Friedman et al., 2016; Paul et al., 2014; Titus et al., 2008; Wang et al., 2018, 2019, 2021). Despite pinpointing the mechanistic basis for hazard potential, advancing the mechanistic interpretation and biological plausibility requires orthogonal screening modalities that can anchor purported biomolecular interactions to a functional phenotype that evaluates hormone synthesis. Perturbations to hormone synthesis in the thyroid gland represent the major mode-of-action contributing to steady-state serum thyroid hormone levels which are a regulatory point of concern (EPA, 2013). In the context of a thyroid adverse outcome pathway (AOP) network, evidence supporting the “key event” decrease in serum thyroxine (T4) could provide quantitative linkages to the molecular effects (ie, molecular-initiating events or MIEs) critical to hormone synthesis dynamics (Browne et al., 2017; Noyes et al., 2019). Indeed, measurement of triiodothyronine (T3), T4, and TSH are common to a number of standard rodent toxicity studies where imbalances may be observed with altered neurodevelopmental outcomes (Marty et al., 2021). Decreases in serum T4 are also a common “key event” to thyroid-related developmental neurotoxicity AOPs (8, 42, 54, 134, and 152) (Marty et al., 2021; Society for Advancement of AOPs, 2024), further supporting the need for NAMs that can fill this information gap and provide context to human health effects.
Advancements in complex in vitro culture systems comprised of primary cells from human donors enable reconfiguration of the cellular architecture and microenvironment that more closely simulate the natural structure, function, and physiology of the native tissue or organ. Prior work established a medium-throughput organotypic screening assay comprised of reconstructed human thyroid microtissues (hTMTs) to quantitatively evaluate the disruptive effects of chemicals on thyroid hormone production and secretion (Deisenroth et al., 2020; Hopperstad, 2021). Primary human thyroid cells procured from qualified euthyroid donors were initially characterized for biomarkers indicative of thyroid follicular epithelial cells (thyrocytes). Following verification of cell quality, a direct comparison with two-dimensional (2D) and three-dimensional (3D) 96-well culture formats was employed to characterize the morphology, differential gene expression, thyroglobulin production, and thyroid hormone synthesis over the course of 20 days. Inhibition of thyroid hormone synthesis in the 3D thyroid microtissue assay was demonstrated with reference chemicals for key molecular targets within the gland that are aligned with high-throughput thyroid assays. When applied in the context of a tiered-testing paradigm (Thomas et al., 2019), the assay provides knowledge at the “key event” level along an AOP continuum (Browne et al., 2017; Noyes et al., 2019) to confirm the biomolecular effects of chemicals at the tissue level whilst anchoring the observation to potential changes in serum thyroid hormone levels. As a result, the assay may enable chemical regulators to use the in vitro data for evaluating thyroid mode of action for endocrine disruption relevant to human health effects. It may also allow chemical manufacturers to benefit from insight into thyroid toxicity earlier in the product development pipeline without resorting to a large battery of initial molecular mechanism-based assays.
The EPA NAMs Work Plan seeks to support refinement and replacement of animal testing by addressing scientific challenges, inclusive of those in the EDSP, that fill information gaps in chemical safety research (EPA, 2021). The EPA has also recently committed to “rebuilding” the EDSP and continuing the development of NAMs which would allow EPA to screen chemicals faster and more efficiently using in silico and in vitro alternatives to vertebrate animal testing (EPA, 2022). Increasing confidence in the information provided by NAMs requires setting appropriate performance standards and benchmarks, defined by the context of use, to consider human biology and mechanistic relevance without animal data (EPA, 2021; ICCVAM, 2018). Organotypic assays that source primary cells from human donors hold great promise toward evaluating hazard potential with greater biological relevance, but present a considerable challenge for standardization due to the inherent underlying heterogeneity. To establish an assay that is reproducible and can predict a range of human responses requires minimizing technical variability to increase confidence in the “true” biological performance variability. The objectives of this study were to (1) define the technical parameters for optimal donor procurement, primary thyrocyte qualification, and performance in the hTMT assay, and (2) set benchmark ranges for reference chemical responses. Thyrocytes derived from a cohort of 32 demographically diverse euthyroid donors were characterized across a battery of endpoints to evaluate morphological and functional variability. Response to a reference chemical set was profiled to evaluate the range and chemical-specific variability of donor-dependent effects within the cohort. The data were used to establish minimum acceptance criteria for donor qualification and set benchmark parameters for method transfer proficiency testing and validation of assay performance.
Materials and methods
Human thyroid follicular epithelial cells
Primary human thyrocytes were obtained from LifeNet Health (LifeNet Health, Virginia Beach, Virginia), as described previously (Deisenroth et al., 2020). A certificate of analysis (COA) specifying available information on donor demographics (age, sex, race, and body mass index [BMI]), limited medical and social history (cause of death, medication, alcohol, tobacco/vaping, and illicit drug use), blood and HLA type, blood culture results, and a basic clinical chemistry panel were provided. Authorization for nonclinical research use was appropriately obtained and documented by LifeNet Health. Serological testing was performed to confirm donors were negative for human immunodeficiency virus, hepatitis B and C virus, syphilis, and SARS-CoV-2 virus. Positive IgG results for Epstein-Barr virus and cytomegalovirus were permitted. Donors were selected (Table 1) and characterized using a single vial of each donor lot, corresponding to 1 complete assay plate (Supplementary Figure 5), for the experiments described in this study (N = 32).
Human donor specifications
| Donor ID | Age | Sex | Race | BMI |
|---|---|---|---|---|
| EPATHY0013 | 36 | M | Caucasian | 37 |
| EPATHY0014 | 17 | M | African American | 27 |
| EPATHY0015 | 40 | F | Caucasian | 29 |
| EPATHY0017 | 33 | F | Caucasian | 27 |
| EPATHY0018 | 38 | M | African American | 37 |
| EPATHY0019 | 20 | M | Caucasian | 28 |
| EPATHY0021 | 39 | M | Caucasian | 27 |
| EPATHY0023 | 35 | F | Caucasian | 32 |
| EPATHY0024 | 50 | F | Caucasian | 37 |
| EPATHY0025 | 44 | F | Caucasian | 20 |
| EPATHY0027 | 22 | M | African American | 26 |
| EPATHY0028 | 30 | M | Caucasian | 37 |
| EPATHY0029 | 41 | M | Caucasian | 26 |
| EPATHY0030 | 49 | M | African American | 28 |
| EPATHY0031 | 32 | M | Caucasian | 33 |
| EPATHY0032 | 46 | M | Caucasian | 30 |
| EPATHY0033 | 24 | M | Caucasian | 36 |
| EPATHY0034 | 39 | M | Caucasian | 28 |
| EPATHY0035 | 22 | F | Caucasian | 24 |
| EPATHY0036 | 32 | M | Caucasian | 31 |
| EPATHY0037 | 54 | M | Caucasian | 34 |
| EPATHY0038 | 18 | M | Caucasian | 30 |
| EPATHY0040 | 38 | M | Caucasian | 24 |
| EPATHY0041 | 27 | M | African American | 23 |
| EPATHY0042 | 31 | M | Caucasian | 21 |
| EPATHY0043 | 24 | M | Caucasian | 28 |
| EPATHY0044 | 57 | F | Caucasian | 27 |
| EPATHY0045 | 21 | M | Caucasian | 22 |
| EPATHY0046 | 61 | M | Caucasian | 21 |
| EPATHY0047 | 26 | M | African American | 22 |
| EPATHY0050 | 20 | M | Caucasian | 19 |
| EPATHY0052 | 20 | F | African American | 18 |
EPA donor identification number for all 32 euthyroid donors examined in this study. Specifications for age, sex, race, and body mass index (BMI) are noted.
Cell culture medium formulation and supplemental reagents
Primary thyrocytes were cultured in TSH-free hTMT medium formulation (Supplementary Table 1), a modified version of h7H medium (Bravo et al., 2013). Nutrient mixture F-12 Ham Coon’s modified medium with l-glutamine and zinc sulfate was obtained from MyBioSource (San Diego, California). Human recombinant insulin, somatostatin, hydrocortisone, growth hormone, apotransferrin, sodium iodide, sodium selenite, reduced l-glutathione, dl± -α-tocopherol, dl− α-tocopherol acetate, and sodium bicarbonate were obtained from MilliporeSigma (Burlington, Massachusetts). Gibco charcoal-stripped fetal bovine serum and Gibco antibiotic-antimycotic (100×) were obtained from Thermo Fisher Scientific (Waltham, Massachusetts). Medium formulation was prepared in 1-l stock bottles, sterilized through 0.22 µM bottle top filters (Corning, New York), and used for up to 3 weeks.
Bovine TSH (catalog no. NIADDK-bTSH-12) was obtained from the National Hormone and Peptide Program, Harbor-UCLA Medical Center (Parlow, 2004) (Los Angeles, California). Human anti-thyroid-stimulating hormone receptor (TSHR) recombinant monoclonal antibody (clone K1-70) (Furmaniak et al., 2022) (catalog no. PABL-737) was obtained from Creative Biolabs (Shirley, New York).
Reference chemicals
Reference chemical name, DTXSID, CASRN, vendor, catalog number, stock concentration, assay classification, and thyroid mechanism are noted (Table 2). Chemicals were solubilized as 100 mM stock in DMSO and stored at −20°C. For each experimental run, fresh 20 mM solutions were diluted from 100 mM stock, plated in 384-well Labcyte Echo PP source plates (Perkin Elmer, Waltham, Massachusetts) and maintained at room temperature (20°C–22°C) in a desiccator for the duration of the experiment.
Reference chemicals
| Chemical name | DTXSID | CASRN | Vendor | Catalog number | Stock conc. (mM) | Classification | Mechanism |
|---|---|---|---|---|---|---|---|
| Dimethyl sulfoxide | DTXSID2021735 | 67-68-5 | MilliporeSigma | 276855-100ML | NA | Control—solvent | NA |
| Methomyl | DTXSID1022267 | 16752-77-5 | Cayman Chemical | 25610 | 20 | Reference—negative | NA |
| Methimazole | DTXSID4020820 | 60-56-0 | MilliporeSigma | PHR3037-500MG | 20 | Reference—antagonist | TPO inhibitor |
| 6-Propyl-2-thiouracil | DTXSID5021209 | 51-52-5 | MilliporeSigma | PHR2609-500MG | 20 | Reference—antagonist | TPO inhibitor |
| Sodium perchlorate | DTXSID1034185 | 7601-89-0 | MilliporeSigma | 410241-100G | 20 | Reference—antagonist | NIS inhibitor |
Specifications for chemical name, DSSTox substance identifier (DTXSID), CAS registry number (CASRN), vendor, catalog number, stock concentration (mM), assay classification, and thyroid mechanism are noted.
Human thyroid microtissue assay workflows
Modifications to the previously reported assay workflow (Deisenroth et al., 2020) were implemented to increase method accessibility, enhance workflow efficiency, and improve assay performance. Prior to seeding, 96-well black, optical bottom microplates (ThermoFisher Scientific, Waltham, Massachusetts) were coated with 50 µl of Matrigel Basement Membrane Matrix, Lactate Dehydrogenase Elevating Virus-Free (8–10 mg/ml) (Corning Life Sciences, Corning, New York) per well and incubated at 37°C in a cell culture incubator for 60 min to polymerize the hydrogel. Cell suspensions of primary human thyrocytes (5.0 × 10⁶ cells/vial) were thawed from cryopreservation, counted using a trypan blue exclusion method on a Countess II automated cytometer (Thermo Fisher Scientific, Waltham, Massachusetts), and directly seeded at 3.0 × 10⁴ viable cells/per well in 100 µl of TSH-free hTMT medium and maintained in the cell culture incubator set at 37°C and 5% CO2 for 48 h.
The microtissue model evaluation consisted of 3 control treatment (Tx) groups (Figure 1A and Supplementary Figure 5): (Tx-1, negative control) baseline effects in hTMT medium without TSH supplementation, (Tx-2, positive control) hTMT medium supplemented with TSH, and (Tx-3, TSH antagonist control) hTMT medium supplemented with TSH and human anti-TSHR K1-70 antibody. Control well treatments occurred on days 2–12 (Figure 1B) where TSH was supplemented in the hTMT on each day of treatment, as indicated in Tx-2 and Tx-3, to a final concentration of 1 mIU/ml. The K1-70 antibody was only supplemented in the hTMT on treatment days 8–12, as indicated in Tx-3, to a final concentration of 1 µg/ml. Routine cell culture monitoring was performed with an EVOS FL inverted microscope imaging system (ThermoFisher Scientific, Waltham, Massachusetts).
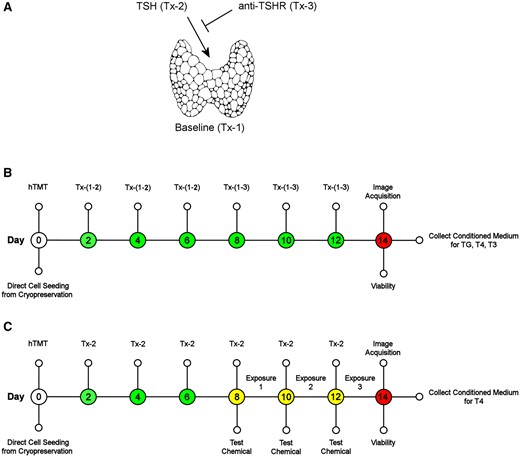
Human thyroid microtissue assay workflow. A, The microtissue model evaluation consisted of 3 control treatment (Tx) groups: (Tx-1, negative control) baseline effects in hTMT medium without TSH supplementation, (Tx-2, positive control) hTMT medium supplemented with TSH, and (Tx-3, TSH antagonist control) hTMT medium supplemented with TSH and human anti-TSHR K1-70 antibody. B, Human thyrocytes were thawed and seeded directly from cryopreservation into a 3D culture model on 96-well plates with control treatments at 2 day intervals. Microtissue morphology, analyte sampling (TG, T4, T3), and viability were assessed at day 14. C, Standard assay conditions utilized Tx-2 medium changes for the duration of the assay. Reference chemical and solvent control (0.5% DMSO) exposures were initiated on day 8 and repeated every 2 days for a total exposure duration of 6 days. The assay terminated on day 14 where microtissue morphology, analyte sampling (T4), and viability were assessed. Thyroglobulin (TG), thyroxine (T4), triiodothyronine (T3).
Reference chemical exposures followed the standard microtissue assay workflow (Figure 1C and Supplementary Figure 5) and were performed on days 8, 10, and 12 for a total duration of 6 days. Control treatment groups were also treated with and without solvent (0.5% DMSO) on days 8, 10, and 12 (Supplementary Figure 5). On each treatment day, test chemicals were dispensed into white 96-well microplates (Fisher Scientific, Hampton, New Hampshire) using a Labcyte Echo 555 acoustic liquid handler (Perkin Elmer, Waltham, Massachusetts). A 10-point dilution series (0.001–100 µM) was generated by dispensing test chemical and backfilling with a complementary volume of DMSO using Echo Cherry Pick software (v.1.6.2) to a 1-µl total dispense volume. hTMT medium supplemented with TSH (Tx-2) was dispensed to a total volume of 200 µl with a multichannel pipette and an Integra VIAFLO 96 liquid handling system (Integra Biosciences, Hudson, New Hampshire) was used to mix the treatment solution and replace the depleted medium in the assay plates at a final volume of 100 µl.
On day 14, representative brightfield images of control wells (Tx-1, Tx-2, and Tx-3) were acquired with 4× and 10× objectives on an EVOS FL imaging system to document microtissue morphology (Supplementary Figure 1). The conditioned medium was collected and cryopreserved in sealed 96-well V-bottom storage plates (ThermoFisher Scientific, Waltham, Massachusetts) for subsequent analysis of thyroglobulin (TG) protein (Figure 1B), T3 hormone (Figure 1B), and T4 hormone (Figs. 1B and 1C) concentrations.
A cellular adenosine triphosphate (ATP) viability assay was performed immediately following sample collection (Figs. 1B and 1C). A 1:1 (v:v) mix of CellTiter-Glo 2.0 (Promega, Madison, Wisconsin) and hTMT medium was added to the microtissues, incubated at room temperature (20°C–22°C) on a plate shaker set at 500 RPM for 5 min, and luminescence measured on a CLARIOstar microplate reader (BMG Labtech Inc, Cary, North Carolina). Spectrometer settings: emission (no filter), gain (3500), focal height (7 mm), and integration time (0.26 s).
Enzyme linked immunosorbent assays
Solid-phase enzyme-linked immunosorbent assays (ELISA) (ThermoFisher Scientific, Waltham, Massachusetts) were used for the detection and quantification of human thyroglobulin protein (catalog no. EHTG), T3 hormone (catalog no. EIAT3C), and T4 hormone (catalog no. EIAT4C) in the day 14 conditioned medium samples (Figs. 1B and 1C). ELISAs were performed according to the manufacturer’s protocols. Data collection was conducted on a CLARIOstar microplate reader (BMG Labtech Inc, Cary, North Carolina). Concentrations of unknown samples and controls were interpolated from a standard concentration series fit with a 4-parameter nonlinear regression curve using GraphPad Prism v9.0.0 (GraphPad Software, La Jolla, California). Thyroglobulin samples were run at a dilution of 1:1000 to fit within the linear range of the assay, T3 was diluted 1:1, and T4 samples were not diluted.
Assay performance evaluation
Data analysis
Data analyses and modeling were performed with GraphPad Prism (v9.0.0) (GraphPad Software, La Jolla, California). For the reference chemical exposures (Figure 1C and Supplementary Figure 5), the raw T4 or ATP concentrations were normalized for each donor/chemical pair as the percent response of the median plate-based solvent control (Tx-2 + 0.5% DMSO) to model the concentration-response series for T4 inhibition (Figs. 6–8 and Supplementary Figure 3) and cytotoxicity (Supplementary Figure 4), respectively.
Pearson correlation matrices for the log-transformed quantitative endpoints (biomass, thyroglobulin, T4, T3, or T4/T3 ratio) were computed to derive a correlation coefficient (r), 2-tailed p value, and 95% confidence interval. The threshold for positive correlation was r ≥ 0.5.
Multiple linear regression analysis was performed using a least squares regression model to evaluate the main effects relationship of donor demographic characteristics (age, sex, race, and BMI) to each performance endpoint (biomass, thyroglobulin, T4, T3, and T4/T3 ratio). Reference levels for categorical variables were established according to the most frequent features in the total cohort and set as male (sex) and Caucasian (race). Log-normal distribution of the residuals was confirmed with a D’Agostino-Pearson omnibus normality test. The goodness of fit was defined by the coefficient of determination (R2). Significance of the regression model was determined by analysis of variance (p value ≤ .05), and multicollinearity of the independent variables calculated by the variance inflation factor (VIF) where the threshold for collinearity set at VIF ≥ 4 (Supplementary Table 4). Simple linear regression was restricted to evaluating the relationship of the continuous independent variables (age, BMI) to the hormone-related endpoints (thyroglobulin, T4, and T3). The goodness of fit was defined by the coefficient of determination (r2) and significance of the regression model (p value ≤ .05) (Supplementary Table 5).
Results
Donor thyrocyte performance characterization
The study design utilized 3 control treatment groups to evaluate the biological performance of each donor: Tx-1—baseline effects without TSH exposure (negative control), Tx-2—maximum response with TSH exposure (positive control), and Tx-3—inhibition of TSH signaling with the anti-TSHR K1-70 antibody (TSHR antagonist control). A standard operating procedure was established which incorporated modifications to the previously reported hTMT assay workflow (Deisenroth et al., 2020) to increase method accessibility, enhance workflow efficiency, and improve assay performance. Human thyrocytes were thawed and directly seeded into a 3D culture model in 96-well plates. For the control groups, the self-assembled microtissues were allowed to grow and mature for 14 days with periodic treatments at 2-day intervals (Figure 1B). To evaluate reference chemical responses, the microtissues were matured up to day 8 prior to initiating test chemical exposures for a period of 6 days (Figure 1C). The control groups were also treated with or without solvent (0.5% DMSO) during the exposure period to evaluate solvent effects. On day 14, the assay was completed by acquiring micrograph images, collecting conditioned medium for analyte analysis, and measuring viability for all treatment groups and chemical exposures (Figs. 1B and 1C).
Donor-dependent recapitulation of normal thyroid gland function and overall homogenic competence were evaluated across the treatment groups with an endpoint battery consisting of ATP measurements for microtissue biomass, thyroglobulin protein production and secretion, T4 and T3 synthesis, and T4/T3 ratio. As expected, aggregate effects for all donors (N = 32) revealed significant differences between the control treatment groups (Figure 2). The exception was the T4/T3 ratio where a difference was only noted for Tx-1 and Tx-2, indicating proportional synthesis of T4 and T3 as a function of donor in the TSH exposure groups (Tx-2 and Tx-3). Generally, an increase in microtissue biomass, thyroglobulin production, and T4 and T3 hormone synthesis were observed in the Tx-2 (positive) treatment group relative to the Tx-1 (negative) group. Responses were suppressed in the Tx-3 group where TSH stimulation of TSHR was partially inhibited by the K1-70 antibody, indicating a TSH-specific response in the Tx-2 treatment group.
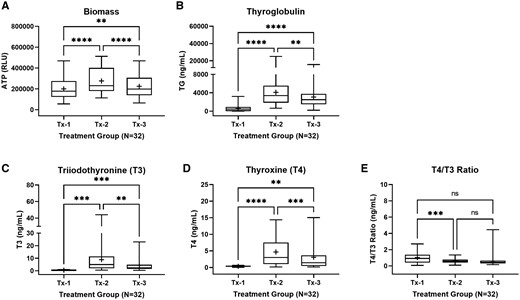
Summary characterization of thyroid microtissue endpoints at day 14. Thyroid microtissues for the total donor cohort (N = 32) were evaluated for (A) adenosine triphosphate (ATP) relative light units (RLU) as an indicator of biomass, (B) thyroglobulin protein production (ng/ml), (C) T3 hormone synthesis (ng/ml), (D) T4 hormone synthesis (ng/ml), and (E) T4/T3 ratio (ng/ml). Treatment groups included: Tx-1 (negative control), Tx-2 (positive control), and Tx-3 (TSH antagonist control). The summary distributions are represented in the box and whisker plots as the 1st percentile, 25th percentile, median, 75th percentile, and 99th percentile. The “+” symbol represents the mean value. ** (p ≤ .05), *** (p ≤ .01), *** (p < .001). Not significant (ns).
Microtissue number and well distribution were moderately consistent across the donors, whereas morphology was more variable (Supplementary Figure 1). The morphology was different among the treatment groups and dependent on the donor capacity for thyroid hormone synthesis with donors evenly distributed into “low, medium, and high” categories for comparative purposes. With respect to T4 production observed for each donor in the Tx-2 treatment group, effects on microtissue size were most pronounced with the high T4 producers (7–14 ng/ml), less pronounced with the moderate producers (2–6 ng/ml), and nearly indistinguishable with the low producers (0.2–1.1 ng/ml) (Figure 3A). There was no clear trend with respect to microtissue biomass (indicated by total ATP) and T4 synthesis, indicating total hormone yield was not strictly related to microtissue size (Figure 3B).
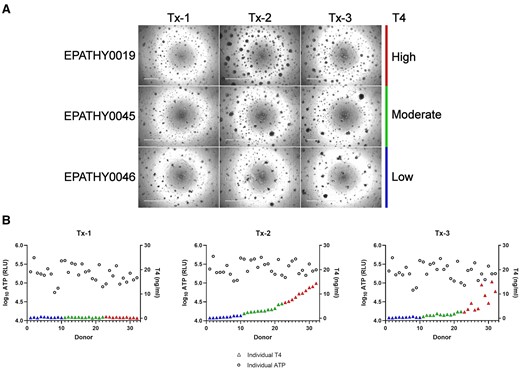
Summary characterization of microtissue morphology at day 14. A, Representative brightfield micrographs from a high (EPATHY0019), moderate (EPATHY0045), and low (EPATHY0046) T4-producing donor across the 3 treatment groups (Tx-1, Tx-2, Tx-3). Scale bar is 1000 µM. B, The log10 ATP relative light units (RLU) across the 3 treatment groups (Tx-1, Tx-2, Tx-3) plotted with each independent donor T4 concentration (ng/ml) (color-coded triangles) at day 14.
Donor thyrocyte qualification
The capacity to produce thyroid hormone is a critical feature of the microtissue assay and requires careful consideration when selecting suitable donor thyrocytes that will yield reliable outcomes. The distribution of performance effects was evaluated across the total donor cohort for the Tx-1 (negative) and Tx-2 (positive) groups to evaluate the observed range of each endpoint and set minimum acceptance criteria for hormonogenic competence (Figure 4). Lower confidence limits (99%) for the Tx-2 treatment group, representing the biological state most closely simulating the thyroid gland, were established for biomass (189 321 RLU), thyroglobulin (1961 ng/ml), T4 (1.07 ng/ml), T3 (2.02 ng/ml), and T4/T3 ratio (0.45 ng/ml) (Table 3).
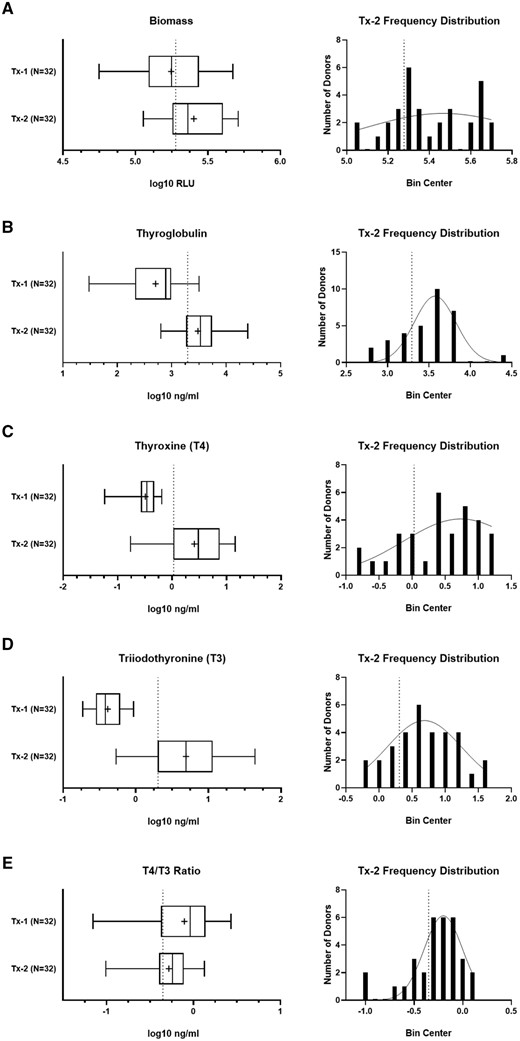
Establishment of confidence limits for the characterization endpoints. The Tx-1 and Tx-2 treatment group data for the total donor cohort (N = 32) for (A) biomass, (B) thyroglobulin, (C) T4, (D) T3, and (E) T4/T3 ratio. The summary distributions are represented in the box and whisker plots as the 1st percentile, 25th percentile, median, 75th percentile, and 99th percentile. The “+” symbol represents the mean value. The donor frequency distribution is plotted for the Tx-2 treatment group for each corresponding endpoint. The vertical dashed line indicates lower confidence limits calculated by each endpoint-specific Tx-2 group.
Donor thyrocyte qualification parameters
| Donor thyrocyte qualification | |||||
|---|---|---|---|---|---|
| Tx-2 99% CI | Biomass (RLU) | Thyroglobulin (ng/ml) | T4 (ng/ml) | T3 (ng/ml) | T4/T3 ratio (ng/ml) |
| Median | 230 197 | 3405 | 3.03 | 4.94 | 0.57 |
| Lower confidence limit | 189 321 | 1961 | 1.07 | 2.02 | 0.45 |
| Criteria | ≥180 000 | ≥1900 | ≥1.0 | ≥2.0 | ≥0.4 |
| Priority | Optional | Optional | Required | Recommended | Optional |
The median value and 99% lower and upper confidence limits for the Tx-2 treatment group are specified for microtissue biomass, thyroglobulin, T4, T3, and T4/T3 ratio. The criteria for qualification are based on the lower confidence limits with optional or required priority levels for assay qualification.
Plate-based assay performance metrics summary
| Total cohort (N = 32) | Qualified cohort (N = 24) | ||||
|---|---|---|---|---|---|
| Solvent (DMSO) | Performance metrics | T4 median (±MAD) | T4 range | T4 median (±MAD) | T4 range |
| 0% | Dynamic range (rS/B) | 7.0 (±8.7) | 0.5–211.8 | 9.5 (±6.3) | 3.9–211.8 |
| Precision (rCV) | 8.3 (±6.8) | 1.2–51.7 | 7.9 (±6.8) | 1.2–21.4 | |
| Screening quality (rZ′-factor) | 0.56 (±0.42) | −823.94–0.94 | 0.64 (±0.35) | −0.57–0.94 | |
| 0.5% | Dynamic range (rS/B) | 9.9 (±8.5) | 0.5–508.8 | 11.6 (±7.0) | 2.6–508.8 |
| Precision (rCV) | 11.8 (±6.1) | 0.6–60.3 | 10.6 (±5.4) | 0.6–24.0 | |
| Screening quality (rZ′-factor) | 0.53 (±0.37) | −17.50–0.94 | 0.61 (±0.25) | 0.00–0.94 | |
Robust statistical calculations of the dynamic range (rS/B), technical precision (rCV), and assay screening quality (rZ′-factor) for the T4 concentrations at day 14. Analyses are grouped by solvent effects (± 0.5% DMSO) and donor cohort (total versus qualified). The T4 median, median absolute deviation (MAD), and range are noted.
Given the focus on hormone synthesis, emphasis was placed on thyroglobulin, T4 and T3 concentrations as candidate endpoints for donor thyrocyte qualification. In the Tx-2 treatment group, thyroglobulin was positively correlated with T4 (r = 0.55) and T3 (r = 0.66), indicating a relationship between the protein scaffold for hormone production and final hormone products (Figure 5A) (Citterio et al., 2019). However, the strongest correlation was exhibited by T4 with T3 (r = 0.88) where independent donors generally produced hormone in proportional levels. Using the lower confidence limits established for these 3 endpoints (Table 3) revealed reasonable separation of qualified versus nonqualified donors based on thyroglobulin and T4 (Figure 5B) or T3 (Figure 5C). In these cases, there were several donors that met at least 1 proposed acceptance criteria, making donor exclusion more challenging. The high correlation of T4 and T3 enabled greater separation of donors that distinguished qualified (N = 24) from nonqualified (N = 8) donors from the initial cohort (Figure 5D). Based on this assessment, T4 and T3 were deemed the most suitable endpoints to qualify donors for hormonogenic competence in the microtissue assay. Donor qualification criteria and priority classifications were established based on these findings (Table 3). It is of interest to note that up to 25% of donors would not qualify for use in the assay based on the data generated in this cohort.
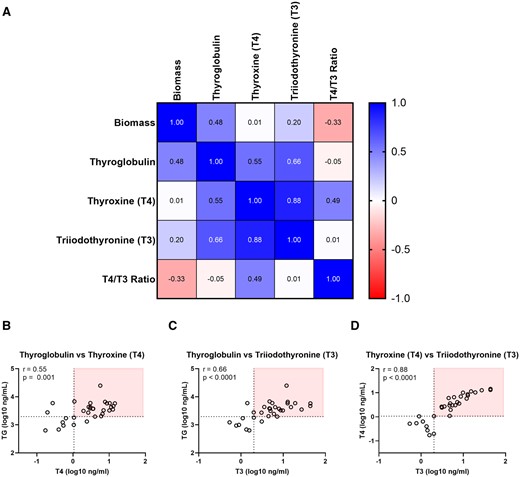
Stratification of qualified and nonqualified donors based on hormonogenic competence. (A) Pearson correlation of characterization endpoints at day 14 in the Tx-2 treatment group (N = 32). Values greater than 0 indicate a positive correlation, less than 0 a negative correlation, and 0 as no correlation. Correlation plots for (B) thyroglobulin and T4, (C) thyroglobulin and T3, (D) T4 and T3. The horizontal dashed line indicates the lower confidence limit for the parameter on the y-axis, the vertical dashed line indicates the lower confidence limit for the parameter on the x-axis. The red box distinguishes donors that meet qualification criteria (Table 3) for both plotted parameters.
Thyroid microtissue assay technical performance metrics
A typical end user employing the thyroid microtissue assay is likely to use lots of cells derived from different donors, meaning there will be inherent variability in the biological responses. To this end, the dynamic range, precision, and screening quality of the assay were determined for the total (N = 32) versus qualified (N = 24) cohort using the T4 endpoint to evaluate how technical performance changed when selecting qualified donors. Additional consideration of solvent effects (0.5% DMSO) was included in the experimental design to evaluate the impact on assay performance.
The median dynamic range, evaluated by the robust signal (Tx-2) to background (Tx-1) ratio (rS/B), improved from 7.0 to 9.5 fold-change in the qualified cohort in the absence of solvent (Table 4). It is worth noting the median dynamic range increased by 41% in the total (9.9 fold-change) and 22% in the qualified (11.6 fold-change) cohorts exposed to solvent, indicating a positive association of DMSO exposure to thyroid hormone synthesis. The rS/B range was broad in the total (0.5–508.8 fold-change) or qualified (2.6–508.8 fold-change) solvent-exposed cohorts, reflecting both the range of T4 synthesis across the donors (0.2–14.4 ng/ml) and the variability in the background levels of T4 in the conditioned cell culture medium.
Solvent exposure modestly decreased precision, measured by the robust coefficient of variation (rCV), of technical replicates across both cohorts (Table 4). Precision, however, was improved in the qualified cohort in both solvent-free and exposed conditions. Median rCV values across all conditions were less than 12%, indicating a high level of precision for all groups. The range considerably improved in the solvent-exposed qualified cohort where all rCV values (0.6–24.2) were less than a typical benchmark of 30%.
The median robust Z′-factor (rZ′-factor), a measure of overall screening quality where values <0 are unacceptable, >0–0.5 are acceptable, and >0.5–1 are excellent (Zhang et al., 1999), was 0.53 (±0.37) in the total cohort, improving to 0.61 (±0.25) in the qualified cohort for the solvent exposure group (Table 4). The range was narrowed from −17.50 to 0.94 for the total cohort to 0.00–0.94 for the qualified cohort, indicating each independent qualified donor was considered marginally acceptable to excellent in terms of screening quality.
Despite the use of independent donors, the technical reproducibility across all metrics was supported in the variable-donor thyroid microtissue assay platform when using qualified donors. Based on these data, quantitative assay performance parameters were established with required minimum criteria that are notably permissive to a range of performance that will be encountered in the variable-donor platform as new donors are evaluated (Supplementary Table 2).
Reference chemical assessments
The thyroid microtissue assay is an integrated systems model representing multiple molecular targets (eg, TSHR, TPO, NIS, DIO) within the thyroid gland that drive functional thyroid hormone synthesis. Prior work demonstrated how chemical inhibitors of TSHR, TPO, and NIS could inhibit T4 synthesis in a concentration-dependent manner (Deisenroth et al., 2020). Reference chemicals selected for this study were intended to provide coverage of key molecular targets that (1) are most likely to inhibit thyroid hormone synthesis, (2) are procurable and specific to the intended mechanism-of-action, (3) represent both positive and negative bioactivity, and (4) are amenable to proficiency testing for method transfer. To this end, the thyroid hormone synthesis inhibitors methimazole and 6-propy-2-thiouracil (TPO inhibitors), and the industrial chemical sodium perchlorate (NIS inhibitor), were selected as positive reference chemicals. The carbamate insecticide methomyl was selected as a negative reference chemical because it had no prior evidence of in vitro or in vivo thyroid bioactivity (Wegner et al., 2016).
Population-level modeling of methimazole revealed a reasonable regression model fit (R2 = 0.51) with an IC10 POD of 17 nM (95% confidence interval [CI]: 0.2–128 nM) for the total donor cohort (Figure 6A). Restricting the data modeling to the qualified donor cohort improved the model fit (R2 = 0.89) and adjusted the IC10 to 53 nM (95% CI: 29–94). Using a leave-one-out approach based on donor-level T4 production, the goodness of fit was evaluated by removing the lowest T4 producing donor 1 at a time. Exclusion of nonqualified donors coincided with stabilization of the R2 values despite divergence in the mean T4 production within each qualified donor group (Figure 6B). Likewise, the variability in the IC10 POD decreased and stabilized as nonqualified donors were removed from sampling (Figure 6C).
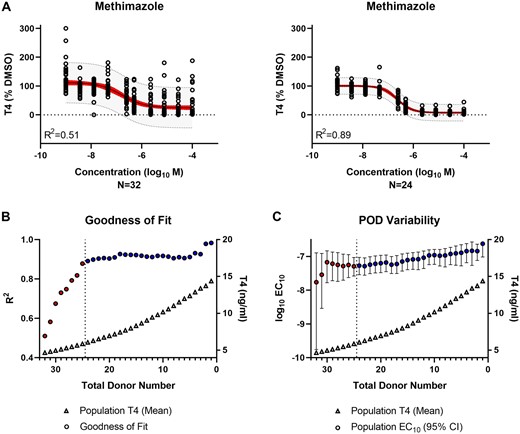
Evaluation of thyroid hormone synthesis inhibition by reference chemical—methimazole. A, Population-level concentration-response modeling of the total (N = 32) versus qualified (N = 24) donor cohort. The values were normalized by donor and plotted in aggregate for data modeling. The red band represents the 95% confidence interval of the model fit. The gray band indicates the 95% prediction interval where 95% of future donors would be expected to exhibit bioactivity. B, The model goodness of fit (circles) is represented by the regression coefficient of determination (R2) for the donor population sub-groups (N = 1–32) containing qualified only (blue) or qualified and nonqualified (red) donors. The T4 concentration (triangles) represent the mean T4 production for each donor subgroup. The vertical dashed line indicates the donor acceptance threshold. C, The variability in the IC10 potency (log10 M) point of departure (POD) (circles) is represented for the donor population subgroups (N = 1–32) containing qualified only (blue) or qualified and nonqualified (red) donors. The median (circles) and 95% confidence interval range (error bars) are shown. The T4 concentration (triangles) represents the mean T4 production for each donor subgroup. The vertical dashed line indicates the donor acceptance threshold.
A similar trend was observed for 6-propyl-2-thiouracil where the regression model fit improved in the qualified donor cohort from an R2 of 0.62–0.90 (Figure 7A). The IC10 also shifted from 27 nM (95% CI: 4–93 nM) to 76 nM (95% CI: 46–115 nM). Goodness of fit (Figure 7B) and POD variability (Figure 7C) improved and stabilized in the qualified donor cohort.
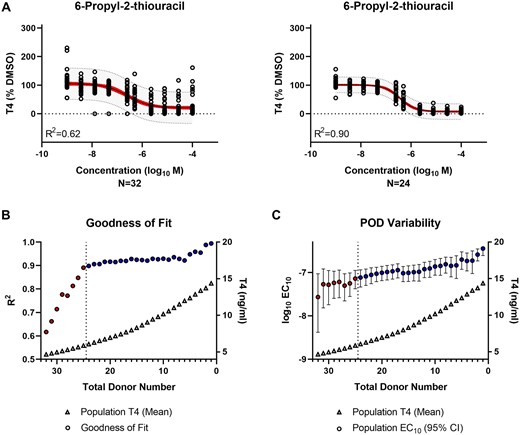
Evaluation of thyroid hormone synthesis inhibition by reference chemical—6-propyl-2-thiouracil. A, Population-level concentration-response modeling of the total (N = 32) versus qualified (N = 24) donor cohort. The values were normalized by donor and plotted in aggregate for data modeling. The red band represents the 95% confidence interval of the model fit. The gray band indicates the 95% prediction interval where 95% of future donors would be expected to exhibit bioactivity. B, The model goodness of fit (circles) is represented by the regression coefficient of determination (R2) for the donor population sub-groups (N = 1–32) containing qualified only (blue) or qualified and nonqualified (red) donors. The T4 concentration (triangles) represent the mean T4 production for each donor subgroup. The vertical dashed line indicates the donor acceptance threshold. C, The variability in the IC10 potency (log10 M) point of departure (POD) (circles) is represented for the donor population subgroups (N = 1–32) containing qualified only (blue) or qualified and nonqualified (red) donors. The median (circles) and 95% confidence interval range (error bars) are shown. The T4 concentration (triangles) represents the mean T4 production for each donor subgroup. The vertical dashed line indicates the donor acceptance threshold.
The NIS inhibitor, sodium perchlorate, exhibited similar patterns as the TPO inhibitors. Regression modeling improved by excluding nonqualified donors (R2 of 0.39–0.71) without adjustment to the IC10 POD of 4 µM (95% CI: 2–6 µM) for the total cohort to 4 µM (95% CI: 2–6 µM) for the qualified cohort (Figure 8A). There was a less clear plateau on the goodness of fit but the trend was still evident (Figure 8B), as was a more moderate decrease in POD variability (Figure 8C).
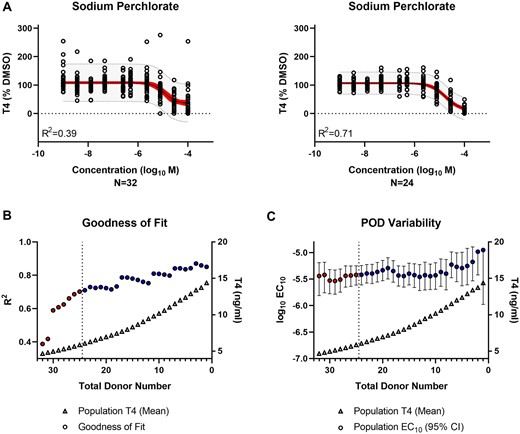
Evaluation of thyroid hormone synthesis inhibition by reference chemical—sodium perchlorate. A, Population-level concentration-response modeling of the total (N = 32) versus qualified (N = 24) donor cohort. The values were normalized by donor and plotted in aggregate for data modeling. The red band represents the 95% confidence interval of the model fit. The gray band indicates the 95% prediction interval where 95% of future donors would be expected to exhibit bioactivity. B, The model goodness of fit (circles) is represented by the regression coefficient of determination (R2) for the donor population sub-groups (N = 1–32) containing qualified only (blue) or qualified and non-qualified (red) donors. The T4 concentration (triangles) represent the mean T4 production for each donor sub-group. The vertical dashed line indicates the donor acceptance threshold. C, The variability in the IC10 potency (log10 M) point of departure (POD) (circles) is represented for the donor population subgroups (N = 1–32) containing qualified only (blue) or qualified and nonqualified (red) donors. The median (circles) and 95% confidence interval range (error bars) are shown. The T4 concentration (triangles) represents the mean T4 production for each donor subgroup. The vertical dashed line indicates the donor acceptance threshold.
As expected, there was no bioactivity observed for the negative reference chemical, methomyl (Supplementary Figure 3). However, the assay noise was still reduced when restricting analysis to the qualified donor cohort. Collectively, donor qualification improved the data modeling and decreased uncertainty in the chemical potency determinations for the reference chemical responses. As a result, the IC10 and IC50 potency values established from the qualified cohort provide benchmarks for future proficiency testing of the test method (Table 5).
Reference chemical benchmarks for proficiency testing
| Proficiency testing benchmarks | |||
|---|---|---|---|
| Reference chemical | IC10 (95% CI) | IC50 (95% CI) | Units |
| Methimazole | 53 (29–94) | 234 (190–277) | nM |
| 6-Propyl-2-thiouracil | 76 (46–115) | 363 (311–422) | nM |
| Sodium perchlorate | 4 (2–6) | 18 (12–29) | µM |
| Methomyl | NA | NA | NA |
Reference chemical IC10 and IC50 potency values with 95% confidence intervals (CI) derived from the concentration-response modeling of the qualified donor cohort (N = 24). The potency units are noted. Not applicable, NA.
Evaluation of performance parameters influenced by donor demographics
Given the potential to exclude upwards of 25% of donors from qualifying for use in the assay, identification of demographic features more favorable to robust and reliable in vitro performance could improve donor thyroid procurement efforts. Multiple linear regression analysis was performed on the total donor cohort to evaluate the contributions of donor age, sex, race, and BMI to thyroid microtissue biomass, thyroglobulin production, T4 and T3 synthesis, and the T4/T3 ratio for the Tx-2 treatment group. Regression models were statistically significant (Supplementary Table 4) for microtissue biomass (Figure 9A), thyroglobulin (Figure 9B), and T3 (Figure 9D), but not for T4 (Figure 9C) or the T4/T3 ratio (Figure 9E). Of the significant models, 41%–60% of the total variance was explained by the demographic features and no major multicollinearity was observed with VIFs < 1.2 (Supplementary Table 4). BMI was the most prominent variable contributing to effects in all the significant models. Age was also a major factor for thyroglobulin and T3. Both donor sex and race were insignificant across all models, potentially due to the limited sample size.
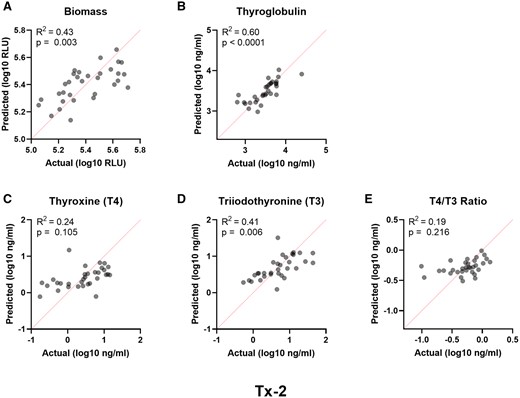
Performance parameters influenced by donor demographics. Multiple linear regression analyses of independent donor variables (age, race, sex, BMI) relative to the measured endpoint variables in the Tx-2 treatment group for (A) biomass, (B) thyroglobulin, (C) T4, (D) T3, and (E) T4/T3 ratio. The actual versus predicted values are represented on the x- and y-axis, respectively. The red dashed line is the line of identity. The regression model fits are represented by the regression coefficient of determination (R2).
Given the importance of age and BMI, simple linear regression models for the Tx-2 treatment group were applied to thyroglobulin (Figs. 10A and 10D), T4 (Figs. 10B and 10E) and T3 (Figs. 10C and 10F) as major determinants of hormonogenic competence. All regression models were significant (Figure 10 and Supplementary Table 5) with the exception of T4 and BMI (Figure 10E). A downward slope was noted in all the models, indicating increased age and BMI had a negative impact on performance. Thyroglobulin production was the strongest predicted endpoint for age (r2 = 0.38) and BMI (r2 = 0.32), followed by weaker associations of T3 for age (r2 = 0.22) and BMI (r2 = 0.20), and T4 for age only (r2 = 0.13). Application of the minimum acceptance criteria for thyroglobulin, T4, and T3 (Table 3) suggests donors with an age ≤ 56 years old and BMI ≤ 37 are more likely to exhibit reliable performance in the hTMT assay (Supplementary Table 3).
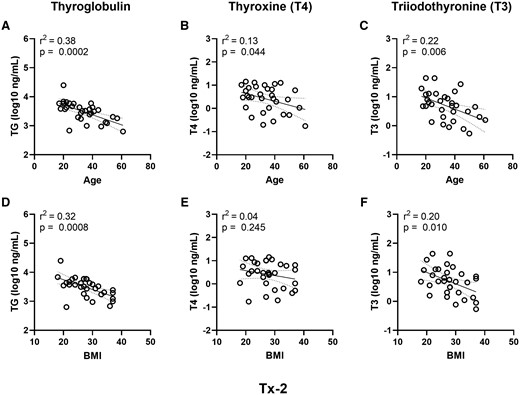
Donor age and BMI trends for the hormonogenic competence endpoints. Simple linear regression analyses of age (years) (A–C) and BMI (D–F) relative to the Tx-2 treatment group variables for hormone synthesis (A and D) thyroglobulin, (B and E) T4, and (C and F) T3. The dashed lines represent the 95% confidence interval of the regression line. The regression model fits are represented by the regression coefficient of determination (r2).
Discussion
Human thyroid microtissues are an organotypic model system that enhance biological and species relevance when evaluating potential thyroid disrupting chemicals (Deisenroth et al., 2020; Hopperstad et al., 2021). Complicating efforts to establish a transferable, standardized test system for toxicity screening is the use of primary cells which are sourced from human donors and reflect differences in a number of factors (eg, genetic, physiological, environmental conditions) that contribute to underlying biological variability. Although a variable-donor platform holds promise for evaluating a range of human responses, it conflicts with conventional wisdom that assumes an in vitro cell-based test method have a narrowly defined set of technical performance parameters to be replicated by any end user. It is recognized that insufficient reproducibility is a widespread problem in biomedical sciences (Baker, 2016); an issue particularly prevalent in the area of cell-based NAMs where innovations highlighting advances in the biology of complex culture systems has outpaced efforts to standardize materials and qualify the cells for use in these model systems (Rusyn and Roth, 2021; Rusyn et al., 2022). Thus, increasing confidence in the adoption and implementation of the thyroid microtissue assay requires understanding the biological variability intrinsic to a broader donor population to establish minimum donor qualification standards, assay performance guidelines, and reference chemical benchmarks necessary for method transfer and validation.
The candidate donors selected for this study were comprised of individuals primarily representing an adult, euthyroid population. Optimal representation is difficult to define from a regulatory perspective because decision contexts may involve specific genetic, physiological, environmental, and life stage factors to classify subpopulations or potentially sensitive subgroups. As a practical consideration, the composition of the donor cohort was subject to thyroid gland procurement and availability. The median age was 33 (range 17–61) years with limited sampling of minor or elderly individuals. There were no observations of sex- or race-dependent differences in microtissue performance, but this could be attributed to the overrepresentation of males (N = 24) to females (N = 8), and restriction of racial demographics to Caucasian (N = 25) and African American (N = 7) individuals. Regarding the contribution of metabolic disease, the median BMI was 28 (range 18–37), supporting a broad range of body weights from underweight to obese individuals (Flegal et al., 1998). The sample size (N = 32) was large for an in vitro study, and on par with other recent publications exploring population variability (Bowers et al., 2022; Grimm et al., 2018), but was still limited in size and may lack statistical power to observe more subtle differences in certain assay endpoints influenced by donor characteristics. A recently developed Bayesian methodology using a large panel of approximately 1000 lymphoblastoid cell lines suggests donor sample sizes ≥ 20 are sufficient to evaluate variability with reasonable accuracy and precision (Chiu et al., 2017). Likewise, power calculations of 25 donors in a human bronchial epithelial cell air-liquid interface model exposed to ozone determined sample size requirements were dependent on the assay endpoint, but a range of 13–27 donors was sufficient to predict response variation in several cases (Bowers et al., 2022). An organotypic model utilizing a panel of iPSC-derived cardiomyocytes from 27 donors also established that variability in baseline phenotypes and chemical responses were not only reproducible, but could also be attributed to intrinsic biological variability as opposed to experimental variation (Grimm et al., 2018). Thus, the evaluation of 32 donors in this study to evaluate baseline phenotypes and chemical-specific responses in thyroid microtissues was deemed sufficient to establish credible qualification and performance standards.
A battery of endpoints was useful for characterizing the capacity of each donor to reproduce the form and function of the thyroid gland. The assay protocol was improved over the previous version (Deisenroth et al., 2020) by simplifying the serum used in the cell culture medium to enhance the dynamic range of thyroid hormone measurements (Supplementary Table 1), enabling direct plating of thyrocytes from cryopreservation to avoid cell culture maintenance and recovery, and adding a dosing interval to expand the total exposure window to 6 days (Figure 1C). Donors demonstrated a range of responses to TSH exposure that were reflected in microtissue size and morphology, as well as thyroid hormone synthesis. Indeed, hormonogenic competence is what distinguishes 3D microtissues from conventional 2D thyrocyte models and is the quintessential feature when considering donor qualification in the assay. Despite the considerable range in T4 synthesis, there were clear positive correlations between thyroglobulin, T3, and T4. The high correlation between T3 and T4, in particular, suggests coordinated and proportional synthesis of hormone analytes across each independent donor, as reflected in the narrow distribution of T4/T3 ratios (mean 0.61; 95% CI: 0.5–0.7). The typical human thyroid gland secretes 85 µg of T4 and 6.5 µg of T3 daily to yield a ratio of approximately 13:1 (Jonklaas et al., 2014; Pilo et al., 1990). This is in clear contrast to the microtissue model where T4 and T3 are produced in nearly equivalent concentrations, skewed toward T3 as the dominant analyte. The observation is fairly consistent across all the donors with few exceptions, but the mechanistic basis is not clear. A microphysiological system utilizing human thyroid follicles recently reported T3 as the only detectable hormone in the test system (Kühnlenz et al., 2023), supporting what may be a unique anomaly to static- or microfluidic-based human in vitro thyroid models.
Examination of solvent tolerance is a common and necessary component of assay development to evaluate potential negative impacts of solvents on cell viability, as well as the phenotype of interest. Contrary to detrimental impacts observed in some cell types, DMSO exposure enhanced the dynamic range of T4 production by 22% in microtissues derived from the qualified cohort, without any impact on viability. DMSO has been used to induce differentiation of a number of cell types by altering epigenetic profiles (Aninat et al., 2006; Edwards et al., 1983; Hay et al., 2008; Iwatani et al., 2006; Lyman et al., 1976; Young et al., 2004). Despite being isolated directly from the thyroid gland and limited in the number of population doublings, the primary thyrocytes used in the microtissue assay appear to benefit from DMSO exposure by potentially altering epigenetic markers that enhance hormone production. Leveraging this observation to future work may be important for maximizing the differentiated state of thyrocytes within microtissues or isolated follicles, in addition to increasing sensitivity to thyroid toxicants by enhancing the assay dynamic range.
Sourcing high quality cells for organotypic model systems is a key factor to reproducibility (Hirsch and Schildknecht, 2019; Rusyn et al., 2022), so it stands to reason that instilling confidence in NAMs with complex phenotypes starts with setting quality control criteria for donor qualification. The Organization for Economic Cooperation and Development has defined principles of good cell culture practice that include guidelines for cell and tissue sourcing, transport, handling and maintenance, cryopreservation, lineage tracing, contaminant screening, and functional evaluation (OECD, 2018). Minimum performance standards have been explored in more established organ models such as the liver (Baudy et al., 2020; Vinken and Hengstler, 2018) where technical variability in the results from studies of primary human hepatocytes is widely acknowledged (Michailidis et al., 2020), but this issue has generally been overlooked for less established systems. Given the interest in T3 and T4 as the major secretory products of the thyroid gland, and the primary endpoints in the microtissue assay, it was reasonable to establish minimum acceptance criteria for donor performance using these parameters. Lower confidence limits for T4 and T3 (Table 3) were effective thresholds for stratifying qualified from non-qualified donors. Quantitative performance metrics for dynamic range, precision of technical replicates, and overall screening quality were all improved when removing non-qualified donors (Table 4). It is important to note that a typical end user of the assay would most likely source qualified lots of cells from single donors, so the range of performance was of particular importance. Implementation of minimum acceptance criteria illustrate how the lower bound (dynamic range, screening quality) and upper bound (precision) range values in the solvent exposed group, representing the poorest performing qualified donors within specified assay conditions, were within acceptable limits of assay performance. As a result, required, recommended, and optional donor acceptance criteria (Table 3) and assay performance standards (Supplementary Table 2) were established for human thyrocytes in the assay. Adoption and reporting of these criteria in a COA by commercial vendors would lower the barrier to end user adoption by increasing confidence in cell sourcing, reducing the cost associated with failed lots of cells, and standardizing evaluation criteria by regulators when considering data generated in the assay.
Classification of qualified donors resulted in 25% of the total cohort being excluded from data analysis. Variability in donor performance could, in part, be explained by the procurement and isolation process of primary cells entailing organ isolation and stabilization, transport, digestion, recovery, and cryopreservation. Compounding variability in these technical and logistical factors are the underlying biological variables determined by donor demographic characteristics (eg, age, race, ethnicity, sex, BMI), as well as other social and environmental features attributed to lifestyle (eg, medications, dietary supplements, alcohol, and illicit drug use). Multiple linear regression models exploring the impact of age, sex, race, and BMI on baseline thyroid hormone synthesis revealed these factors explained 41%–60% of the variance in the models of statistical significance, meaning approximately half of the variance was attributed to other unknown factors (Figure 9). Of interest was the strong relationship of these variables to thyroglobulin synthesis. This seems reasonable because thyroglobulin gene expression and translation is a primary effect of TSH stimulation in thyrocytes (Di Lauro et al., 1995), thus representing a key indirect biomarker for TSHR expression and sensitivity. There was a clear inverse relationship of thyroglobulin synthesis to age and BMI where older donors, or those with higher body mass, were less responsive to TSH (Figure 10). As downstream products of thyroglobulin, T3 and T4 exhibited similar patterns, though with less precision. The reasons for these observations are not immediately clear but provide a basis for establishing donor procurement guidelines that may increase efficiencies in lot-to-lot performance by enhancing the probability for successful donor qualification. Extrapolation of age and BMI characteristics based on minimum qualification criteria (Table 3) were proposed to improve donor selection (Supplementary Table 3). The data emphasize the importance of cell quality and point to natural limitations in the thyroid microtissue assay. It is important to accept that establishing confidence in the adoption of the assay may require limitations on health and lifestage parameters to ensure reliable in vitro performance, despite an interest in evaluating all lifestages and sensitive subgroups from a regulatory perspective. However, many currently employed animal toxicity tests also provide limited data on certain lifestages and sensitive subgroups and, as such, it is common for regulatory risk assessments to address these types of potential concerns through application of a safety factor (EPA, 2002, 2006).
Evaluation of fundamental assay predictivity and experimental proficiency starts with the reference chemicals. There are a number of molecular targets (eg, TSHR, TPO, NIS) in the thyroid hormone synthesis pathway that are essential for T4 and T3 production. Selection of well-established true positive chemicals in the assay included the antithyroid drugs methimazole and 6-propyl-2-thiouracil which target the TPO enzyme to reduce thyroid hormone synthesis. The type I deiodinase (DIO1) enzyme is expressed in the thyroid and also inhibited by 6-propyl-2-thiouracil, but with weaker potency than inhibition of the TPO enzyme (Olker et al., 2019). Effects on DIO1 activity were not evaluated in this study. The industrial propellant, sodium perchlorate, was also selected as a competitive inhibitor of NIS-mediated iodide transport to effectively reduce iodine availability for hormone production. Although not a reference chemical per se, the anti-TSHR K1-70 antibody (Furmaniak et al., 2022) was included as a control item to demonstrate suppression of the TSHR and support specificity of the TSH responses. Collectively, these compounds support the mechanistic inhibition of hormone synthesis in the microtissue model at what are arguably the most significant targets in the thyroid gland (Noyes et al., 2019). The carbamate insecticide, methomyl, was selected as the negative control because it had previously been identified based on a lack of evidence for in vivo or in vitro thyroid disruption (Wegner et al., 2016). All 4 chemicals demonstrated the expected bioactivity (Figs. 6–8 and Supplementary Figure 3) without any evidence of cytotoxicity (Supplementary Figure 4) across a broad concentration range. Donor-based data normalization was an essential feature to support reproducibility of chemical effects across many donors. Exclusion of nonqualified donors improved the precision of the data modeling and reduced uncertainty in the POD calculations in a manner that suppressed technical variability to increase confidence in inter-individual responses. The 3 positive chemicals exhibited IC10 potency values that were within an approximate 2–3 fold difference in the 95% CI of the qualified cohort (Table 6), supporting high reproducibility in the microtissue assay.
For comparative purposes, the IC50 potency value and 95% CI were calculated (Table 5) to benchmark against other in vitro, ex vivo, and in vivo models (Supplementary Table 6). The methimazole IC50 of 234 nM (95% CI: 190–277 nM) in the microtissue model was in the range previously reported for high-throughput TPO inhibition assays using rat microsomes (IC50: 0.025–5.6 µM) (Paul et al., 2013, 2014; Vickers et al., 2012), and considerably more potent than porcine (IC50: 0.67–5.7 µM) (Hornung et al., 2015; Jomaa et al., 2015; Paul et al., 2013; Tietge et al., 2013) and human (IC50: 0.8–4 µM) (Jomaa et al., 2015; Nagasaka and Hidaka, 1976) microsomes or lysates, ex vivo models of rat thyroid (LOEC: 10 µM) (Vickers et al., 2012), porcine follicles (LOEC: 100 µM) (Sugawara et al., 1999), Xenopus laevis thyroid gland explants (IC50: 10–13 µM) (Hornung et al., 2010, 2015), and human organotypic culture slices (LOEC: 10 µM) (Vickers et al., 2012). The methimazole IC50 was also less than the maximum serum concentration (Cmax) of approximately 1.9 ± 0.7 µM observed in euthyroid human subjects administered a 10-mg therapeutic dose (Okamura et al., 1986), supporting the biological relevance of the microtissue model. The 6-propyl-2-thiouracil IC50 of 363 nM (95% CI: 311–422 nM) was in the range for TPO inhibition in rat microsomes (IC50: 0.12–1.28 µM) (Paul et al., 2013, 2014), but significantly more potent than porcine (IC50: 10.7–41.6 µM) (Jomaa et al., 2015; Paul et al., 2013) and human (IC50: 2–35.2 µM) (Jomaa et al., 2015; Nagasaka and Hidaka, 1976) microsomes or lysates, as well as an ex vivo X. laevis explant model (IC50: 8.6 µM) (Hornung et al., 2010). Likewise, the IC50 of 18 µM (95% CI: 12–29 µM) for sodium perchlorate indicated weaker potency than observed in the human hNIS-HEK293(T) (IC50: 0.87–1 µM) (Hallinger et al., 2017; Lecat-Guillet et al., 2008) or rat FRTL-5 (IC50: 0.14–0.20 µM) (Lecat-Guillet et al., 2008; Waltz et al., 2010) RAIU assays. Importantly, these reference chemical observations extend the known mechanism of action to a functional phenotype in the context of a reproducible human-relevant tissue model.
Continued development, validation, and regulatory adoption of NAMs are needed for evaluating thyroid-related toxicity without the use of animal testing. The hTMT assay fills an important “key event” gap in the context of the thyroid AOP network (Noyes et al., 2019) by enabling functional testing of potential thyroid toxicants on hormone synthesis. The establishment of guidelines for donor procurement and primary thyrocyte qualification move the technology toward standardization in a manner that directly addresses cell quality as a key vulnerability with the use of organotypic model systems, and improves the robustness and reliability of the assay. Establishing minimum technical performance parameters introduces flexibility into the assay by setting thresholds that enable a range of acceptable donor performance to account for intrinsic biological variability whilst excluding nonqualified, low-performing donors that add technical variability without informing reliable biological responses. The benchmark potency ranges for the reference chemicals establish quantitative parameters that are critical to evaluating proficiency of method transfer, as well as intra- and interlaboratory reproducibility. These steps satisfy a number of criteria (fitness for purpose, human biological relevance, and technical characterization) necessary for a modular and efficient approach to validation of the hTMT assay (OECD, 2005; van der Zalm et al., 2022).
Declaration of conflicting interests
The authors declared no potential conflicts of interest with respect to the research, authorship, and/or publication of this article.
Disclaimer: The views expressed in this article are those of the authors and do not necessarily reflect the views or policies of the U.S. Environmental Protection Agency. Mention of trade names or commercial products does not constitute endorsement or recommendation for use.
Acknowledgments
The authors thank Dr Steve Simmons, Dr Stephanie Padilla, and Dr Kelly Carstens for technical review and critical reading of the manuscript.
Funding
U.S. Environmental Protection Agency.
Data availability
Supplementary data are available at https://doi.org/10.5061/dryad.j9kd51cjv.

Comments