


Abstract
The exponential increase in global plastic usage has led to the emergence of nano- and microplastic (NMP) pollution as a pressing environmental issue due to its implications for human and other mammalian health. We have developed methodologies to extract solid materials from human tissue samples by saponification and ultracentrifugation, allowing for highly specific and quantitative analysis of plastics by pyrolysis-gas chromatography and mass spectrometry (Py-GC-MS). As a benchmark, placenta tissue samples were analyzed using fluorescence microscopy and automated particle count, which demonstrated the presence of >1-micron particles and fibers, but not nano-sized plastic particles. Analyses of the samples (n = 10) using attenuated total reflectance-Fourier transform infrared spectroscopy indicated presence of rayon, polystyrene, polyethylene, and unclassified plastic particles. By contrast, among 62 placenta samples, Py-GC-MS revealed that microplastics were present in all participants’ placentae, with concentrations ranging widely from 6.5 to 685 µg NMPs per gram of placental tissue, averaging 126.8 ± 147.5 µg/g (mean±SD). Polyethylene was the most prevalent polymer, accounting for 54% of total NMPs and consistently found in nearly all samples (mean 68.8 ± 93.2 µg/g placenta). Polyvinyl chloride and nylon each represented approximately 10% of the NMPs by weight, with the remaining 26% of the composition represented by 9 other polymers. Together, these data demonstrate advancements in the unbiased quantitative resolution of Py-GC-MS applied to the identification and quantification of NMP species at the maternal-fetal interface. This method, paired with clinical metadata, will be pivotal to evaluating potential impacts of NMPs on adverse pregnancy outcomes.
The persistent and growing global reliance on plastics has ushered in a modern era punctuated by the ubiquitous presence of degraded nano- and microplastics (NMPs) in our environment (Geyer et al., 2017). Although often defined as measuring <5 mm in size, NMPs are exponentially more numerous in the nanometer-to-micrometer size range, and their microscopic nature makes them virtually omnipresent, infiltrating ecosystems and penetrating the food chain, ultimately reaching the human body itself (Ragusa et al., 2021). In the era of the Anthropocene, the age characterized by humanity’s profound impact on the planet, microplastics represent an exponentially growing concern for our health and well-being. The toxicological consequences of microplastic ingestion and inhalation remain relatively unexplored, largely owing to the challenges in our limited ability to quantify and identify the extent to which NMPs accumulate in human tissues.
Numerous studies have documented the presence of microplastic particles in mammalian visceral organs and fluids, including placentae (Ragusa et al., 2021), gut (Kniese et al., 2023), lung (Jenner et al., 2022), and blood (Leslie et al., 2022). For the most part, however, these assessments have been based on spectroscopic imaging techniques, which allow for the identification of individual particles as a specific polymer subtype based on their unique Raman or Fourier-transform infrared (FTIR) spectral signatures. Such techniques, however, are limited by resolution and are largely incapable of identifying particles <1 µm and cannot be used to accurately estimate microplastic mass concentration. Additionally, measuring a single particle at a time, even with computer-aided imaging platforms, is time consuming and tedious. In a recent breakthrough, Leslie et al. (2022) applied pyrolysis-based gas chromatography and mass spectrometry (Py-GC-MS) to obtain quantitative mass concentrations of plastics in the blood, with samples ranging from negligible concentrations (below levels of detection) to 12 µg plastics/ml blood. Despite the rigorous methods used in that study, the technique is largely limited to aqueous samples; thus, new approaches were needed to assess plastics in tissues.
The present methodological report details the application of a straightforward tissue digestion technique, akin to saponification, to digest rigorously and uniformly collected human placental tissue to isolate microplastics for Py-GC-MS analysis.
Materials and methods
Statement of compliance
All procedures were reviewed by the University of New Mexico Human Research Protections Office, and approved as an exempted study utilizing banked, de-identified human samples. Analysis of microplastics from de-identified banked human placentae was approved by the Baylor College of Medicine IRB Protocol H-30688. The human placentae were originally collected after informed consent via the Baylor College of Medicine Perinatal Biobank (PeriBank) under the approved protocol H-26364, and the placentae analyzed in this study were collected between 2011 and 2015 and stored at −80°C without freeze thaw or realiquoting.
Subjects
Subjects were recruited by trained PeriBank study personnel who approach eligible gravidae at the time of admission to labor and delivery. After consent was obtained, over 4700 variables of clinical information (clinical metadata) were directly extracted from the electronic medical record and accompanying prenatal records alongside directed subject questioning. Clinical metadata were extracted from the PeriBank database. Data entry into PeriBank was completed by trained study nurses and research staff. A subset of charts was routinely audited by a boarded maternal-fetal medicine physician scientist (K.M.A.) and study personnel to ensure quality of the data.
Sample collection
All samples were collected according to a uniform protocol designed by perinatal and placental pathology-trained personnel in our universal perinatal database and biospecimen repository (PeriBank) (Antony et al., 2016; Kahr et al., 2016; Suter et al., 2019). Placental tissue was collected in cuboidal sections, which are circumferentially excised 4-cm equidistant from the cord insertion site. The maternal decidua and fetal chorion-amnion was excised and discarded to avoid potential contamination from maternal, fetal, or environmental surface exposure during delivery. These clean and sterile conditions are standardized technique in the banking of all PeriBank specimens and are followed by immediate flash freezing at −80°C. In total, 81 samples were transferred to the University of New Mexico for analysis. A subset of samples (N = 2) was used for FTIR spectroscopic characterization. Several samples were consumed by optimization of the digestion preparation and pyrolysis analysis (N = 17) and the remaining (N = 62) were used for Py-GC-MS analysis.
Placenta sample digestion and MP isolation
Figure 1 provides an overview of the methods for digestion and visual and spectrometric quantification. Potential contamination of external plastics was considered and minimized throughout the protocol. Digestion of placenta samples was performed on each entire aliquoted placental specimen, averaging approximately 0.4 g in weight, and immersing samples with 3× the tissue volume of 10% potassium hydroxide (KOH). The alkaline potassium hydroxide digestion is commonly used as an effective procedure allowing the extraction and separation of plastic particles from biological tissues without the degradation of polymer plastics (Dehaut et al., 2016; McIlwraith et al., 2021). The digestion process was carried out in glass vials. These samples were incubated at 40°C, with continuous agitation, for 72 h. Following digestion, the supernatant was placed in ultracentrifuge tubes and 200 µl of 100% ethanol was added to each tube. Samples then underwent ultracentrifugation at 100 000 × g for 4 h. This step effectively separated the supernatant from the isolated microplastic pellet that formed; the supernatant was a dark brown color, but transparent. The supernatant was removed and isolated pellets were washed 3× using 100% EtOH and allowed to dry at room temperature for 24 h. Samples were then stored in glass vials for FTIR imaging and quantitative analysis via Py-GC-MS
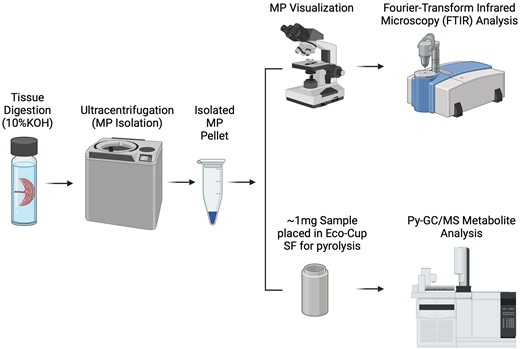
Diagram illustrating microplastic isolation methods by tissue digestion/saponification and visual spectroscopic (N = 10) and chromatography-based spectrometric analysis (N = 62). Illustration created with a licensed version of BioRender.
Visualization and spectroscopic characterization of microplastics
Samples of isolated plastics were removed from initial pellet and placed in 100% ethanol in glass tubes for a minimum of 24 h at 4°C to resuspend samples before imaging. Slides were prepared by adding 50 µl of sample and NMPs were imaged via polarized light microscopy using an Olympus BX51 microscope. An ultraviolet light source was used to verify that the remaining solids were plastic in nature based on fluorescence.
Particle quantification with fluorescence microscopy
Particle count was performed according to Quiambao et al. (2023). Briefly, samples (n = 10) were rinsed with approximately 10 µl of 1M HCl to dissolve excess of salts remaining from the extraction process. Subsequently, particles were carefully transferred to aluminum oxide (Al2O3) filter membranes (Cytiva Whatman Anodisk; Diameter Outer: 25 mm, Pore Size: 0.2 µm) under the fume hood using pipettes and high ethanol purity. Each filter was imaged with a stereomicroscope right after the transfer. Next, to prepare for particle imaging with fluorescence microscopy, each Al2O3 filter was placed in a clean glass petri dish where a few drops (<30 μl) of 10 μg Nile Red/l methanol solution was added to cover the filter flow-through area. The filters were left to react with the dye for 10 min then were rinsed with 200 μl of n-hexane on a glass filtration stack to remove excess dye before being placed in a Greiner 6-well plate. The filters were imaged using a fluorescence microscope (Cytation 5 Cell Imaging Multi Mode Reader, Agilent Technologies) with Gen5 software. The detection limit of Cytation 5 cell Imaging at this magnification is approximately 0.5 µm. Using the software, a series of images were taken at 4× magnification with an RFP filter cube (excitation 531 nm/emission 593 nm) to produce a stitched image of each filter. Each image was preprocessed to reduce background fluorescence. When necessary, further reduction of background fluorescence was done by increasing image contrast and decreasing brightness. For quantification, each filter’s overall image was run through the MPVAT 2.0 macros using ImageJ (Prata et al., 2020). Each filter was run through MPVAT 2.0 three times and the average was reported. Only the filter flow-through area (13 mm diameter) was considered for quantification.
Attenuated total reflectance-Fourier-transform infrared spectroscopy
Portions of isolated microplastic pellets from digested/saponified placental samples (n = 2) were then analyzed with attenuated total reflectance-Fourier-transform infrared spectroscopy (ATR-FTIR) to confirm functional chemistry and polymer type. Each filter was mounted on a gold mirror slide. Using OMNIC Picta software, a mosaic image of the filter flow-through area was taken. A reflectance map was acquired to guide the selection of potential plastic particles for further examination with ATR. Ten particles were selected each time manually on the filters for particle identification with ATR-FTIR (Thermo Nicolet iN10 MX) with a detection limit of 20 μm, using a cooled detector and Germanium tip. The aperture size was adapted to fit each particle. The resulting spectra were searched against the HR Polymer Additives and Plasticizers, Hummel Polymer Sample Library, Polymer Laminate Films, Synthetic Fibers by Microscope libraries, and an in-lab made generated library that accounts for UV-weathered particles. A value >60% was considered an acceptable match (%) with the polymer type.
Py-GC-MS quantification
Py-GC-MS was performed using an Agilent 6890 GC/5975 MS system (Agilent, Santa Clara, CA) that used an EGA/PY-3030D Pyrolysis unit that is set to “single shot” Mode (Frontier Labs, Koriyama, Japan) and Ultra Alloy microplastics (UAMP) Column kit specifically designed for microplastics analysis (UA5-30M-0.5F, Frontier Labs, Koriyama, Japan). To begin, the Agilent GC-MS system, calibrated and configured for the analysis, is set up in accordance with the Agilent manufacturer’s guidelines. The system is augmented with a Frontier pyrolysis unit that is securely attached and integrated into the instrument’s control software. Isolated microplastics samples were weighed using a microbalance (EPE26 Precision Balance, Mettler Toledo) and meticulously placed into a stainless-steel Eco-cup SF sample cup (Frontier, Koriyama, Japan). The sample cup is then loaded into the pyrolysis unit, ensuring precise positioning for optimal analysis. Pyrolysis parameters are carefully defined using dedicated software (F-Search MPs v 2.1; Frontier Labs, Koriyama, Japan), encompassing crucial factors such as the pyrolysis temperature, hold time, and carrier gas flow rate. The temperature at which the sample is heated, the duration of thermal exposure, and the flow rate of an inert carrier gas (helium) for transporting pyrolysis products to the GC column are among the critical parameters configured. The pyrolysis process is initiated through the software interface. During this phase, the sample is heated slowly to 600°C, leading to pyrolysis of specific polymers as their unique combustion points are attained. Volatile and semivolatile products associated with plastics that are monomeric (eg, styrene) are volatilized at lower temperatures prior to combustion of polymers (ie, below 300°C) (Leslie et al., 2022). Compounds released at each polymer-specific combustion temperature are subsequently transported to the GC column for separation. The total run time for each sample is approximately 45 min.
The GC/MS analysis ensues with the UAMP column separating the pyrolysis products based on their chemical properties to target 12 polymers of interest for precise identification and quantification. Quantification of the isolated microplastic samples is performed by employing F-Search MPs 2.1 software (Frontier Labs, Koriyama, Japan) to assess and interpret the results generated by the GC/MS system. Compounds are identified and, when applicable, quantified by cross-referencing their mass spectra and retention times by constructing a calibration curve using polymer standards of targeted polymers. The calibration curve was created by using NMPs-CaCO3 calibration standard (Frontier Labs, Koriyama, Japan) at 6 different weights (0.0, 0.1, 0.2, 0.5, 2, and 4 mg). After the calibration curve was created, isolated biospecimen samples were analyzed in F-Search MPs 2.1 software and resulting concentrations were interpreted and quantified for each tissue sample of interest.
Quality control/quality assurance
Polymer standard curves were run on every Py-GC-MS batch (approximately 15–20 samples per batch), as described above, along with blank samples and additional 12-polymer standards at the end of each batch (at 0.5 mg). Any type of plastic tube involved in the study (namely cryovials for storage and the ultracentrifuge tubes) was analyzed by Py-GC-MS. Blank samples were also analyzed selectively throughout the collection of data, where the KOH solution was added to the high-density polyethylene (HDPE) cryovial tubes and centrifugation steps were implemented, but without tissue samples (Supplementary Figs. 1–4).
Data analysis
Data recovered from the F-Search MPs software were normalized to original wet tissue weights for each sample. Statistics of distribution (mean, SD, etc.) were conducted in GraphPad Prism v 10.0.3.
Results and discussion
Following isolation of solids from KOH-digested/saponified placental specimens, pelleted material was redistributed on a microscope slide. ATR-FTIR spectroscopy revealed that NMPs such as rayon, polystyrene, polypropylene, and other polymer particles and fibers were present in the human placenta (Figure 2, Supplementary Figure 5). For each placental pellet, fluorescence microscopy and automated particle count indicated that all 10 placenta filters contained a total count average of 153.07 ± 84.45 particles (Supplementary Table 1). All identified particles can be found in Supplementary Table 1, and all spectra matches can be found in Supplementary Table 2. The spectra samples should only be considered for reporting if they had a >60% match with the polymer library, which limited our observations to identifying the composition of 27 out of 100 particles, with compositions of rayon, polypropylene, polystyrene, and zinc molybdate (Figure 2A). In all cases, salts were coating the plastic surfaces most likely interfering with the IR waves. Even when including particles with low confidence spectra, we observed that over two-thirds of particles were polymer in nature, with others providing spectra suggestive of organic and inorganic/mineral composition (Figure 2B). These observations confirm previous studies which first identified MP fragments in the placenta via Raman spectroscopy (Halfar et al., 2023; Ragusa et al., 2021). Although fluorescence microscopy can identify potential plastic particles and this type of analysis facilitates dimensional and numeric analysis, and ATR-FTIR can evaluate functional chemistry and polymer type, these methodologies are unable to provide a fully quantitative mass concentration and are limited to particles/fibers >1–20 µm in size, depending on the instrument.
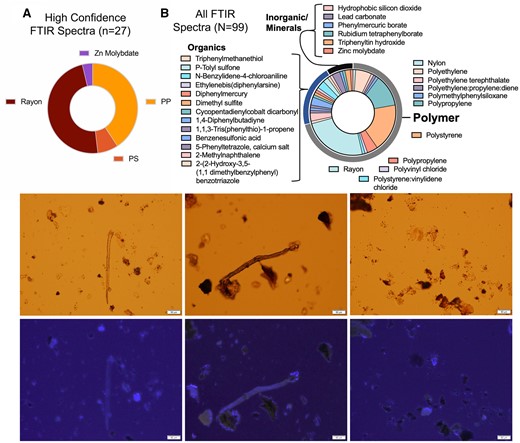
Top, representative results of FTIR-based characterization of particles and fibers from these samples confirms presence of polymers but also mineral-based solids. Shown are distributions of particles rendering spectra with high confidence identifications (A) and all particles, even including lower confidence spectra (B). Bottom, light microscopy examples, combined with UV light illumination for polymers, illustrates numerous probable particulates remaining in pellet after tissue saponification and ultracentrifugation. Various sized particles and fibers are easily detected in placental tissue. Scale bar indicates 50 µm.
The Py-GC-MS spectra from the isolated pellet were highly consistent with the spectra derived from the 12 polymers in the commercial standard utilized to generate standard curves (Figure 3). Although additional peaks were noted from pyrolysis of the placental samples, the mass spectrometric signatures of the 12 standard polymers appeared consistent with those in the placental pellets. Py-GC-MS detected NMPs in all solid pellet fractions from the saponified placental biopsies (62 out of 62), with a range from 6.5 to 685 µg total microplastics/g of tissue (Figure 4). Although we took every opportunity to avoid contact with plastic surfaces, the samples were originally stored in plastic tubes and also in contact during ultracentrifugation. As all samples were handled identically, any contamination should be consistent; the wide range in these samples with numerous values for individual polymers below the level of detection suggests that whatever contamination is present is quite low. We offer that microplastics are really derived from the oxidized and weather plastic material that is many decades old, and fresh plastic tubes are not likely to be a source of plastics that diffuse into frozen tissues, though this was not specifically addressed in the present study.
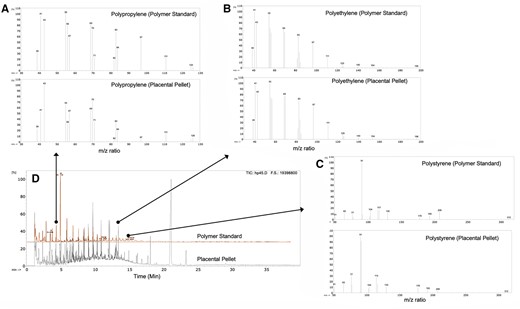
Spectra of standard calibration of 12 known polymers, compared with spectra of solids derived from placenta sample following KOH-digestion and ultracentrifugation Representative mass spectra are show for both samples are then shown for (A) polypropylene (retention time = 4.5 min), (B) polyethylene (retention time = 13.2 min), and (C) polystyrene (retention time = 14.5 min). Lower left image (D) demonstrates the overlapping peaks from the pyrolysis system of the polymer standards and the pellet derived from placental samples.
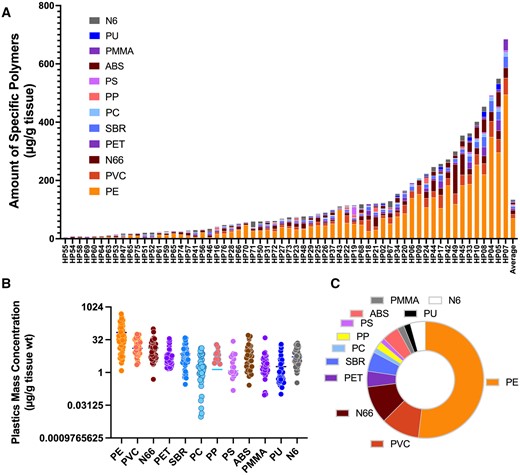
Plastics mass concentration and quantification of total plastics in human placenta samples. A, Individual samples from 62 subjects reveals the range of total plastics and general composition for each. B, Range of each of 12 polymers detected in placentae. C, Average proportional composition of the 12 measured polymers in all samples tested. Polymer abbreviations: PE, polyethylene; PVC, polyvinyl chloride; N66, Nylon 66; SBR, styrene-butadiene; ABS, acrylonitrile butadiene styrene; PET, polyethylene terephthalate; N6, Nylon 6; PMMA, poly(methyl methacrylate); PU, polyurethane; PC, polycarbonate; PP, polypropylene; PS, polystyrene.
Approximately 50% of samples showed presence of 9 or more measured polymers, with the most predominant polymer present being polyethylene. The average total NMP concentration was 126.8 ± 147.5 µg/g and the median of 85.8 µg/g, but with 20% of samples (13 out of 62) containing over 200 µg/g. Among the various polymers present, polyethylene was the most prevalent at 54% of total NMP concentration, consistently found in 96% of samples with an average concentration of 68.8 ± 93.9 µg/g of placental tissue (Table 1). Polyvinyl chloride and nylon each represented approximately 10% of the MPs by weight, with the remaining 26% of the composition represented by 9 other polymers (Table 1). The predominance of PE detection in our placental human samples interestingly reflects the overwhelming abundance of this polymer in the environment and its widespread production and use in the United States, especially in single-use products (Brignac et al., 2019; Geyer et al., 2017; Jung et al., 2018). A noted limitation of our Py-GC-MS standard was the absence of rayon, which was represented in high quantities in the ATR-FTIR analysis, which would imply that our total mass concentration determination is an underestimate.
Descriptive statistics for all polymers in placental samples
| Polymer type | No. of values above limit of detection (LOD; out of 62) | Mean | SD | Minimum (approximate LOD) | 25% percentile | Median | 75% percentile | Maximum |
|---|---|---|---|---|---|---|---|---|
| Polyethylene (PE) | 60 | 68.8 | 93.9 | 1.2 | 13.7 | 32.7 | 93.7 | 494 |
| Polyvinyl chloride (PVC) | 38 | 12.9 | 15.9 | 2.27 | 8.23 | 14.3 | 32.9 | 57.2 |
| Nylon 66 (N66) | 59 | 13.4 | 16.6 | 0.484 | 4.73 | 8.37 | 17.5 | 101 |
| Styrene-butadiene (SBR) | 54 | 7.15 | 9.13 | 0.286 | 2.82 | 5.04 | 10 | 39.1 |
| Acrylonitrile butadiene styrene (ABS) | 36 | 5.65 | 11 | 0.259 | 1.53 | 4.64 | 10.6 | 51.1 |
| Polyethylene terephthalate (PET) | 57 | 5.42 | 6.9 | 1.46 | 2.42 | 3.57 | 5.96 | 36.3 |
| Nylon 6 (N6) | 45 | 5.23 | 6.01 | 0.334 | 2.55 | 5.11 | 10.5 | 22.6 |
| Poly(methyl methacrylate) (PMMA) | 34 | 1.98 | 5.23 | 0.0918 | 0.961 | 1.67 | 3.75 | 39.2 |
| Polyurethane (PU) | 46 | 1.84 | 3.97 | 0.101 | 0.383 | 0.773 | 2.51 | 19.9 |
| Polycarbonate (PC) | 36 | 1.76 | 3.14 | 0.00923 | 0.634 | 1.73 | 4.55 | 13.3 |
| Polypropylene (PP) | 11 | 1.35 | 3.58 | 2.45 | 3.54 | 6.18 | 8.72 | 19 |
| Polystyrene (PS) | 19 | 1.19 | 3.8 | 0.149 | 0.857 | 1.76 | 6.3 | 27 |
The results of the analysis show a wide range and surprisingly high values in some samples. The reason for this may relate to unknown uncertainties or errors in the analysis process, although we handled tissues consistently and employed numerous negative controls to eliminate sources of error. The other potential is that the range is real and driven by a combination of environmental, dietary, genetic, maternal age, and lifestyle factors. The factors that drive such extreme concentration ranges are not known, nor is it apparent if such concentrations contribute negatively to growth and development of the placenta or fetus, or to other maternal health consequences. The placenta receives relatively high blood flow and takes up a great deal of nutrients from the maternal blood, which might make it more highly exposed; the extent to which NMPs can be carried across the complex placental barrier, either passively or actively, requires further investigation (Cary and Stapleton, 2023). Visual characterizations of plastics in placentas from 43 donors provided clues that intrauterine growth restriction may be driven by microplastics, with smaller plastics more tightly associated with morbidity, but methodologically the research team was unable to examine submicron sizes (Amereh et al., 2022). Given the average human placental weight at term approximates 500 g (corresponding to a 500 ml volume) (Sathasivam et al., 2023), the cumulative microplastics mass would approximate 400–500 mg. NMPs can translocate from the GI tract and distribute to various organ systems (Garcia et al., 2023); evidence also suggests that inhaled nanomaterials can gain systemic access and specifically accumulate in the placenta (Liu et al., 2021), but the dosimetry is likely to be far less than in the gut. Fluorescent 25 nm polystyrene microspheres gavaged in pregnant rats at gestational day 19 were readily identified visually (often as agglomerates) in the placenta 24 h later (Cary et al., 2023). Pregnant mice receiving 5 µm or 50 nm polystyrene microspheres in the drinking water throughout pregnancy exhibited hemodynamic changes in the placental circuit and fetal middle cerebral artery (Dibbon et al., 2024).
Reported concentrations in the blood ranged from below levels of detection to 12 µg/ml (Leslie et al., 2022), seemingly very low compared with that measure in the placentae, suggesting that plastics may accumulate in specific organs. The placentae were only approximately 8 months of age; thus, accumulation can be substantial in a short period of time, relative to the total human lifespan. The dynamics of NMPs absorption, distribution, and accumulation in various target organs remains unknown and more research is needed to identify those factors that influence uptake and clearance of plastics. Although this current approach using KOH saponification and ultracentrifugation to isolate solid NMPs is destructive, we believe application to banked samples in repositories around the country, in addition to prospective sample collection studies, will provide the quantification necessary to assess potential health impacts of NMPs.
Our tissue digestion using KOH approach allows for removal of most biological material while preserving the solid materials in tissue samples. As such, this approach may be better described as polymer “enrichment” rather than “isolation.” There was little correlation between the weight of the dried pellet and the concentration of polymers (Supplementary Figure 6), which we believe relates to the presence of mineral particulates observed by ATR-FTIR, along with residual biological matrix. A small but significant relationship between the total amount of plastics in a given pellet and the pellet weight was observed (after log transformation of the weights, R2=0.155, p = .0017), but no association was evident between the concentration of plastics in a complete sample and the ultimate weight of the pellet obtained from that sample. It is notable that the lack of association between the pellet weight and mass of polymer particles diminishes concerns that biological material artificially inflated the values determined by Py-GC-MS. Although some biological components (protein, lipid) likely remained behind in the pellet and would have been combusted in the pyrolysis analysis, the Py-GC-MS approach is unlikely to be biased by this biological matrix as the polymer standards are accurate based on both combustion point and ion mass separation (Figure 3), allowing for identification of polymer-specific ions. In addition, the application of low temperature in Py-GC-MS thermally desorbs the interference with the sample matrix and any other additives, facilitating the identification of plastic polymers at higher combustion temperatures. An ideal negative control would be a placenta—or any frozen human tissue—that was stored in plastic containers but with a collection date long preceding the emergence of NMPs (probably >40 years ago). Without such a sample, we did confirm that the tubes for storage and ultracentrifugation are principally composed of polypropylene (approximately 65%) and polyethylene (approximately 34%) with about 1% mass of nylon 66 (Supplementary Figs. 1 and 2). Given that polypropylene is double the concentration of polyethylene, it does not seem probable that substantial concentrations of polymers in the placental samples arose from this material, as the polyethylene measured in placentae was in far greater concentrations than polypropylene. We also confirmed that the ultracentrifugation process, when conducted with the KOH digestion solution for a 4 h spin (plus about 1 h of handling) led to no detectable concentrations of any polymer (Supplementary Figs. 3 and 4). Finally, in simply examining the concentrations of all polymers in the placental samples (Figure 4), it was clear that numerous samples were quite low (10 of 62 were <20 µg/g); thus, assuming consistent handling and preparation of all samples, there is little chance that contamination was a major source of error in samples with much higher measured concentrations.
Based on ATR-FTIR, we could see that many of the particulates were not only plastics, but also minerals, which would be unlikely to pyrolyze in the temperature range (from ambient to 600°C). Moreover, microscopic imaging and ATR-FTIR revealed many particulates that were too small for spectroscopic identification (ie, submicron sizes). We did not employ any filtration methods to better resolve the plastics across different size ranges although this may be valuable for future studies, especially in considering the most prominent size fraction driving health effects. The Py-GC-MS approach can be customized to examine other polymers, based on the inclusion of other materials in the standard polymer curves. The 12 polymers chosen were based on the commercially available package that aligns with a well-curated spectral database. Importantly, this approach does not detail the size or shape of plastics or oxidative changes to surface chemistry that we have shown can alter biological interactions (El Hayek et al., 2023), again limiting the potential value. Mass concentration, however, has classically been the most valuable metric for particulate toxicity research, and this approach enables such measurement. Our settings for ultracentrifugation, at 100 000 × g, assuredly means our derived pellets did not contain all the polymer nanoparticles from samples; thus, our measured mass concentrations are very likely underestimates, but the uncollected nanoparticles will have diminished contributions to overall mass. Lastly, spectral interference from residual biological material in the pellet was not apparent, based on the quality of matching of the mass spectra for specific polymers, and this was not a concern noted for blood samples using the Py-GC-MS (Leslie et al., 2022). We note, however, that these are early applications of a technology to an emerging problem; thus, future studies will undoubtedly refine the approach and reduce variability and uncertainty for such measurements.
Conclusion
Our current research has demonstrated the potential value of Py-GC-MS when applied to human placental specimens in the detection of specific polymer species. Based on ours and others’ findings (Leslie et al., 2022), Py-GC-MS has been validated as a powerful analytical technique for speciation and measured quantitation of NMPs in native human tissue, with the strong indication that NMPs can accumulate in placentae at levels far higher than was measured in blood. This method has demonstrated its potential to play a pivotal role in advancing our understanding of microplastic pollution and its potential health implications. First, using a KOH-based digestion/saponification and ultracentrifugation, we can remove the majority of biological material isolating plastic solids. Second, by breaking down complex polymer structures of microplastics into their constituent compounds, Py-GC-MS allows for precise identification and quantification of multiple NMPs. The wide range of polymers observed in placentae may relate to numerous factors driving uptake and distribution of NMPs in the body but may also indicate that future refinements to this technology are needed. This analytical approach is poised to contribute significantly to the ongoing research efforts aimed at assessing the extent of NMP exposure and aids in unraveling the potential human health outcomes associated.
The authors certify that all research involving human subjects was done under full compliance with all government policies and the Helsinki Declaration.
Supplementary data
Supplementary data are available at Toxicological Sciences online.
Declaration of conflicting interests
The authors declared no potential conflicts of interest with respect to the research, authorship, and/or publication of this article.
Funding
National Institutes of Health (P20 GM130422, P50 MD015496, R01 ES032037, R01 ES014639, K12 GM088021, P50 MD015706, R15 ES034901).

Comments